Meeting Replay
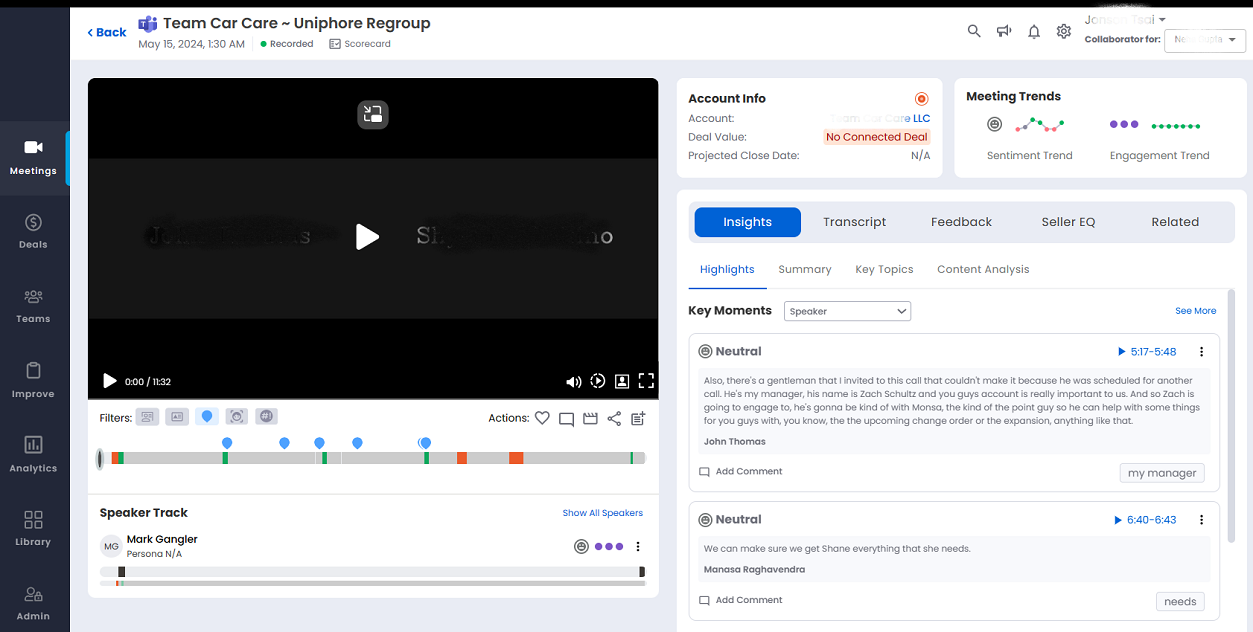
The meeting replay page allows reps to relive the key moments of a sales meeting.
Meeting Information
Shows the meeting name, date and time at which the meeting was uploaded.
The lock icon is provided to manage both the Q access and CRM access. With this the Q access and CRM access are merged into one unified logic. When you click the lock icon the Meeting Access slide out opens up.
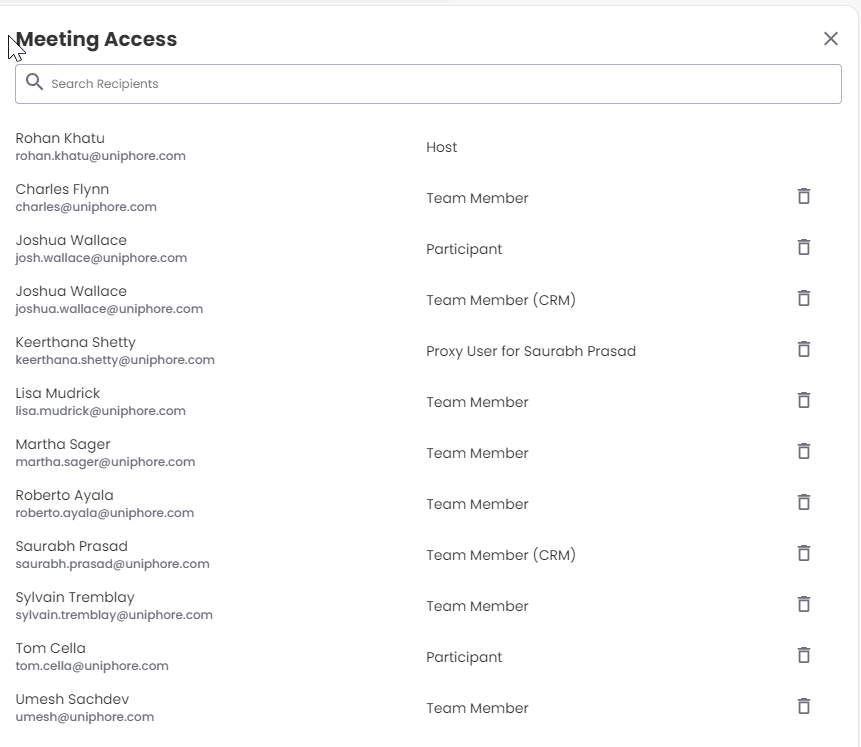
In the search bar type the name of the person you want to search in the Meeting Access list.
The people you have shared the meeting by clicking the share icon in the meeting replay section (See Meeting Replay content for details) get added to the Meeting Access list with the name and email id being displayed.
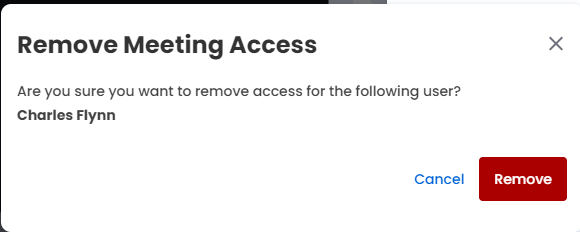
Click the delete icon by the side to remove the meeting access. When you click the delete icon the Remove Meeting Access confirmation window pops out. Click Remove to remove the meeting access else click Cancel.
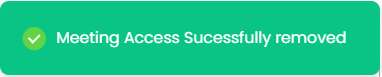
When you click remove a confirmation message pops out.
The meeting host is listed at the top and there is no option remove access to the host.
Left Pane - Video
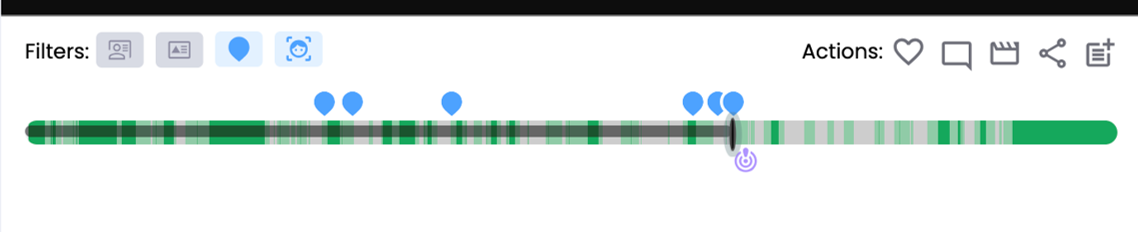
The left half of the page shows you the meeting video. You can control the replay with play/pause/volume. “Sales Interaction Agent” offers a state-of-art computer vision technology, and you can turn on the “under the hood” details by unchecking the default “regular” toggle. The participant panel below shows you the timeline of each participant’s Speech Track so that you can follow them individually. The Speech Track can be collapsed/expanded. See Left Pane – Video Area and Controls.
Account Info
Shows the following details:
Account Name:
Click the account name to view the Overview (Deal View) page.
Deal Size:
Size of the deal (e.g., dollars).
Projected Close Date:
The date at which the deal is projected to be closed.
Sentiment Trend: Sentiment trend graph for this meeting. Click on the trend graph to see an enlarged view of the graph in a pop out. Click and drag to zoom in on specific sections. Click at a point on the graph to play the meeting from that point of time. Drag the slider or click on (+)/(-) icons in the slider bar at the bottom of the enlarged graph to zoom in or zoom out the graph. Click Reset to reset the slider bar.
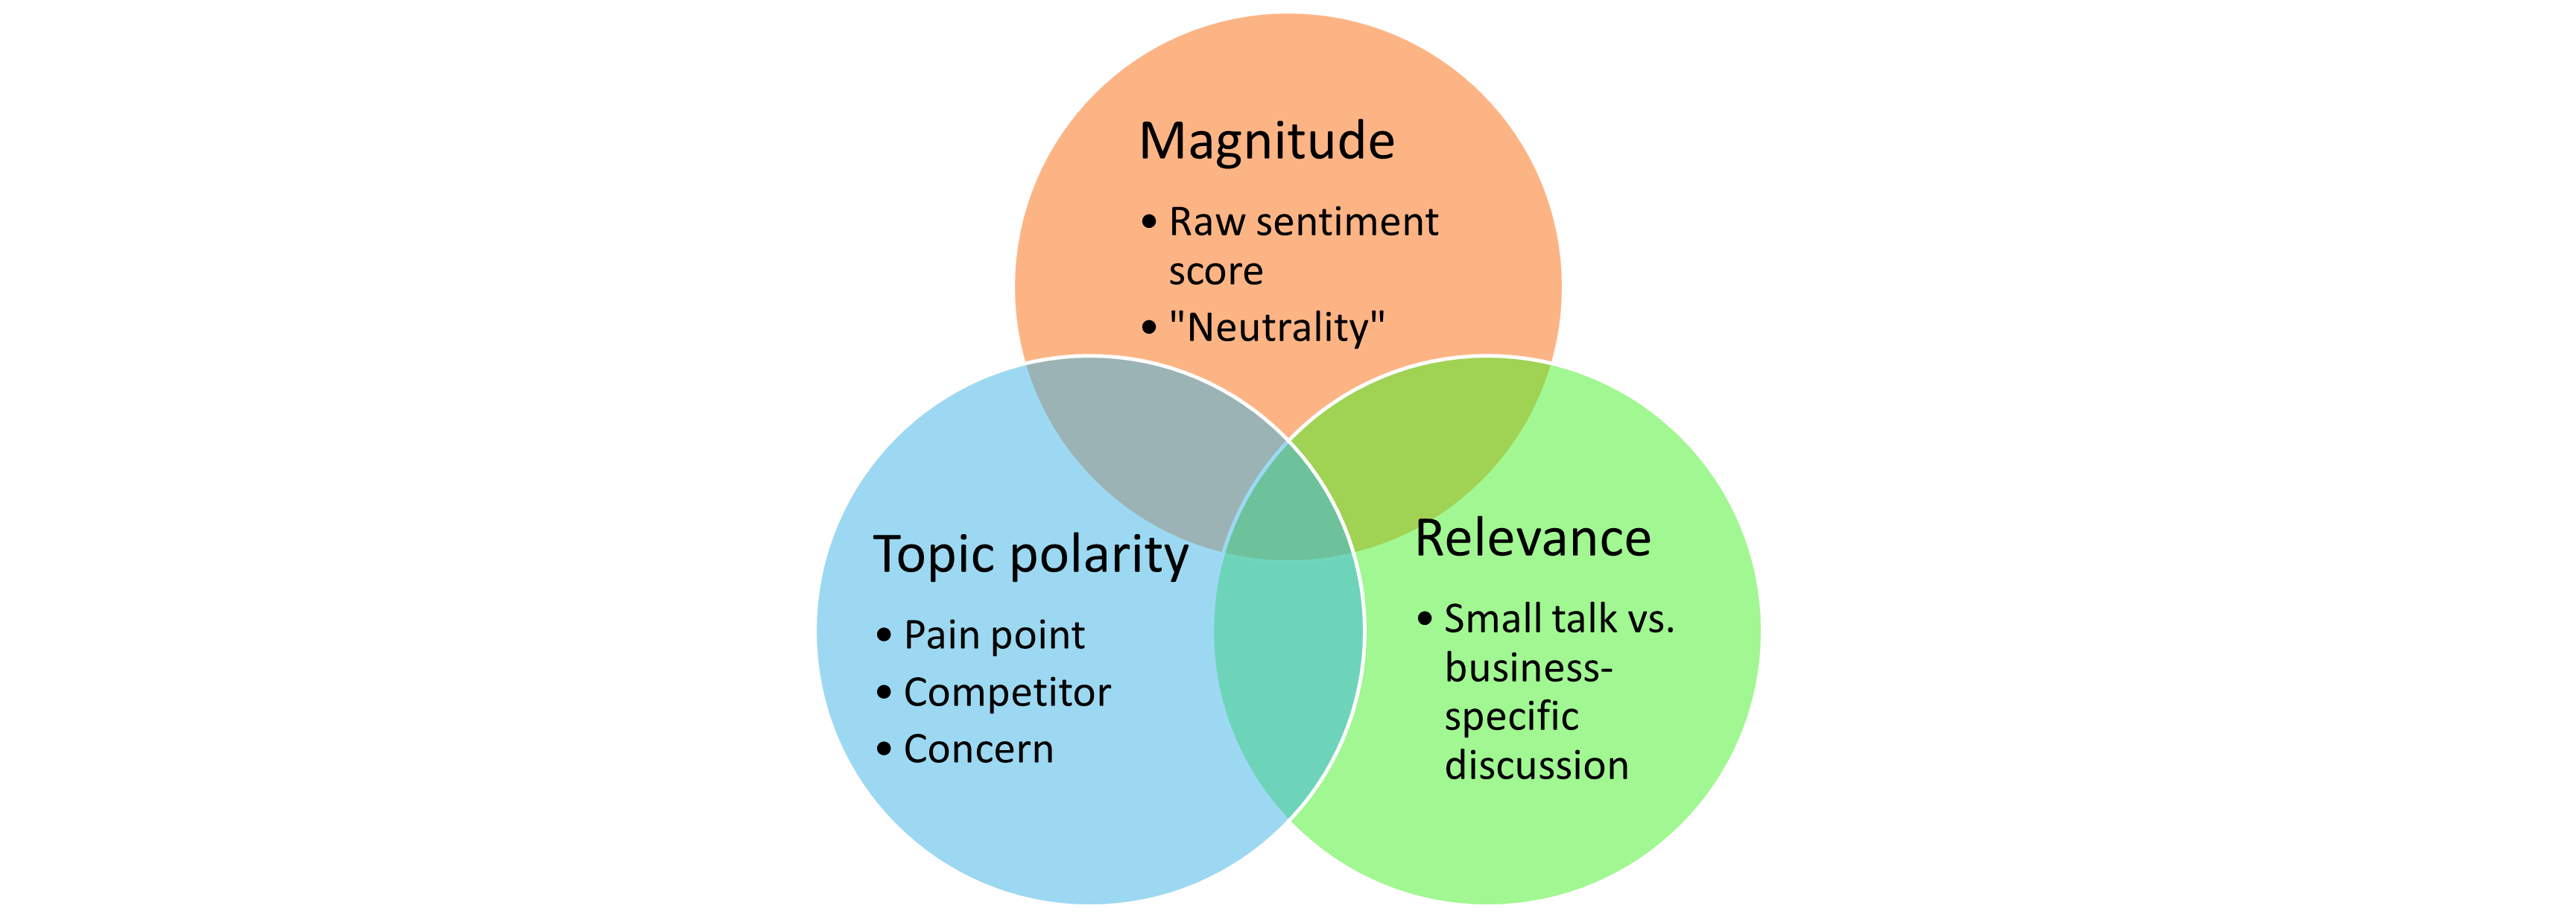
The sentiment value is being measured based on the below three factors:
Engagement Trend:
Engagement trend for this meeting. Click on the trend graph to see an enlarged view of the graph in a pop out. Click and drag to zoom in on specific sections. Click at a point on the graph to play the meeting from that point of time. Drag the slider or click on (+)/(-) icons in the slider bar at the bottom of the enlarged graph to zoom in or zoom out the graph. Click Reset to reset the slider bar.
 The sSentiment Score is represented by this icon next to the sentiment trend.
The sentiment score depicts the contextual sentiment reading. The sentiment alone may not be the complete truth. A negative sentiment may not necessarily mean a negative outcome. For e.g. existing pain point evaluations. Similarly, a positive sentiment may not necessarily mean a positive business outcome. For e.g. small talk. This places the sentiment in a conversational context. Also, customer emotions are only actionable when placed in a conversational context. For a sentiment score which may be either for a key moment or a meeting on the whole the magnitude, topic polarity and relevance are considered. The magnitude represents the raw sentiment score and the neutrality. Topic polarity represents the pain points, competitors and concerns. Relevance is in context of business discussion versus small talk.
Content Analysis Tab
Choose from the tabs listed below to view the details of the meeting information:
Insights (default): Shows the meeting insights.
Transcript: Shows the transcript of the meeting.
Feedback: Shows the reps comments and clips for the selected meeting.
Seller EQ: Shows the EQ for the overall team as well as the individual reps.
Related: Shows all the other meetings associated with the same deal.
Scorecard
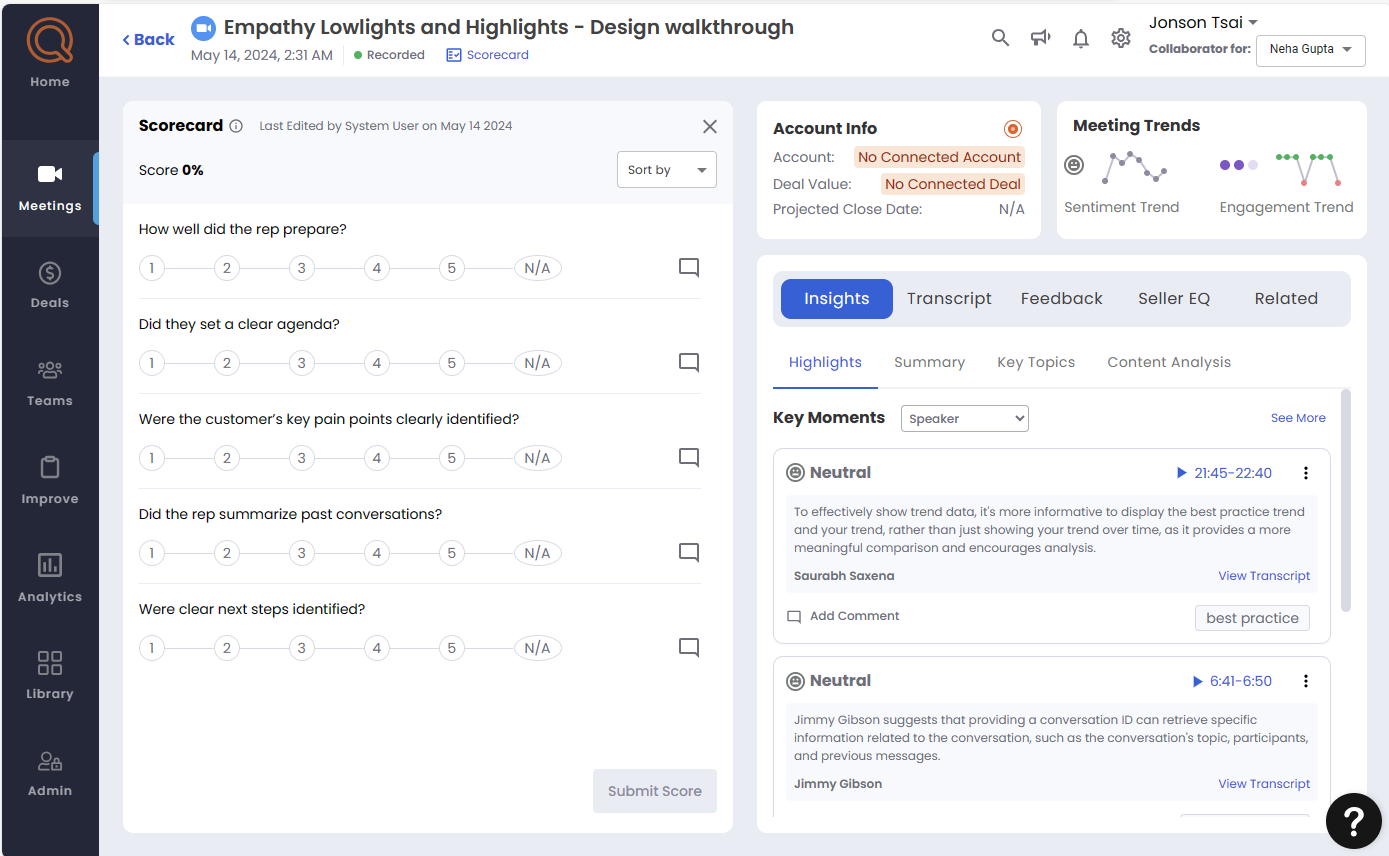
The Scorecard feature is an evaluation system that provides a comprehensive framework for assessing performance of a representative. A Scorecard comprises a set of questions each with a designated weight for scoring. The Scorecards are manually assessed, with the overall score calculated based on the ratings assigned to each individual question. Also, you can provide a comment for the individual question.