Overview (Deal View)
The deal overview page shows the trending insights information during the deal lifecycle and lets you study the causes of upswings and downswings in the insights of the deal using key moments.
With a few clicks, sales reps and managers can quickly view customer insights at a cumulative or individual account level, identify the potential risks and opportunities, pinpoint the associated discussion topics, and quickly relive meeting moments to gain accurate knowledge. They can then take those insights to mitigate risks and improve their deal winning probability.
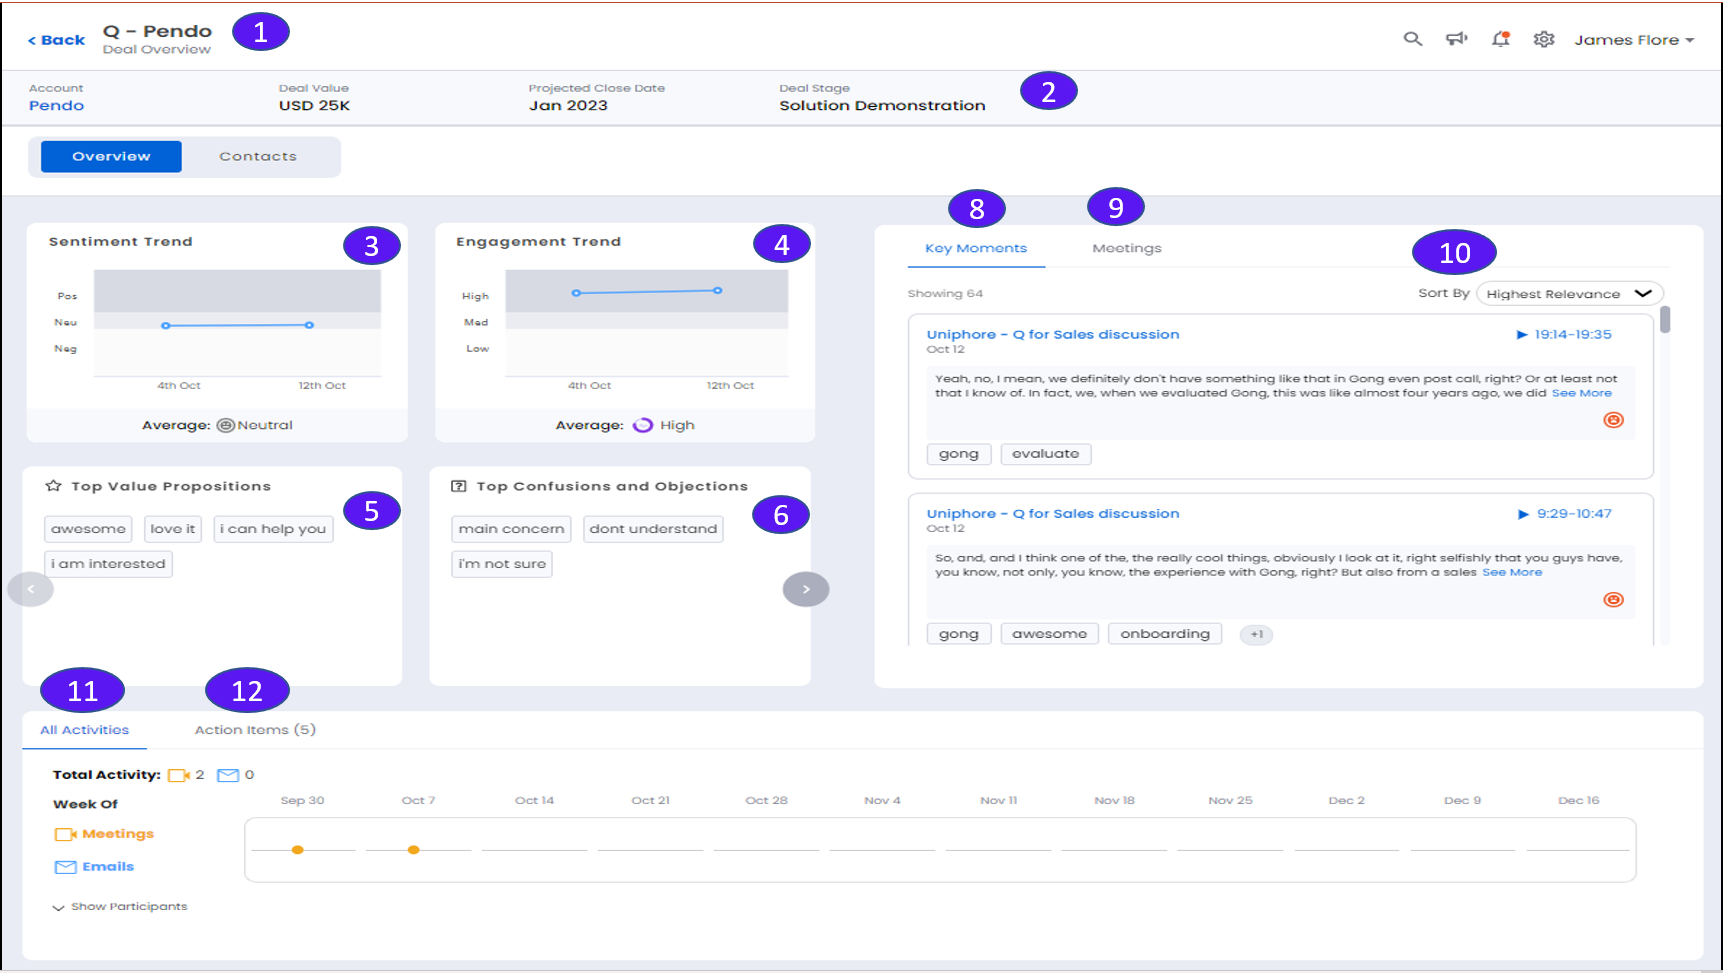
1. Deal Name
The name of the deal associated with this deal overview page.
2. Top Ribbon
Shows the Account name [Click to view the Overview (Account View) page], Deal Value (In USD), Projected Close Date and the Deal Stage.
3. Sentiment Trend
Using this interactive graph, you can review this deal’s sentiment trends over the past four months. These trends Indicate the overall Insights health condition. A downward trending sentiment is a warning signal to the sales rep and calls for corrective actions.
“Sales Interaction Agent” reports the news and tells you their leading causes. Click on one of the dots or the trend lines on the trend graph, and the content shown in Key Moments and Meetings gets refreshed to show the leading causes of that deal insights result.
Click on the graph to refresh and show more details in "Top Value Propositions" and "Top Confusions and Objections" panes. There is a right arrow on this carousel. If you click on it, you can see the third pane named "Top Discussions.” Those are the generic discussions you had with your client, without a clear indication of either positive or negative sentiment. You can review the discussion of those meeting moments or replay the associated meeting.
Click on the tags available in the above-mentioned panes, and the right panel shows you the most relevant meeting moments that contain those discussion topics.
4. Engagement Trend
Using this interactive graph, you can review this deal’s engagement trends over the past four months. These trends Indicate the overall Insights health condition. A downward trending engagement is a warning signal to the sales rep and calls for corrective actions.
"Sales Interaction Agent” reports the news and tells you their leading causes. Click on one of the dots or the trend lines on the trend graph, and the content shown in Key Moments and Meetings gets refreshed to show the leading causes of that deal insights result.
Click on the graph to refresh and show more details in "Top Value Propositions" and "Top Confusions and Objections" panes. There is a right arrow on this carousel. If you click on it, you can see the third pane named "Top Discussions.” Those are the generic discussions you had with your client, without a clear indication of either positive or negative sentiment. You can review the discussion of those meeting moments or replay the associated meeting.
Click on the tags available in the above-mentioned panes, and the right panel shows you the most relevant meeting moments that contain those discussion topics.
5. Top Value Propositions
Shows the values proposed to the customer, which the customer agrees upon (positive reactions). Click any topic to refresh the right pane. The Uniphore backend logic will automatically retrieve key meeting moments for this deal.
6. Top Confusions and Objections
Shows topics that generate customer controversy (negative reactions). Click any topic to refresh the right pane. The Uniphore backend logic will automatically retrieve key meeting moments for this deal.
7. Top Discussions
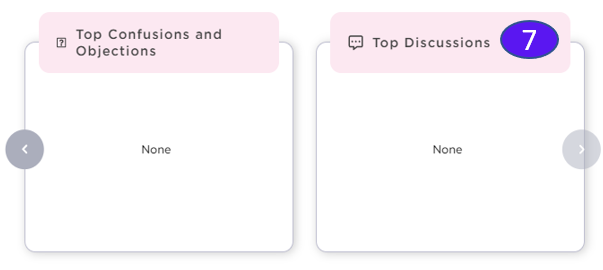
Shows general discussions the sales rep had with the customer (neutral reactions). Click any topic to refresh the right pane. The Uniphore backend logic will automatically retrieve key meeting moments for this deal.
8. Key Moments tab
The default tab shows key moments based on your selections in the left panel. By default, it will show the top key moments related to the average sentiment of the deal. It can be filtered by Highest Relevance or Recency.
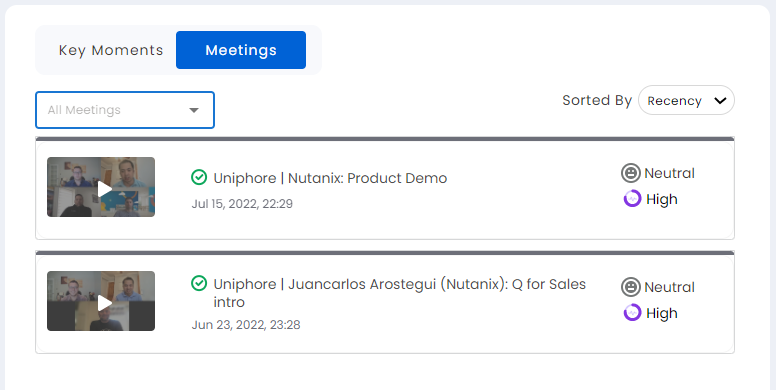
9. Meetings tab
Shows the meetings related to the selected account. By default, they are sorted by recency.
The meetings can be filtered by:
All Meetings
Fully Processed
Not Processed
Processing
Click the meeting icon or meeting name to replay the meeting. See Meeting Replay.
10. Sort By pull down
Use to sort key meeting moments (for example, by highest relevance).
11. All Activities
Here you can review the sales activity history of this deal, including emails and sales meetings. Sales reps and managers can understand which key customer contacts have participated in the conversation and identify who should be more engaged to keep the deal flowing. Click on one of those activities, and it shows summary information. Click on Show Participants to hide/unhide the participants.
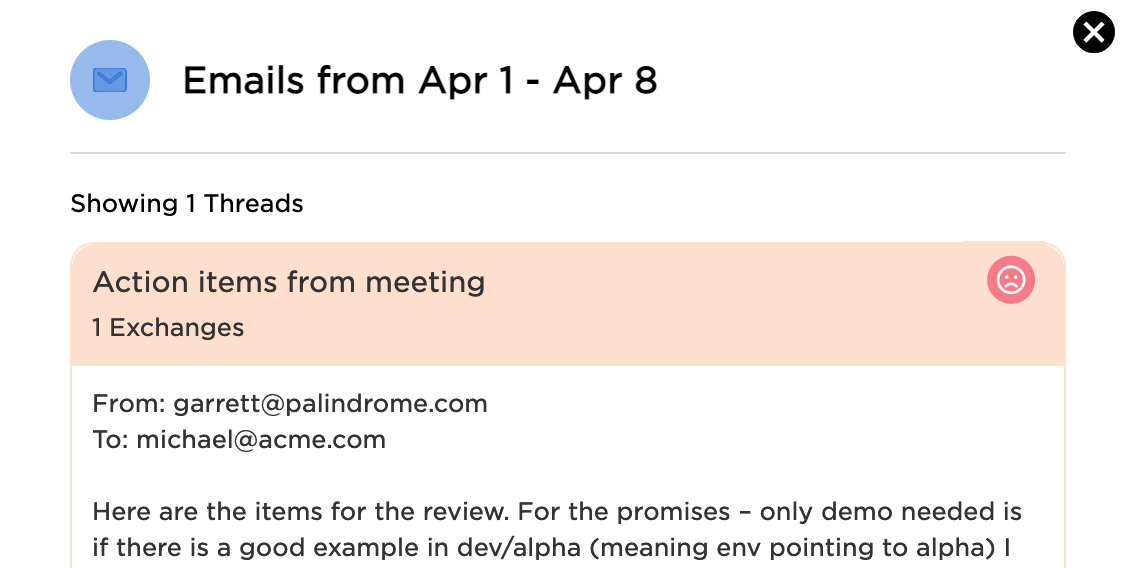
When you click on the email bubble (light blue) on the timeline the email thread is displayed. It shows the full content of this email thread. Also, it analyzes the sentiment of this email thread and shows it as an emoji.
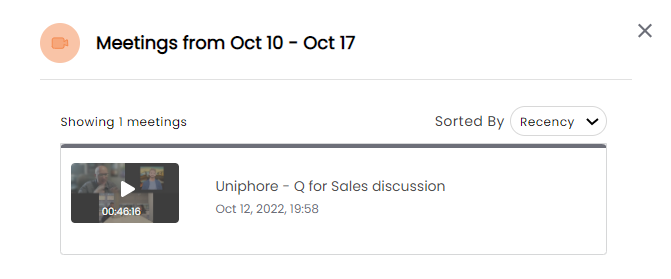
When you click on the meeting bubble (light orange) on the timeline a slide out is displayed at the right that shows the associated meetings that can be sorted by relevance. Click on the meeting to view the Meeting Replay page.
12. Action Items
Displays the action items at particular timelines in the meeting. Click the play button to view the action item in the meeting.

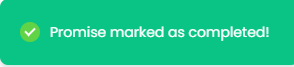
Click the Mark as complete icon to mark the action item as completed. Upon clicking the Mark as complete icon a pop out notification is seen at the upper right corner of the app with the message "Promise marked as completed".
Click the delete icon to delete the action item.