Data Ingestion
Data Ingestion is where you build and manage the data pipelines that bring your data into Business AI Cloud. Each pipeline defines an end-to-end processing path from a configured source connector to a knowledge base destination (vector database), transforming raw structured and unstructured data into vector-stored content that powers RAG operations, knowledge graph construction, semantic search, and analytical workflows.
Key Capabilities
Rapid Experimentation - Test your Document RAG pipeline configuration before committing to a full workflow.
Multiple RAG Pipeline Types - Create pipelines for different data types based on where your data lives and how it is structured.
Flexible Workflow Options - Choose how your pipeline processes data and control each step using a visual, node-based workflow editor.
Scheduled Pipeline Runs - Set up a schedule to run your pipeline automatically at a defined frequency, keeping your knowledge bases up to date without manual intervention.
To access this page, go to the Home page > Data Ingestion.
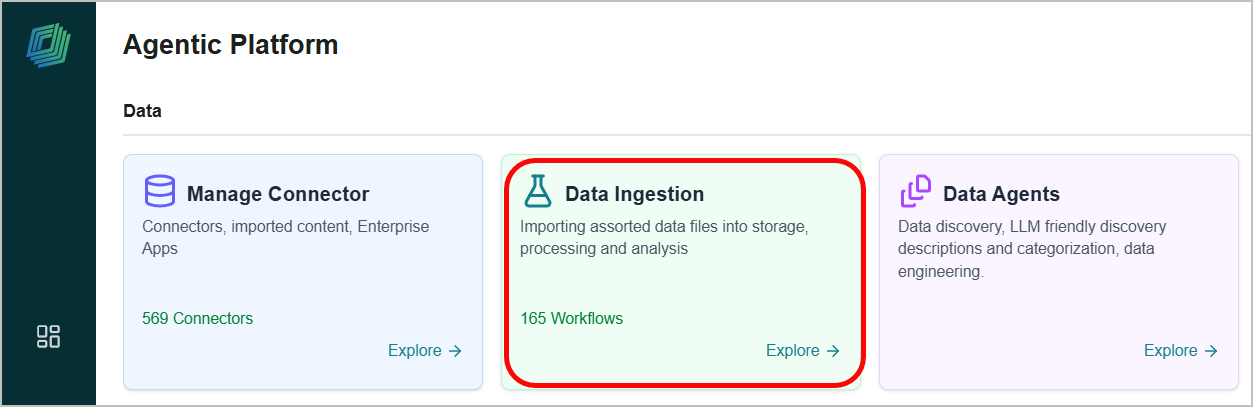
The Data Ingestion page has two tabs:
Workflow - The workflow page helps you create a workflow to ingest your data from its source.
Data Prep - The Data Preparation page helps you prepare your data for ingestion.
You can view the following information on the default Workflow tab:
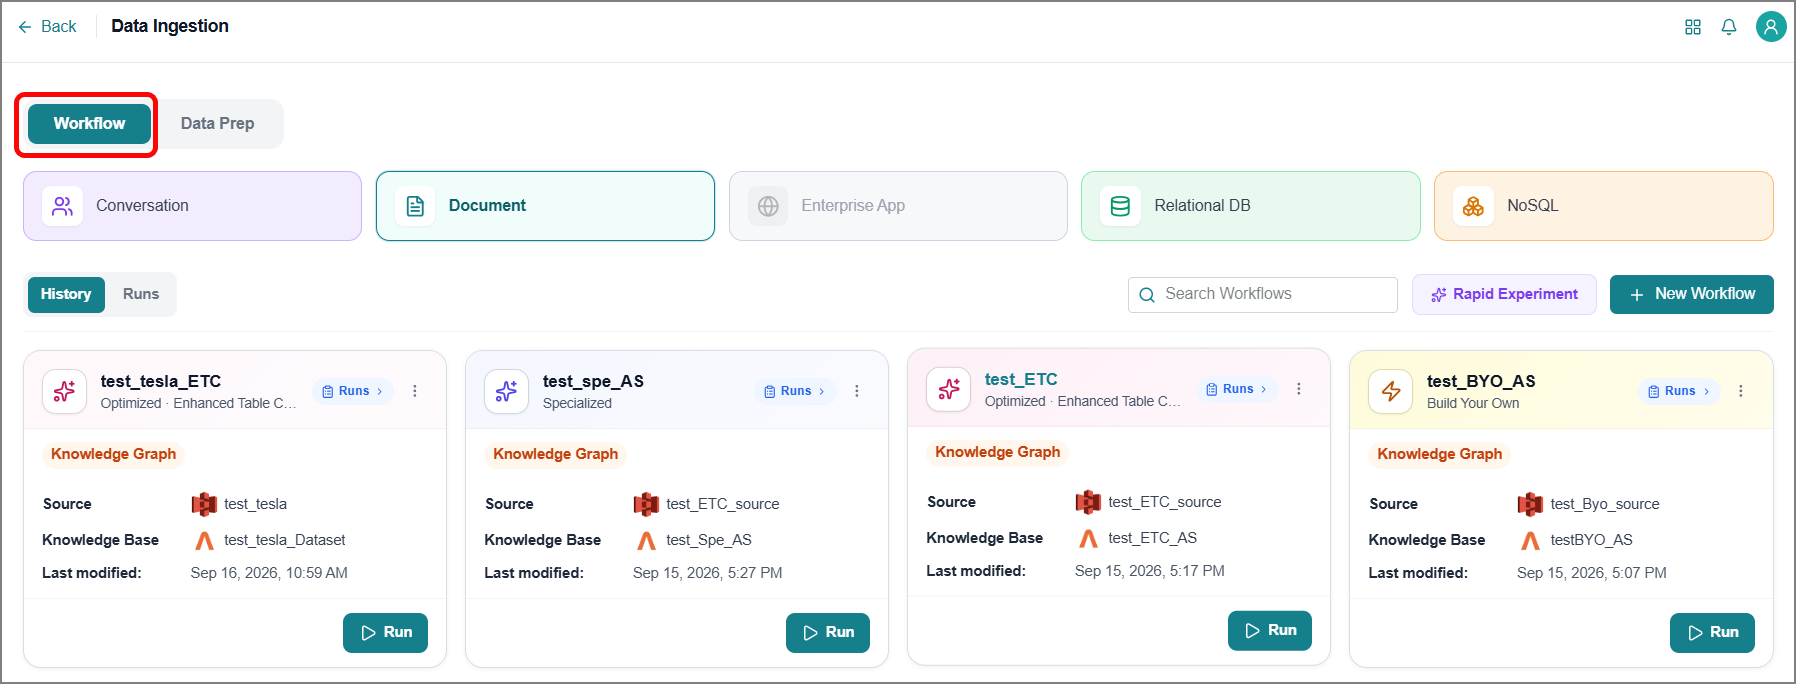
Different RAGs:
Conversation - Use this option to build a workflow that processes data derived from conversations, such as chat transcripts or voice interactions.
Document - Use this option to build a workflow to process unstructured or document-based data, such as PDFs, Word files, or text documents.
Enterprise App - Under development, coming soon!
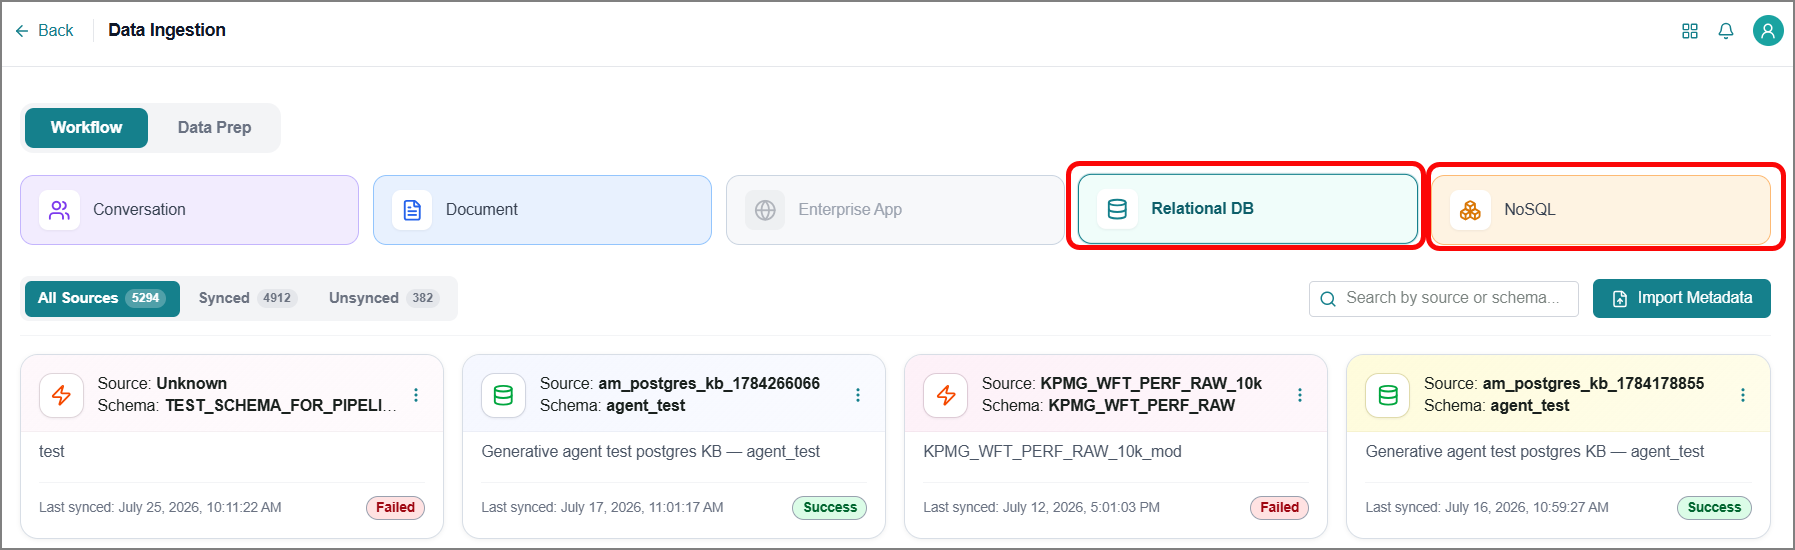
Relational DB - Use this option to build a workflow for structured data stored in relational databases.
NoSQL - Use this option to build a workflow for data stored in non-relational databases, such as document collections or flexible-schema data sources
Rapid Experiment - Allows you to quickly test and validate RAG configurations to optimize workflow performance. This applies only to Document RAG.
History - Displays all workflows created from various RAG configurations.
Runs - Lists all execution instances triggered for all workflows, including details such as workflow name, status, and timestamp.
By consolidating these capabilities, the Data Ingestion page ensures your data workflows remain agile, reliable, and scalable.
Rapid Experimentation
This process enables quick validation of the platform's document configurations before building a pipeline for a dataset, ensuring the data workflow performs optimally. It offers full transparency into how data is processed, helping users better interpret and evaluate the experiment's outcomes.
To begin this process:
On the home page, click Data Ingestion.
The Data Ingestion page opens, and by default, the Document is selected.
Click Rapid Experiment.

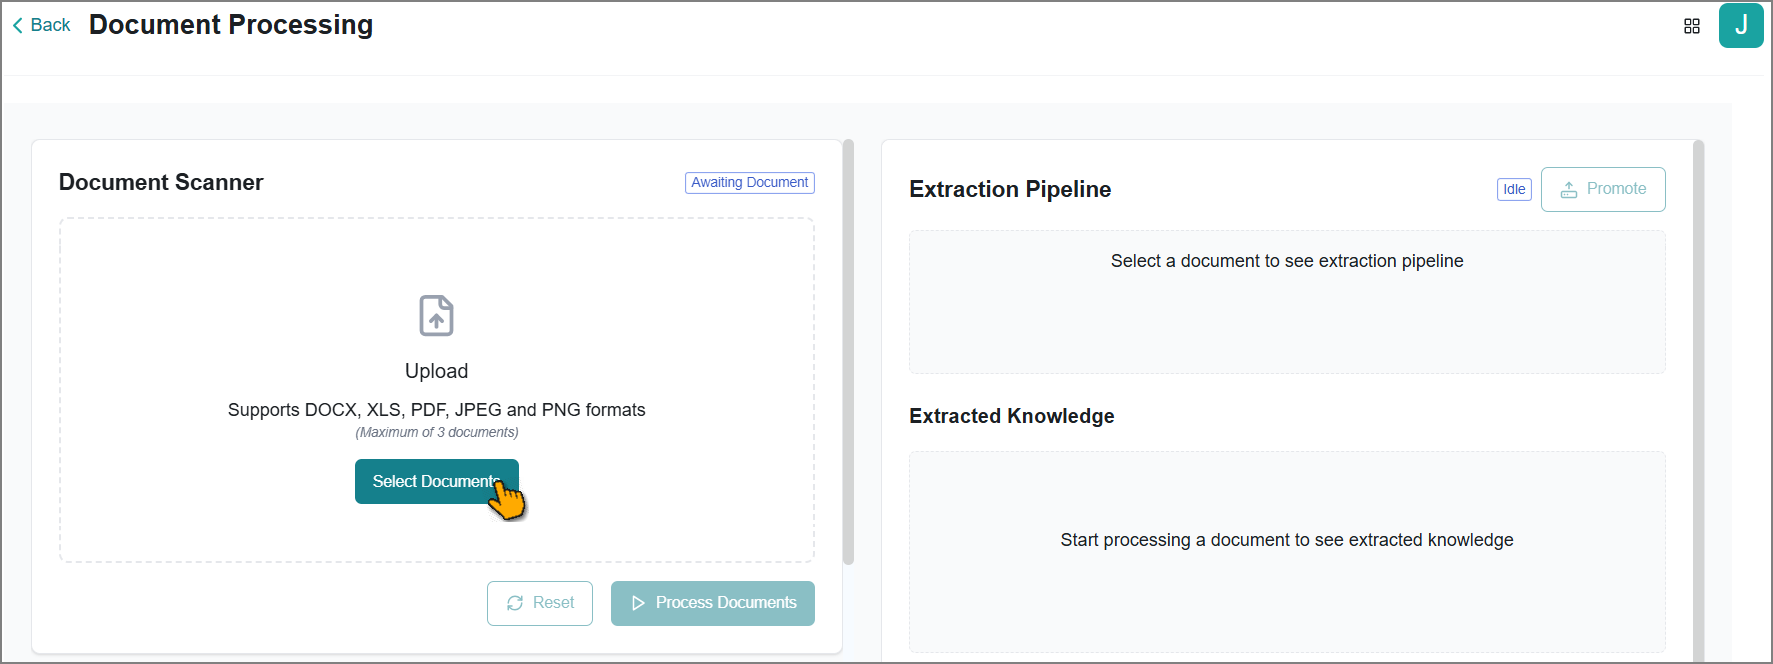
The Document Processing page opens.
Tip
The details of the data extraction process are displayed in the bottom-left corner of the page.
Choose Select Documents, then select the files from your local system.
Note
Upload files in DOCX, XLS, PDF, JPEG, and PNG formats.
Ensure each file is 150 MB or smaller.
Upload no more than 3 files at once.
Once the files are processed, the following occurs:
The uploaded files are available for preview. If multiple files are uploaded, you can preview them individually by selecting the desired file from the Preview File dropdown list.
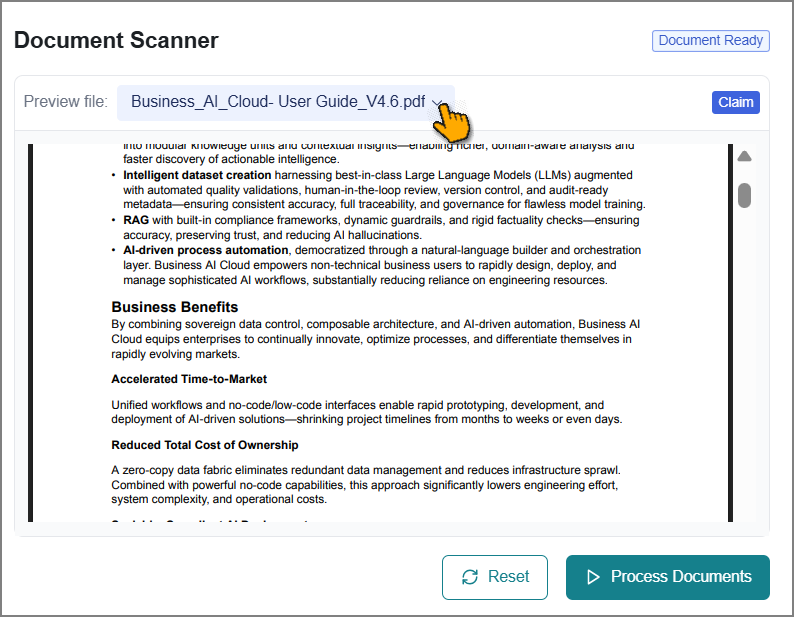
The next-action buttons are enabled:
Process Documents - Execute the data extraction.
Reset - Delete the uploaded files and start over.
The default data extraction pipeline settings are automatically applied.
Click Process Documents to start data extraction.
By default, the platform processes uploaded files and displays real-time extraction progress on the right side.
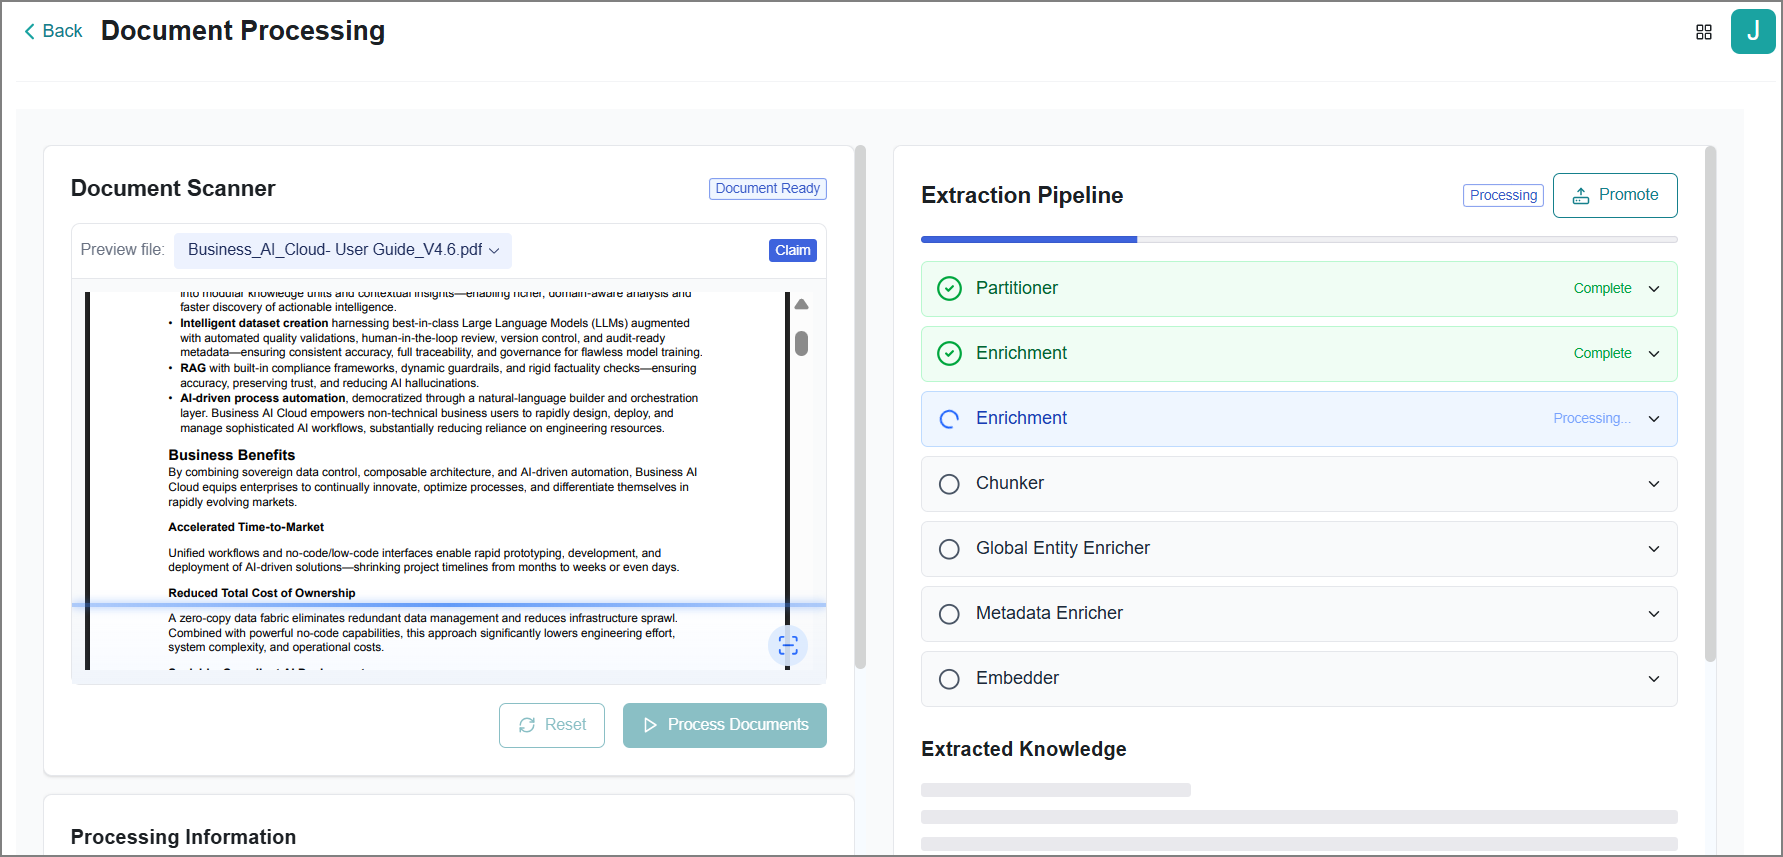
Note
Allow adequate time for the extraction process to complete.
Upon completion of all extraction processes, the extracted content becomes visible.
It can be viewed in JSON format.
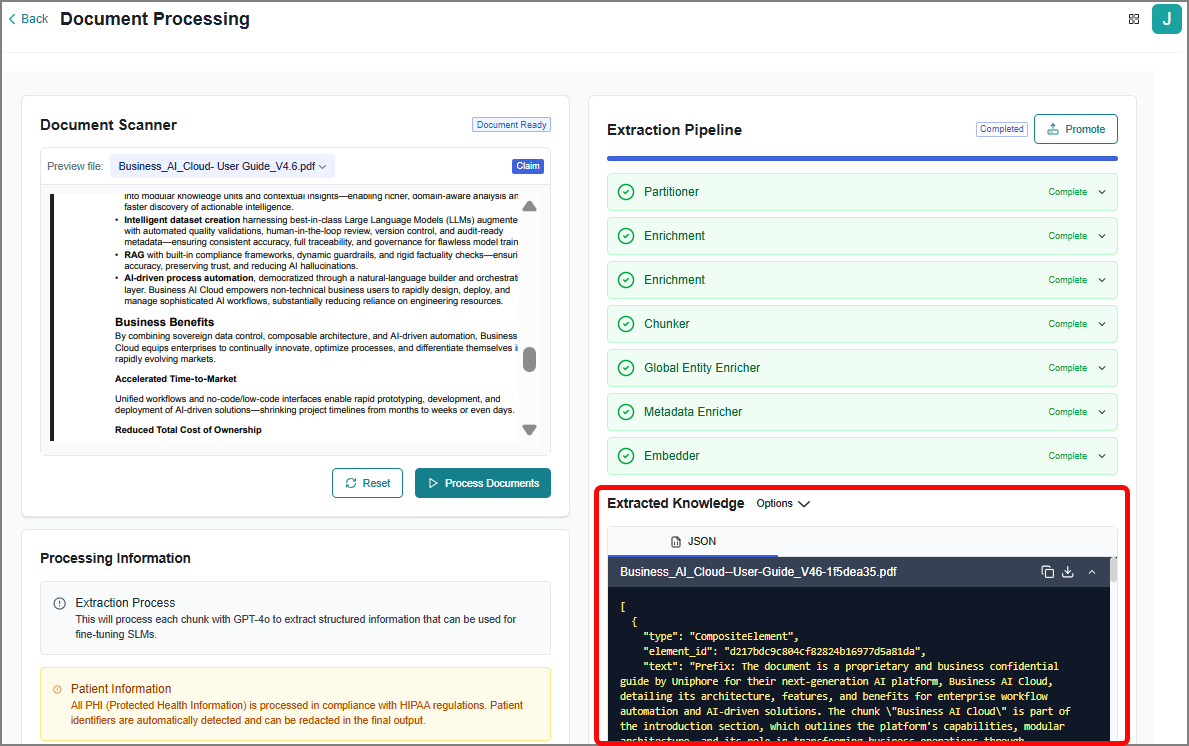
If the results are not as expected, the platform allows you to modify the default pipeline settings accordingly.
To customize the settings, expand each section and make the necessary changes.
Nodes
Fields
Values Description
Chunker
Chunker
Select from the following:
Chunk By Character - Splits the extracted content into uniform chunks based on a predefined character limit.
Chunk By Title - Splits content at each detected title or heading based on file structure.
Chunk By Page - Splits content page by page, preserving the original pagination from the source file.
Chunk By Similarity - Splits content based on semantic similarity between segments, using vector-based similarity thresholds.
Table Merging Chunker - Combines related table fragments that span multiple pages or sections into a single, unified table structure during chunking.
Contextual Enrichment - Adds contextual information to each chunk to improve retrieval accuracy.
Overlap
Enter the number of characters that should overlap between consecutive chunks during content splitting.
Checkbox: Overlap All
Enable this option to apply overlap to all chunks, including those formed by combining complete structural elements.
Caution
This may break meaningful content boundaries and add redundant or irrelevant text, which can affect retrieval accuracy.
Max Characters
Enter the maximum number of characters allowed per chunk during the content splitting process.
New After N Characters
Enter the number of characters after which a new chunk should be created, regardless of natural content boundaries.
Checkbox: Multipage Sections
Enable this option to detect and merge sections that span across multiple pages during document processing.
Applicable for the Chunk By Title strategy only.
Similarity Threshold
Enter the minimum similarity score required to group sentences or segments together.
Applicable for the Chunk By Similarity strategy only.
Checkbox: Include Original Elements
Enable this option to include non-textual or structural elements—such as images, tables, and headers.
Combine Text Under N Characters
Enter the minimum number of characters for a chunk. Chunks smaller than this will be merged with the next one.
Applicable for the Chunk By Title strategy only.
Contextual Chunking Strategy
Choose either of the following:
V1 - Enable context-aware chunking to maintain semantic relationships between document sections.
None - Selected by default, disables chunking strategy and processes documents without contextual segmentation.
Confidence Threshold
Choose either of the following:
Low - Merges tables even with a weak match between fragments.
Medium - Merges tables with a moderate match between fragments.
High - Merges tables only with a strong match between fragments.
Applicable for the Table Merging Chunker strategy only.
Table Merging Provider
Available by default.
Applicable for the Table Merging Chunker strategy only.
User Prompt
Available by default.
Applicable for the Contextual Enrichment strategy only.
Contextual Chunking Model
Available by default.
Applicable for the Contextual Enrichment strategy only.
Content Extractor
Helps extract content and parse it to JSON.
Applicable only to the Optimized workflow type.
Data Catalog Writer
This should always be placed after the Data Quality Checker and before the Destination node.
Data Quality Checker
This should always be placed after the Global Entity Enricher and before an Embedder node.
DeepDoc Processor
Applicable only to the Specialized workflow type.
Repair Corrupted PDFs
Enable this option to let the platform read the corrupted PDF and remove only the extra or garbage bytes appended after the final %%EOF marker. It does not change, drop, or rewrite any page or document content.
If a PDF is damaged in a way that cannot be fixed without altering its content, the platform rejects the file rather than repairing it.
API Key
Available by default.
Embedder
API Key
Enter the API key used to authenticate the embedding model.
Base URL
Enter the API endpoint for the embedding model.
Select Embedding Model
Select from the following:
Snowflake/snowflake-arctic-embed-l-v2.0
Enrichment
Input Type
Select from the following:
Image
Table
Text
LM Models
Select an appropriate LLM to power your workflow based on the input type.
Prompt
The platform displays default text descriptions for the entities to be extracted and allows you to update them based on your requirements.
Click the Edit
 icon to update the text description.
Once the updates are complete, click the Check
 icon to confirm the changes.
Click the Refresh
 icon to reset all updated values to their defaults.
Click the New Prompt
 icon to Choose a New Prompt.
Applicable for Text based input only.
Task (Image)
Select from the following:
Image Description
Task (Table)
Select from the following:
Table Description
Table to HTML
Task (Text)
Named Entity Recognition (NER) is selected by default.
It is a Natural Language Processing (NLP) task that identifies and classifies named entities in text.
Global Entity Enricher
Prompt
The platform displays default instrection for the entities to be extracted and lets you update them to match your requirements.
Click the Edit
icon to update the text description.Once the updates are complete, click the Check
icon to confirm the changes.Click the Refresh
icon to reset all updated values to their defaults.Click the New Prompt
icon to Choose a New Prompt.
Applicable for Text based input only.
LLM Model
Select the LLM model from the list.
Entity Labels
View the entities promoted during Data Preparation of your source. Add or remove entities as needed to customize extraction.
Manually enter the names of the entity labels that should be used to recognize and extract entities from the content.
Click X to remove the entity label.
Parallel Execution Limit
Sets the number of extraction requests that run at the same time. The default value is 3.
Increase the value to process content faster.
Decrease the value to avoid errors and system overload.
Metadata Enricher
Settings
Uses the default setting, no manual configuration required.
Checkbox: Enable Touchfile
Enable this to create a touchfile and store it in the destination.
A touchfile is a lightweight, empty file created solely to signal that a process has completed.
Partitioner
Partition Strategy
Select from the following:
Fast - Choose this option if the uploaded file contains only text, with no embedded images or tables.
Hi Res - Choose this option if the uploaded file contains text with embedded images and tables.
VLM - Choose the Vision-Language Model (VLM) if the uploaded file contains scanned pages, handwritten notes, or other complex document types.
Preprocessor
Repair Corrupted PDF
Enable this option to let the platform read the corrupted PDF and remove only the extra or garbage bytes appended after the final %%EOF marker. It does not change, drop, or rewrite any page or document content.
If a PDF is damaged in a way that cannot be fixed without altering its content, the platform rejects the file rather than repairing it.
Preprocessor Optimized
Applicable only to the Optimized workflow type.
Document Schema
Choose the appropriate template from the dropdown to define the document's schema. The dropdown includes built-in templates and any custom schemas promoted from the Schema Explorer page in Data Preparation.
Promoted Schema
Displays the active schema definition. Updates automatically based on the selected Document Schema.
Repair Corrupted PDF
Enable this option to let the platform read the corrupted PDF and remove only the extra or garbage bytes appended after the final %%EOF marker. It does not change, drop, or rewrite any page or document content.
If a PDF is damaged in a way that cannot be fixed without altering its content, the platform rejects the file rather than repairing it.
Include location info
Enable the option to manually capture the page number and page position (bounding box) for each extracted value, along with the value itself.
Table Replacer
Helps replace the normalized text version of the chunk with the original table structure.
Applicable only to the Optimized workflow type.
Important
Mandatory fields are marked with
 .
.For security reasons, specific field values are hidden by default. Click the Show
 icon to view them.
After customizing each setting, click Save to apply the changes.
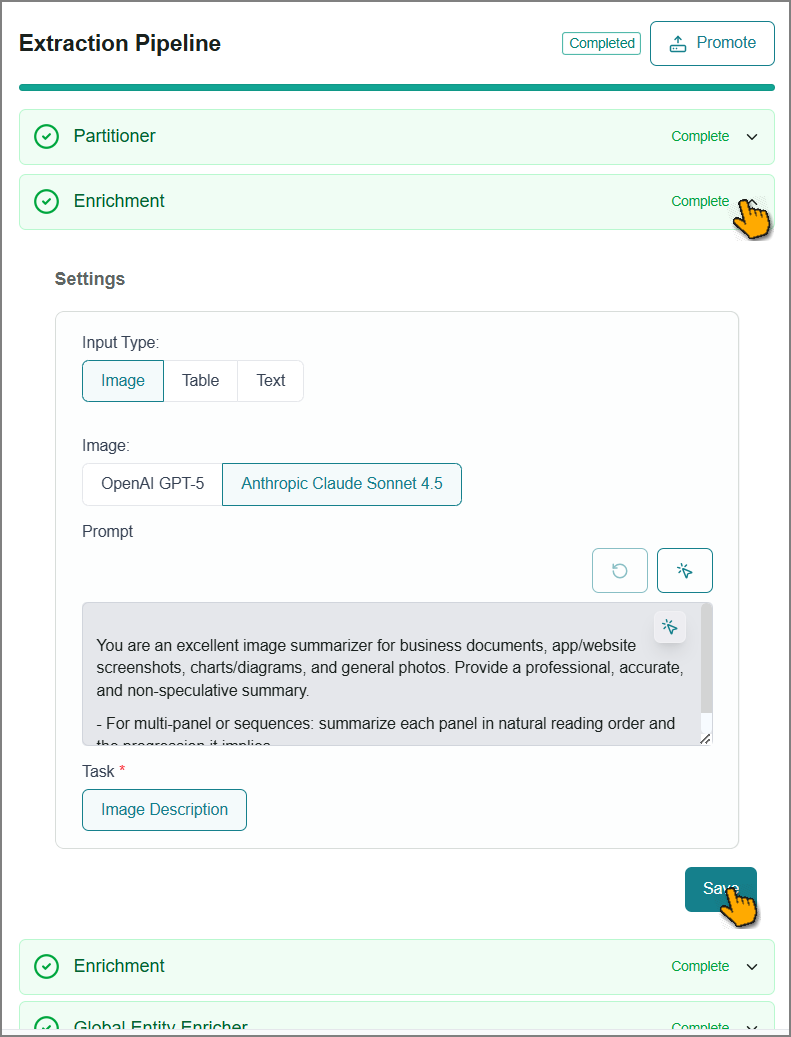
Once the settings are finalized, click Process Documents to begin data extraction.
Select Options next to Extracted Knowledge to copy or download the content.
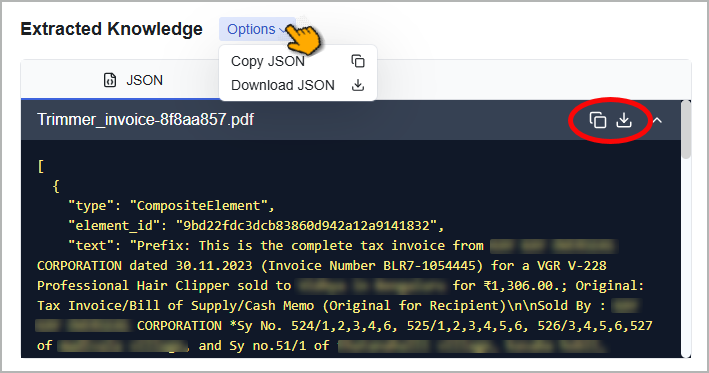
Alternatively:
Click
 to copy the content.
Click
 to download the content.
Once the content is validated, you can either promote the data extraction process as a new workflow or close the page.
To create a new workflow:
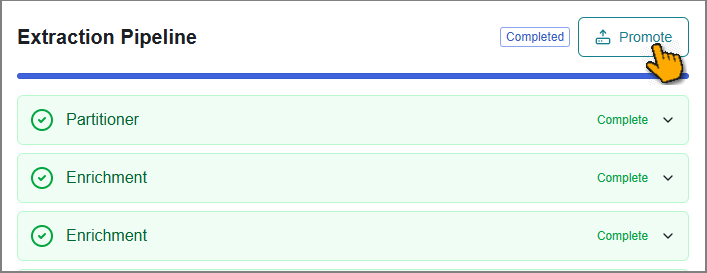
Click Promote .
The Export Configuration window opens.
Enter a name for the workflow.
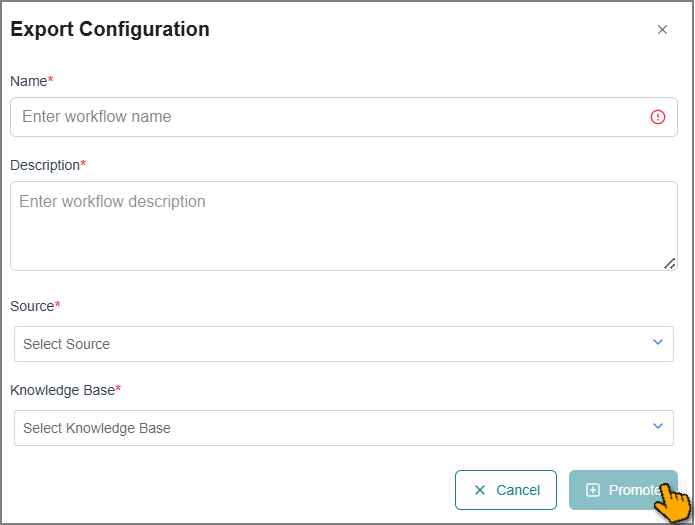
Enter a detailed description for the workflow.
Select the Source location from the predefined dropdown list.
Select the Knowledge Base location from the predefined dropdown list.
Click Promote to complete workflow creation.
Once promoted, the workflow appears on the Data Ingestion page.
To close the page, click Back in the top-left corner.
Selecting a Prompt
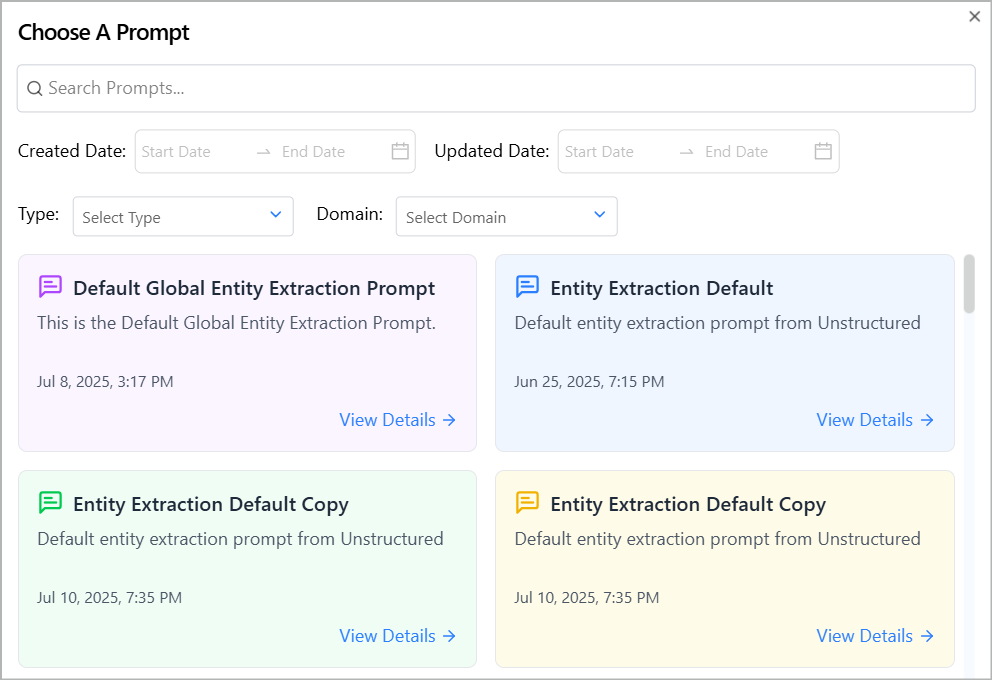
Select a preconfigured prompt appropriate for your data. After the window loads, the platform displays all predefined prompts in a card view for quick and intuitive selection.
 |
Tip
To create additional prompts, go to the Prompt Engineering page.
To find a specific prompt, use the available filters on the page:
Search Prompts: Enter the prompt name in the search box to locate a specific prompt.
Created Date: Select the date on which the prompt was created.
Updated Data: Select the date on which the prompt was modified.
Type: Select the prompt type from the dropdown list.
Domain: Select the prompt domain from the dropdown list.
Relevant prompts are displayed based on the applied filters.
After finding the prompt, click View Details.
The prompt details are displayed for review.
Choose the prompt Version to view different details associated with the same prompt.
After selecting the appropriate prompt details, click Select Prompt to proceed.
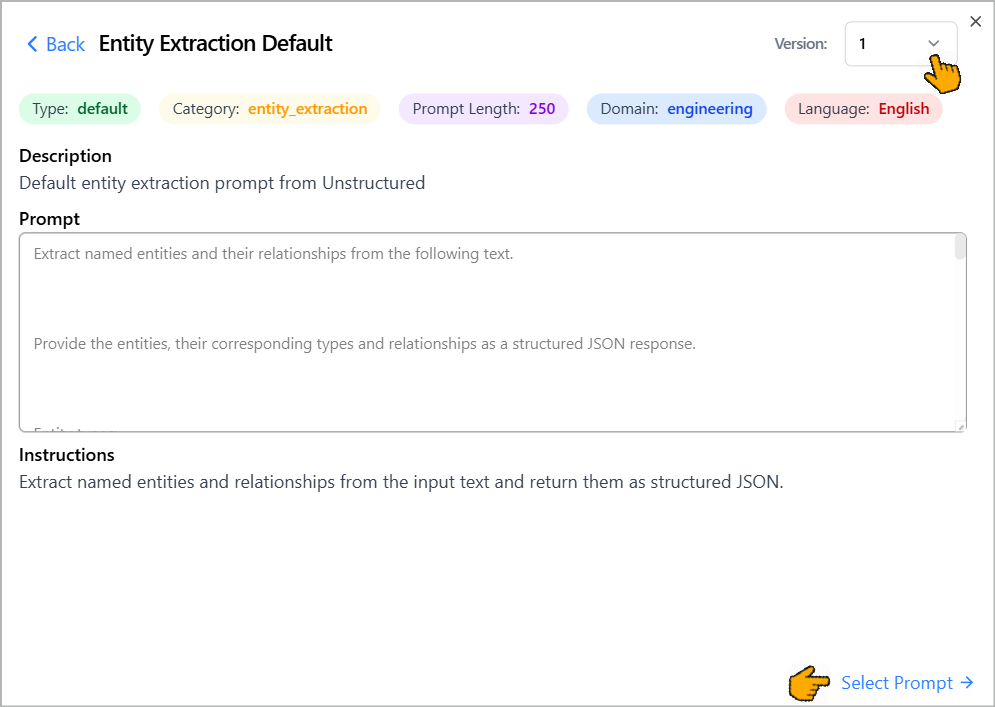
The new prompt is then added to the Enrichment Settings description box.
Click
to confirm the changes.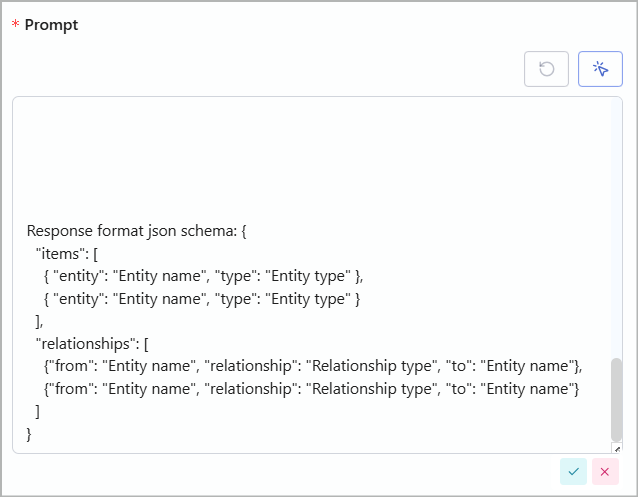
Creating a RAG Pipeline
This feature enables you to define and execute a workflow that extracts structured and unstructured data from the source using RAG-based processing. The data flows from the source location through the pipeline and is stored in vector format within the specified knowledge base.
You can create a pipeline for the following data types:
Conversation
Document
Enterprise App - Under development, coming soon!
Relational DB - Refer to Structured Data Ingestion for more information.
NoSQL - Refer to Structured Data Ingestion for more information.
Important
Unstructured data: When using the Conversation and Document data type, your actual data is stored in a vector database.
Structured data: When using the Relational DB data type, only metadata about your database structure is stored in a vector database. Your actual data stays in its original database.
To create a new workflow:
Select the Conversation or Document data type card on the Data Ingestion page.
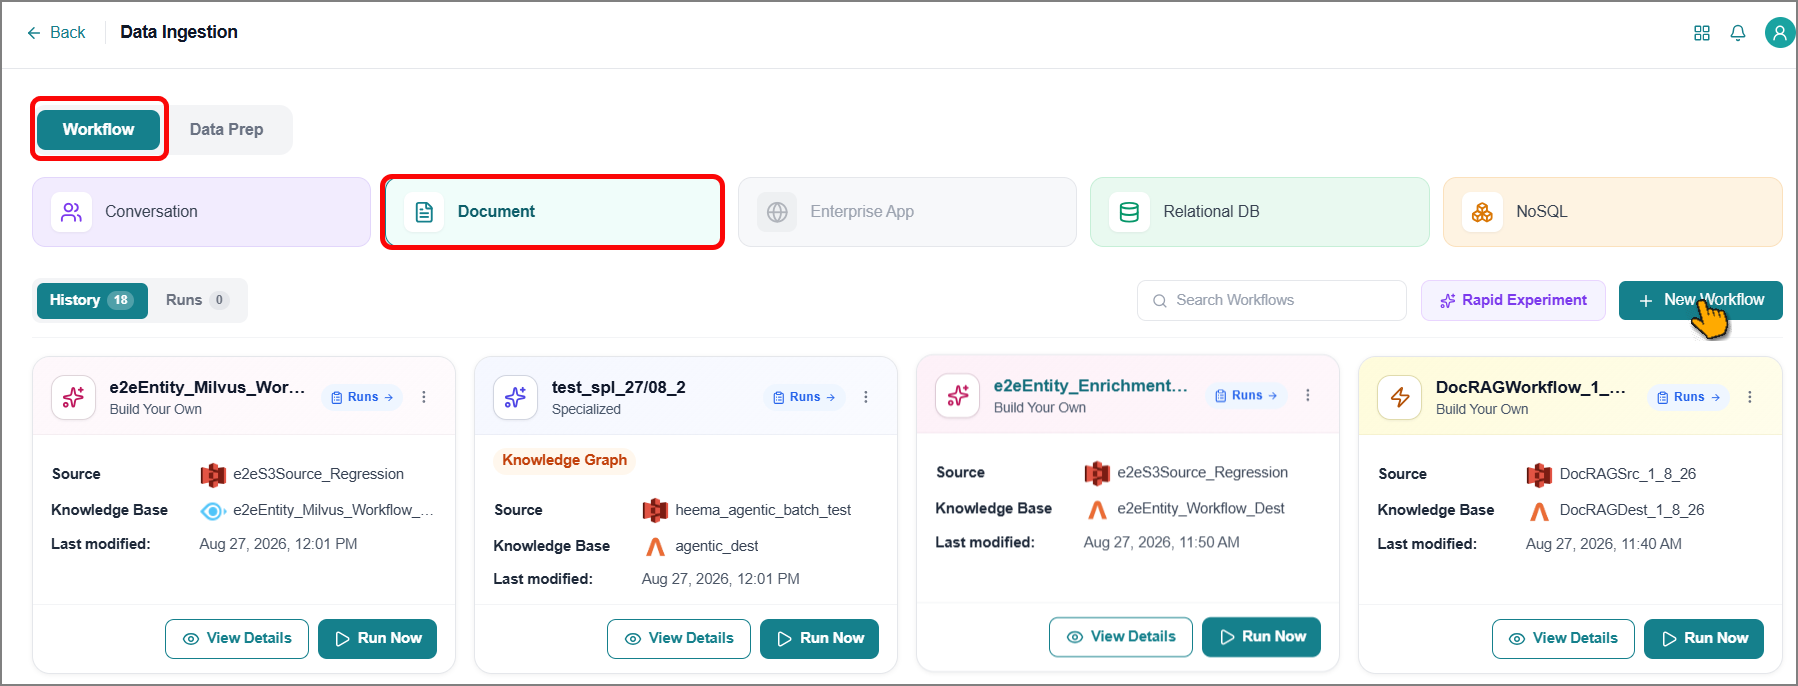
Click New Workflow.
The Add New Workflow window opens.
Enter a name for the workflow.
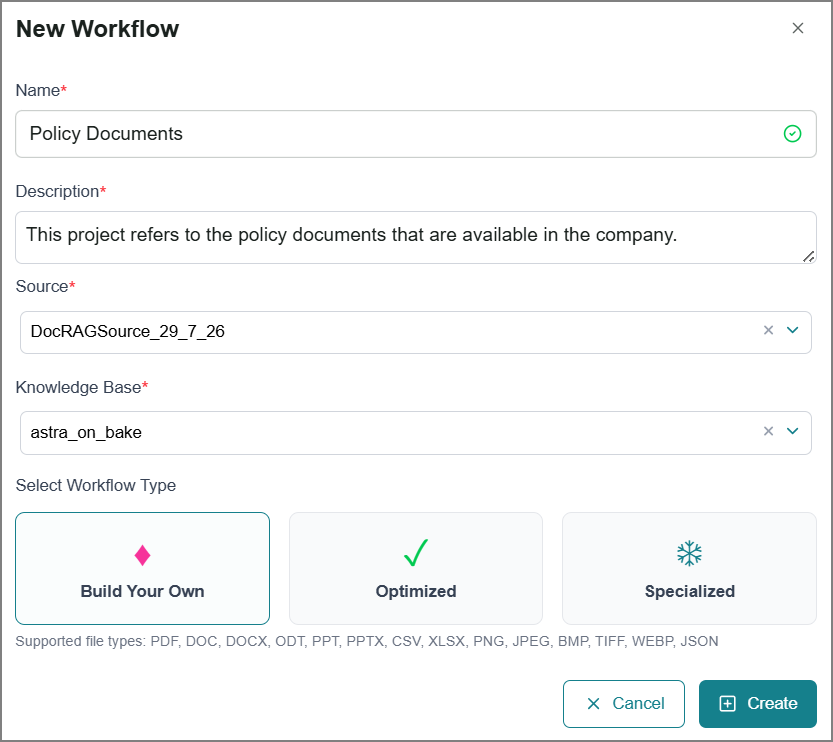
Enter a detailed description for the workflow.
Select the Source connection from the dropdown list.
Select the Knowledge Base connection from the dropdown list.
Choose a workflow type:
Build Your Own - By default, it starts with a ready-to-use, industry-standard workflow. You can add, remove, or rearrange steps to create a pipeline that fits your exact requirements.
Refer to Supporting File Types know supporting file formats.
Specialized - Go beyond standard processing. It builds on the industry-standard workflow by adding additional processing modules tailored to specific document types. These modules extract more precise information from complex layouts.
Refer to Supporting File Types know supporting file formats.
Optimized - Normalize your data automatically. It automatically converts your data into a common, standardized format. This universal schema helps the platform to extract information more accurately, regardless of where your data comes from or its format.
Refer to Supporting File Types - Agentic Search know supporting file formats.
After selecting Optimized, choose a conversion type from the dropdown:
PDF to JSON - Select this to convert source files into structured JSON based on the document schema you select.
Important
The schema must be promoted for the source to use this option. Refer to Schema Explorer for more details.
Enhanced Table Chunking - Select this to handle complex tables from source files.
Enhanced Image Extraction - Select this option to handle complex images from source files.
Note
The PDF to JSON and Enhanced Image Extraction functions serve as a data-preparation workflow, transforming complex source data into a simplified structure and storing the output in the same destination.
Click Create.
The Workflow page opens with the default Workflow Modules preloaded based on the selected workflow type.
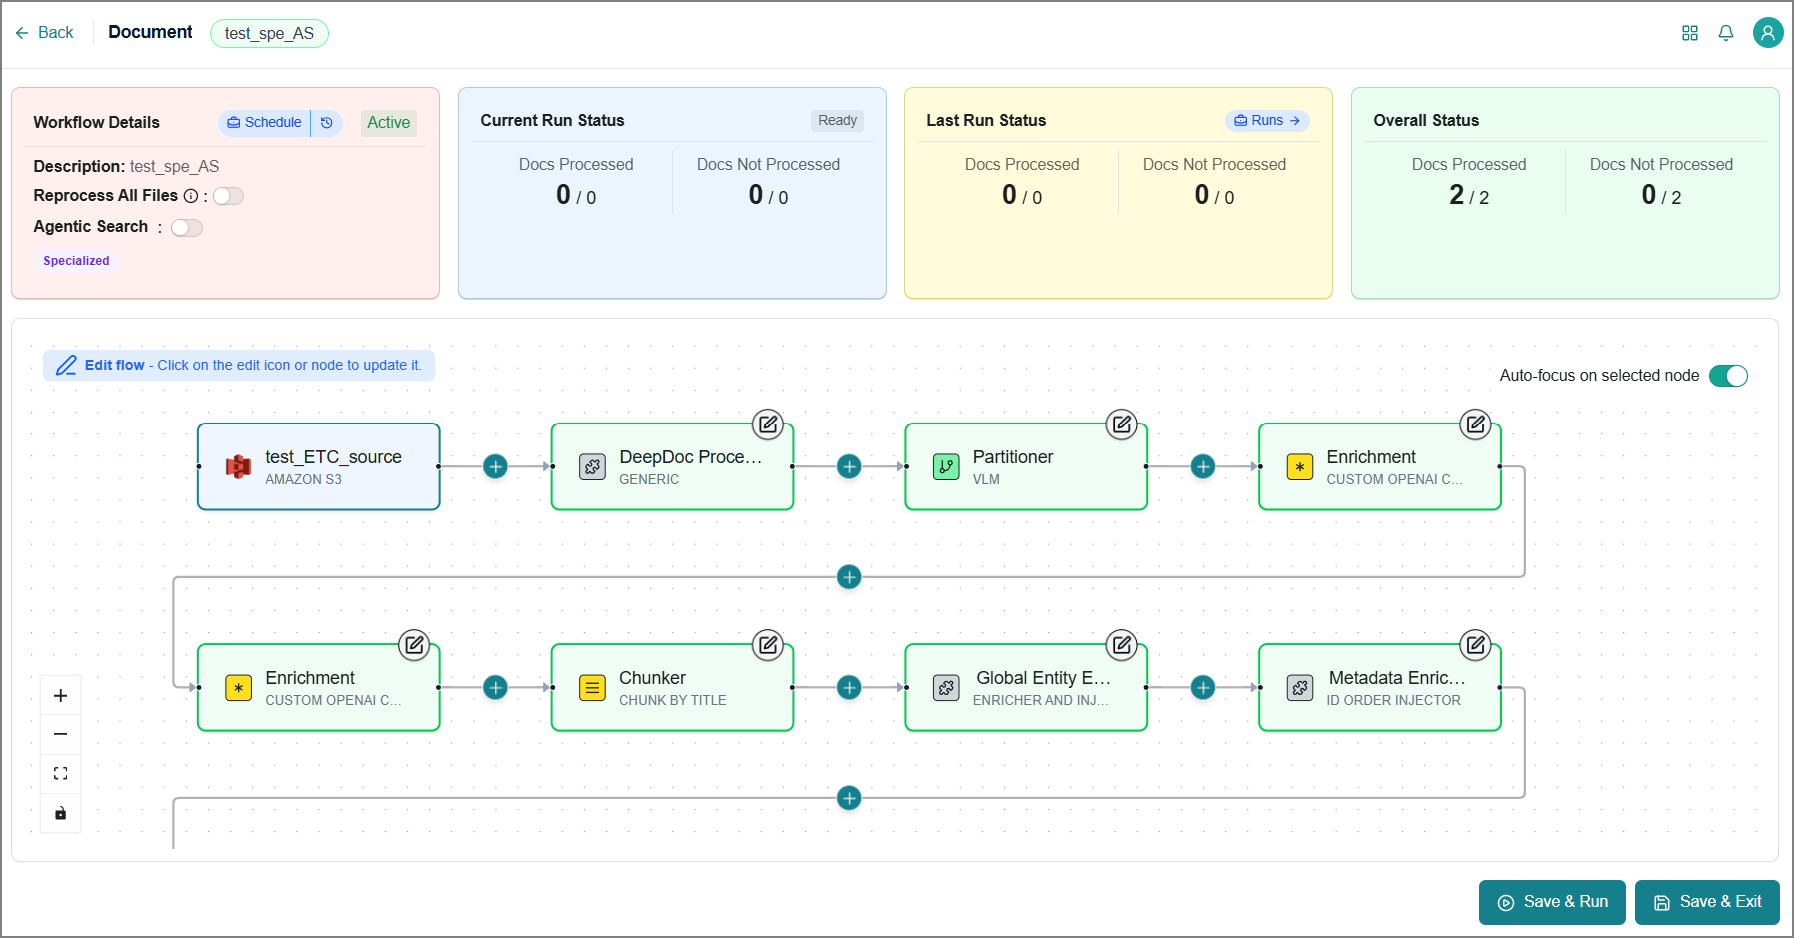
You can review and modify workflow models at any time to align with your data processing needs.
Select the model to view its configuration in the right-side panel.
Update the configuration if needed. Refer to Modifying a Workflow for more information.
Once the workflow is finalized, click Save & Run to save your configuration and initiate execution.
You can monitor the Execution Status in the cards at the top of the page.
Tip
The platform supports various file formats for data ingestion and processing. Refer to Supporting File Types for the complete list of compatible file types.
The pipeline processes your data and creates the data in the selected KB. Once created, the KB supports Semantic Search, allowing AI agents to retrieve relevant data based on the meaning and context of a query.
Click Save & Exit to save the configuration and close the page.
A confirmation message appears for the newly created workflow.
Click Back to close the page without saving the configuration.
A warning pop-up is displayed.
Click Leave without Saving to confirm and exit without saving.
Flowcharts
The data extraction pipeline in Business AI Cloud is represented as a visual flowchart that maps the journey of your data from source to destination. Each component in the flowchart represents a distinct processing step that transforms and enriches your data.
Every pipeline begins at the Source Location, where your raw data originates, and progresses through various processing modules, ending at the destination, the Knowledge Base location, where the processed data becomes searchable and accessible.
A workflow incorporates these key modules based on the workflow type:
Chunker - Creates perfectly-sized text segments optimized for your AI to process and understand. Respects sentence boundaries and strategically overlaps to maintain context between chunks.
Content Extractor - Reads your source documents, extracts the relevant content, and converts it into a structured JSON format. Makes your content ready for the pipeline to process and store accurately downstream.
Applicable only to the Optimized workflow type.
Data Catalog Writer - Automatically records entities and metadata extracted from your content into the Data Catalog. Keeps your catalog current without any manual setup, so agents and queries always reference accurate, up-to-date data.
Data Quality Checker - Inspects your content for issues such as missing information, errors, or duplicates before adding it to your knowledge base. Protects the reliability and accuracy of your AI's responses.
DeepDoc Processor - Integrates with an external service to process documents containing complex handwritten content, converting them into structured Markdown (MD) files.
Applicable only to the Specialized workflow type.
Embedder - Translates your text into a mathematical format that AI can understand conceptually, not just word-for-word. Allows your AI to find relevant answers based on meaning, even when different words are used.
Enrichment - Adds valuable context and background information to your content that wasn't in the original files. Helps your AI provide more comprehensive answers by connecting related concepts across your knowledge base.
Global Entity Enricher - Automatically identifies and tags key information throughout your documents, including names, companies, products, and locations. The enricher can either detect these entities automatically or use promoted entity labels from your Data Preparation process as a baseline. It also recognizes when the same entity appears across multiple documents, creating valuable connections throughout your content.
Metadata Enricher - Acts like a librarian by adding organizational tags such as document type, date, author, and topic categories. Makes it faster for your AI to find the right information when users ask questions.
Partitioner - Intelligently breaks down large documents into manageable sections by recognizing natural divisions like chapters and topics. Ensures related information stays together for more accurate AI understanding.
Plugins - Allows you to add custom processing steps tailored to your organization's unique needs.
Preprocessor - Handles sources that contain JSON files. Since the Partitioner does not natively accept JSON, the Peprocessor converts the files into a compatible format before passing them to the Partitioner.
Preprocessor Optimized - Applies the appropriate preprocessing method to your documents based on the document schema you select. Optimizes file processing and automatically skips this step for document types that do not require it.
Applicable only to the Optimized workflow type.
Table Replacer - Automatically identifies chunks that contain table data and replaces the normalized text version of the chunk with the original table structure.
Applicable only to the Optimized workflow type.
Note
For corrupted PDF sources, specific nodes verify file integrity before submission. Some PDFs contain extra bytes after the file's end marker, which causes the standard parser to return no content and produces an unclear error. When you enable Repair Corrupted PDFs, the node automatically fixes the PDFs and rechecks the page count to confirm that nothing was altered. Undamaged files pass through unchanged.
Viewing a Workflow Details
On the Workflow page, you can view workflow information.
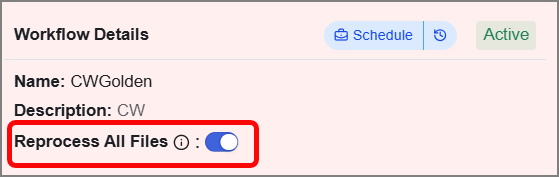
Reprocess All Files - Enable this option to apply your workflow configuration to all source files in future runs. Otherwise, only new or changed files get processed.
Important
This setting remains active once enabled. Only turn it on when you specifically need to reprocess the full dataset. If left enabled, your workflow will reprocess all data from the source every time it runs.
Agentic Search - Enable this option to automatically generate an agent that constructs a knowledge graph and links it to the corresponding KB, enhancing discovery and contextual understanding.
Important
If you enable this option, only a limited number of files are processed for the Knowledge Graph in the workflow. Refer to Supporting File Types - Agentic Search know supporting file formats.
After enabling this feature, you must execute the workflow to generate and view the results.
Once the workflow is completed:
The Knowledge Graph node becomes visible on the canvas.
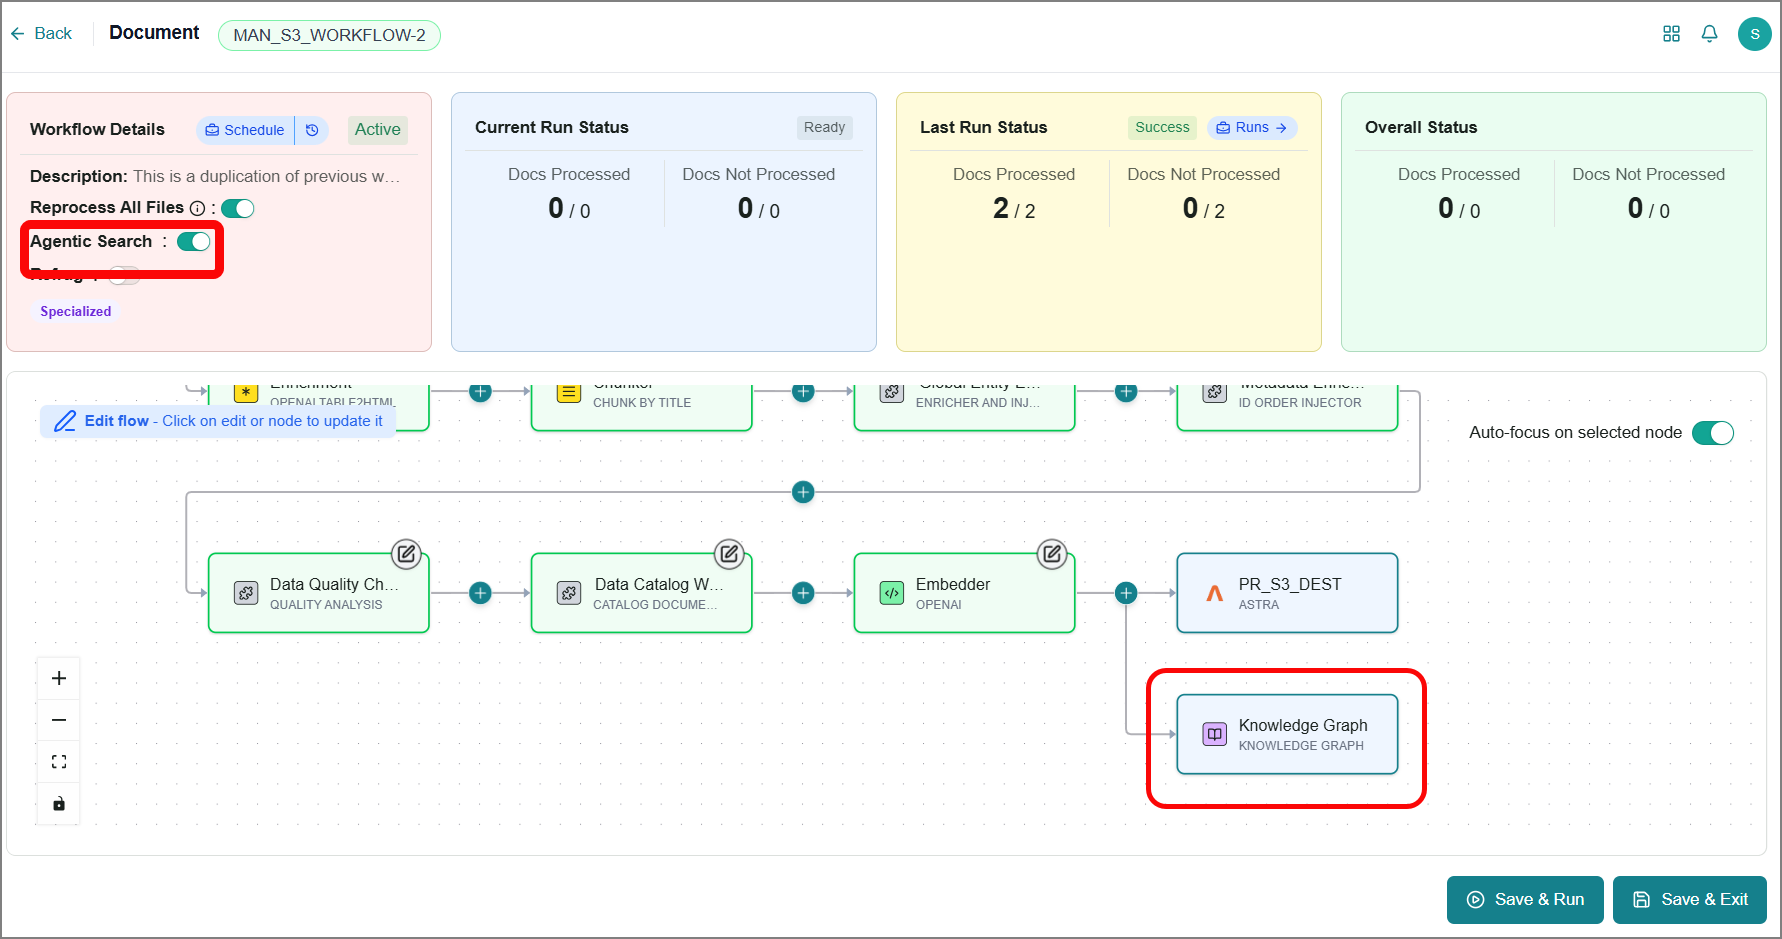
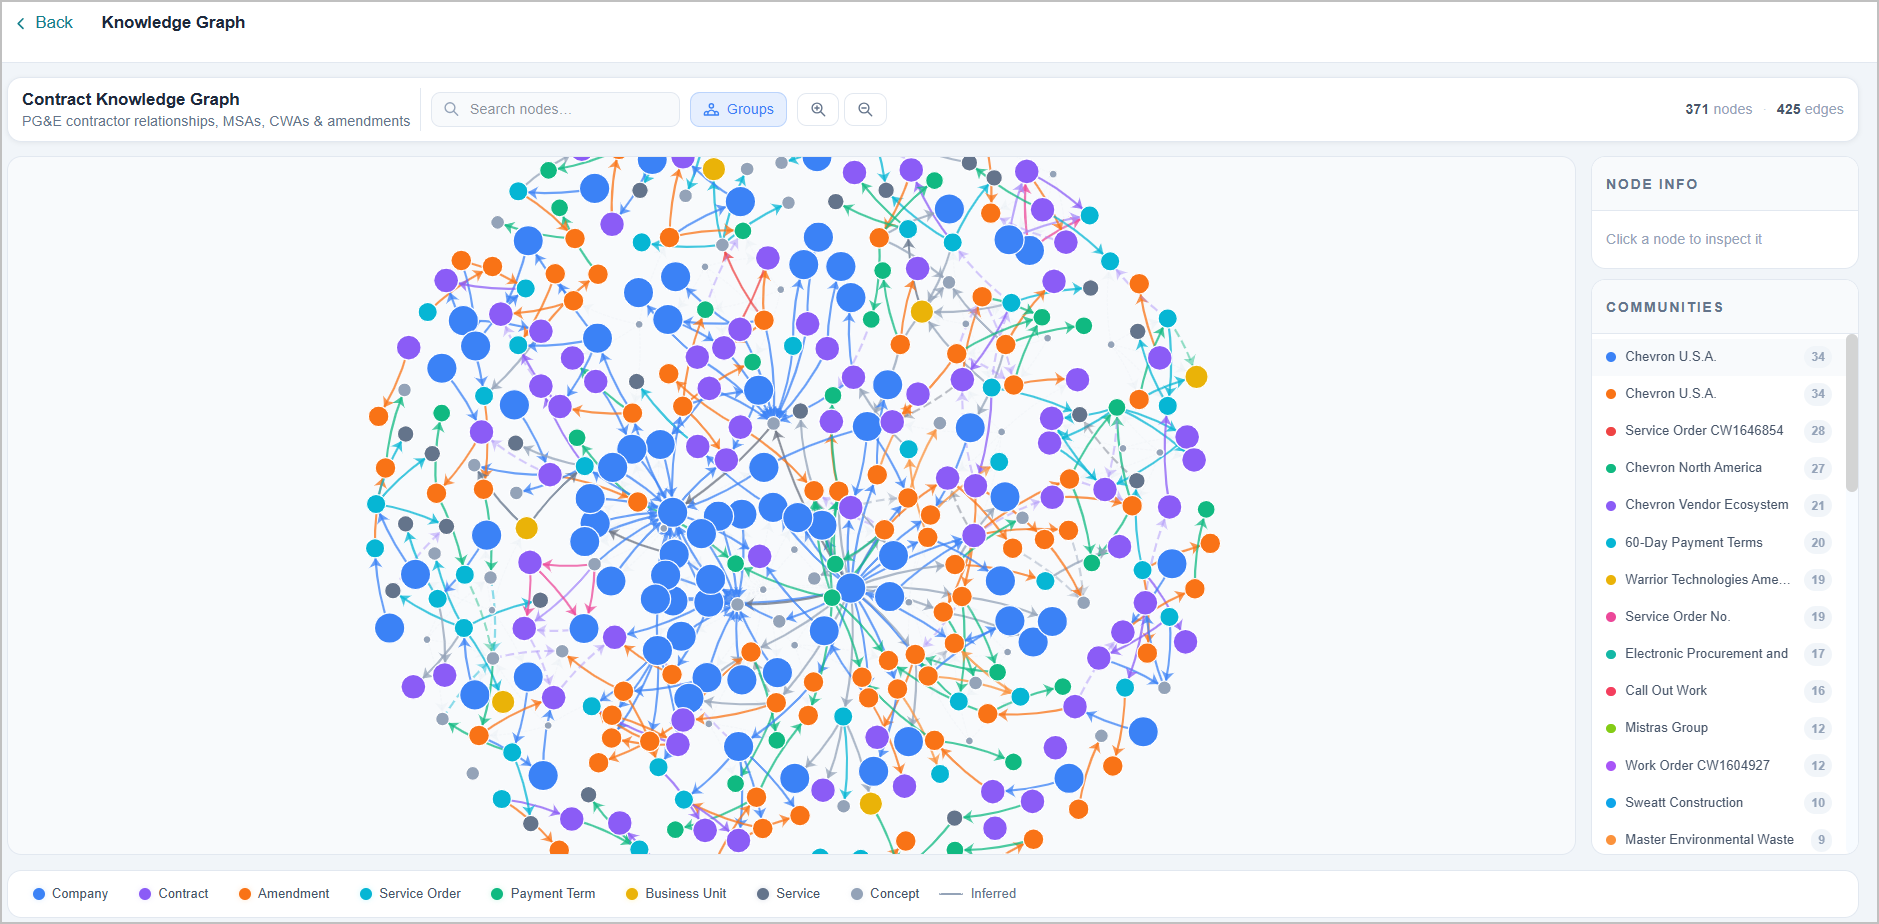
Click on the node to open and explore the knowledge graph.
Notice
Agentic Search using the Knowledge Graph can produce more accurate answers to complex, multi-hop questions, but it takes significantly longer to generate a response than Semantic Search does.
A newly created agent, prefixed with the KB name, will be available on the Agent SDK page.
Docs Processed - Displays the number of documents successfully processed out of the total documents in the pipeline from the selected source location.
Docs Not Processed - Displays the number of documents that could not be processed out of the total number of documents in the pipeline from the selected source location.
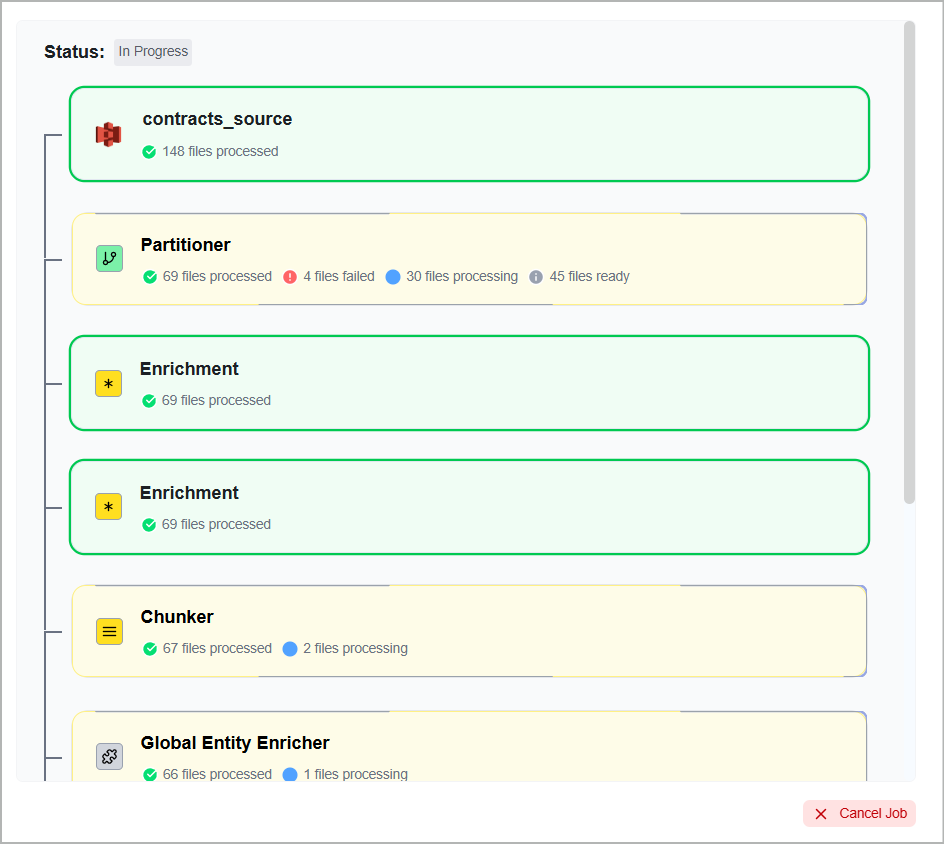
This card helps you to view the real-time progress of the workflow execution.
Click Live to view detailed status information for each component in the panel on the right.
Tip
This option is available only while the workflow is actively executing.
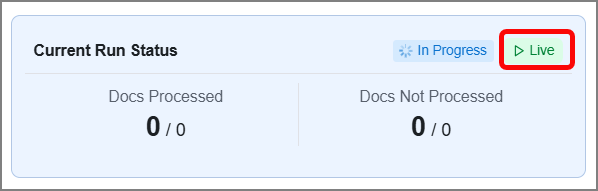
To stop the execution, click Cancel Job.
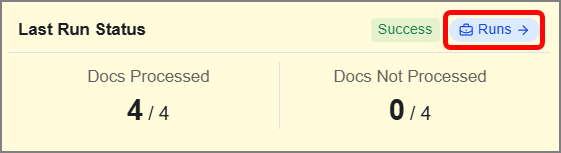
This card helps you to view the status of the most recent workflow execution.
Click Runs to view information about all workflow executions in the panel on the right.
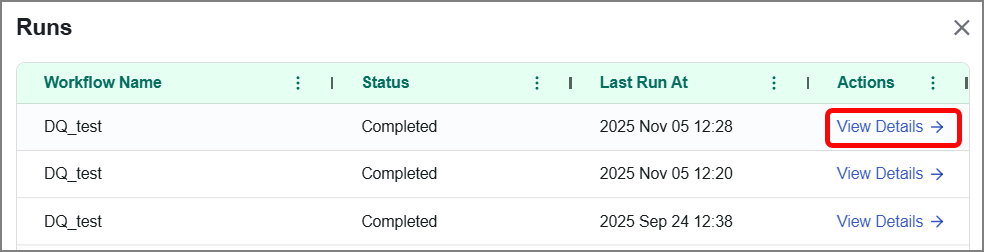
Click View Details to view additional details for a specific execution.
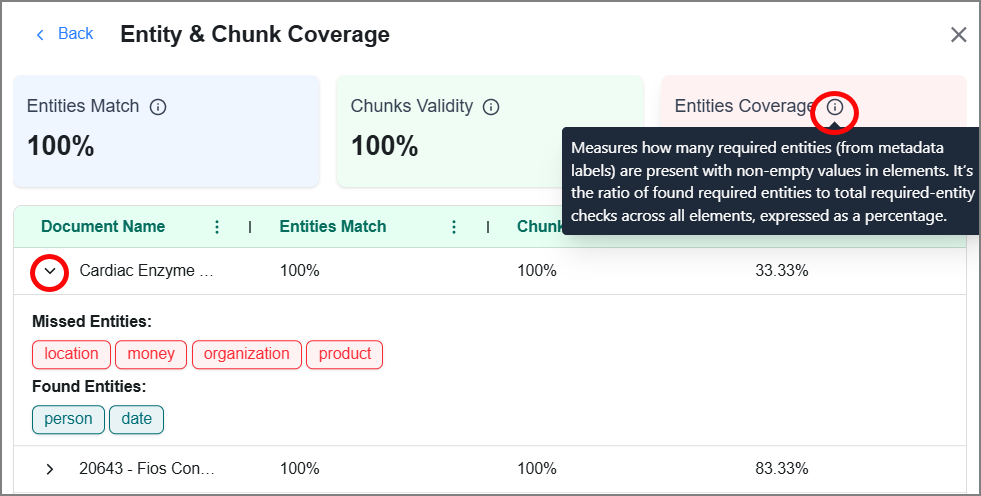
Click View Entity & Chunk Coverage on the Data Quality Checker module to view data quality matrices.
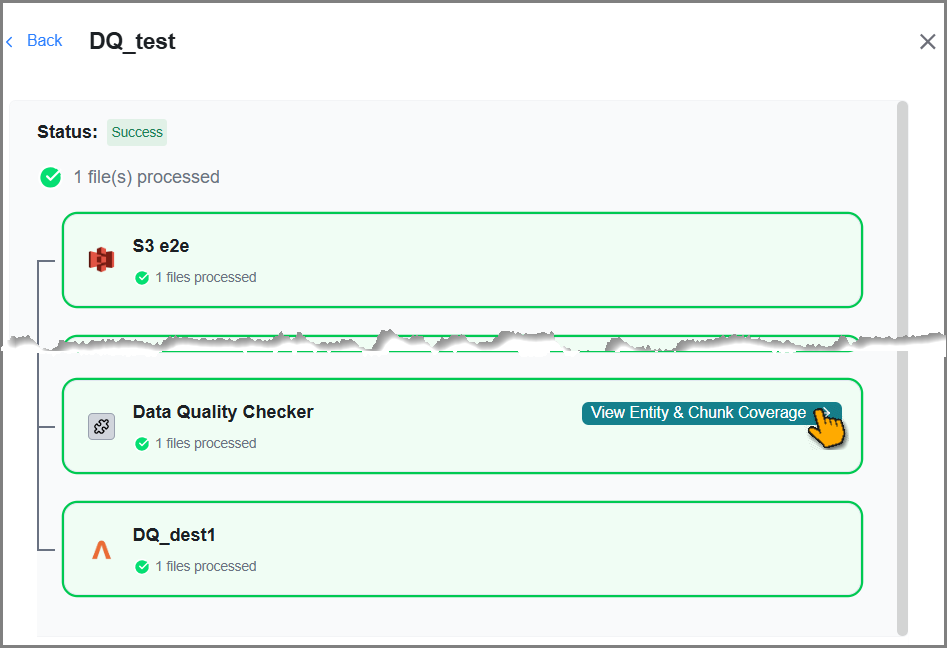
The Entity & Chunk Coverage panel displays data quality information by matching ingested data with the Global Entity Enricher module.
Click
 to view information about insight measurement methodology.
Click > to expand the document and reveal the complete entity breakdown.
Modifying a Workflow
While creating a workflow, you may use the platform’s default configuration or customize it to suit your specific needs.
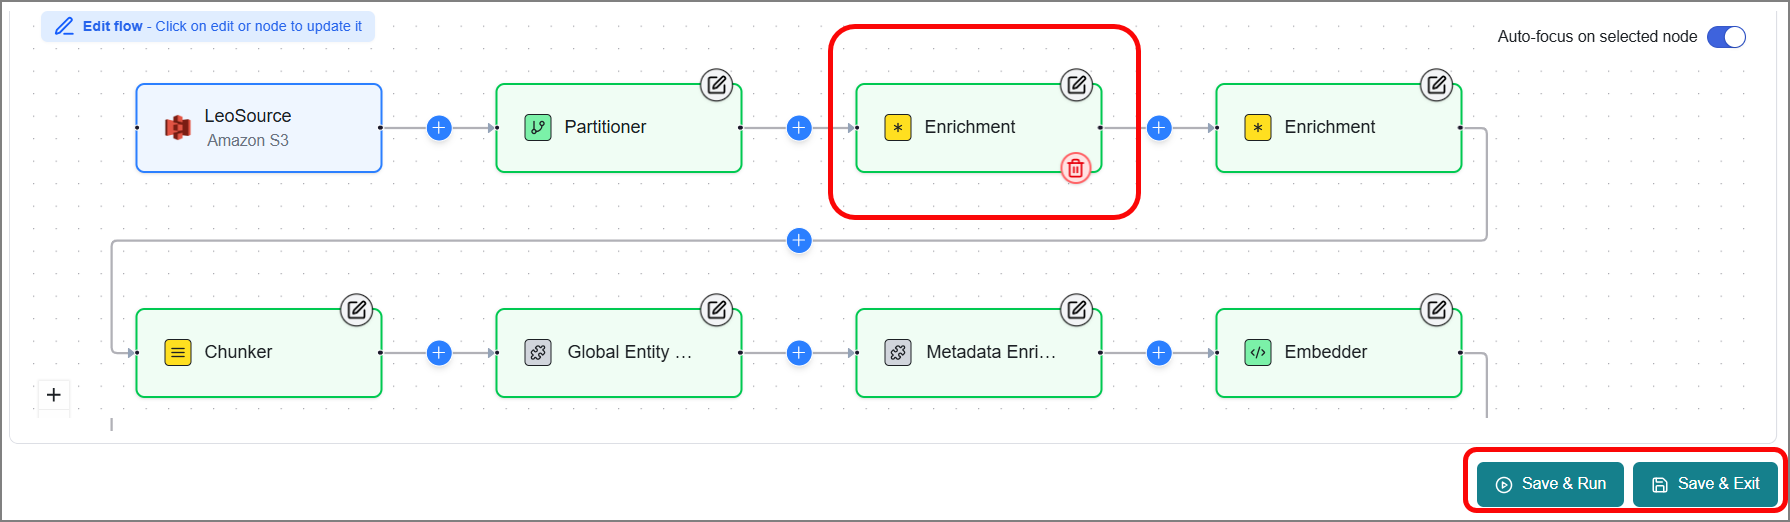
You can rearrange modules as needed to update the flowchart, making the pipeline unique to each RAG workflow.
To add a new component:
Click
 in the desired position on the flowchart.
The following modules appear.
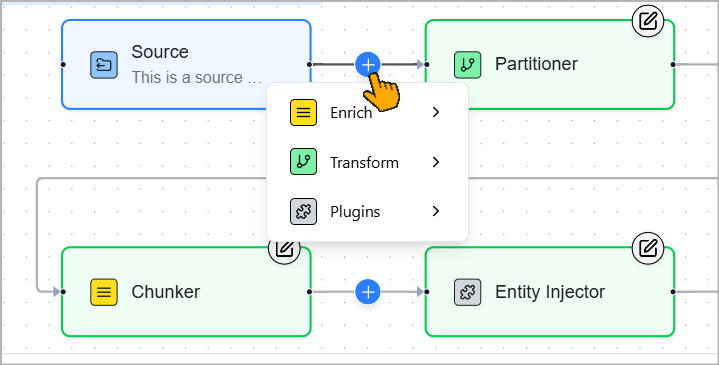
Enrich > Chunker
Enrich > Enrichment
Transform > Partitioner
Transform > Embedder
Plugins > Other nodes
Select the required module.
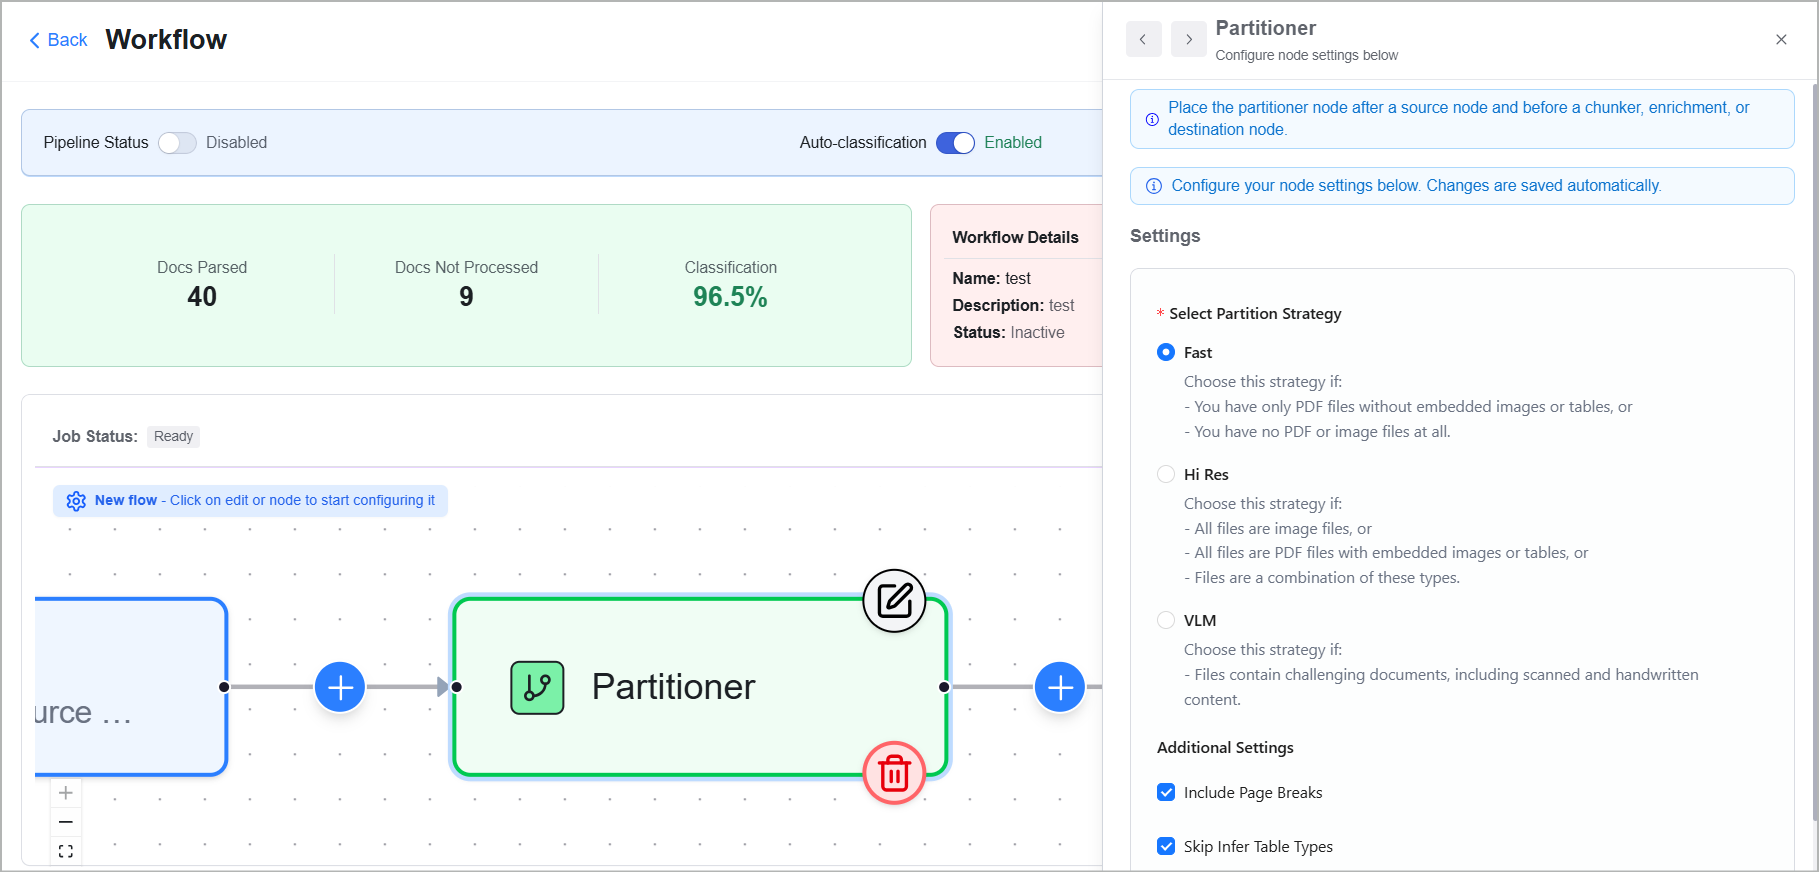
The new module is added at the selected position, and a side panel opens displaying the default Configuration along with relevant notes and warnings.
If the module contains an error, it is visually highlighted using a distinct color for easy identification.
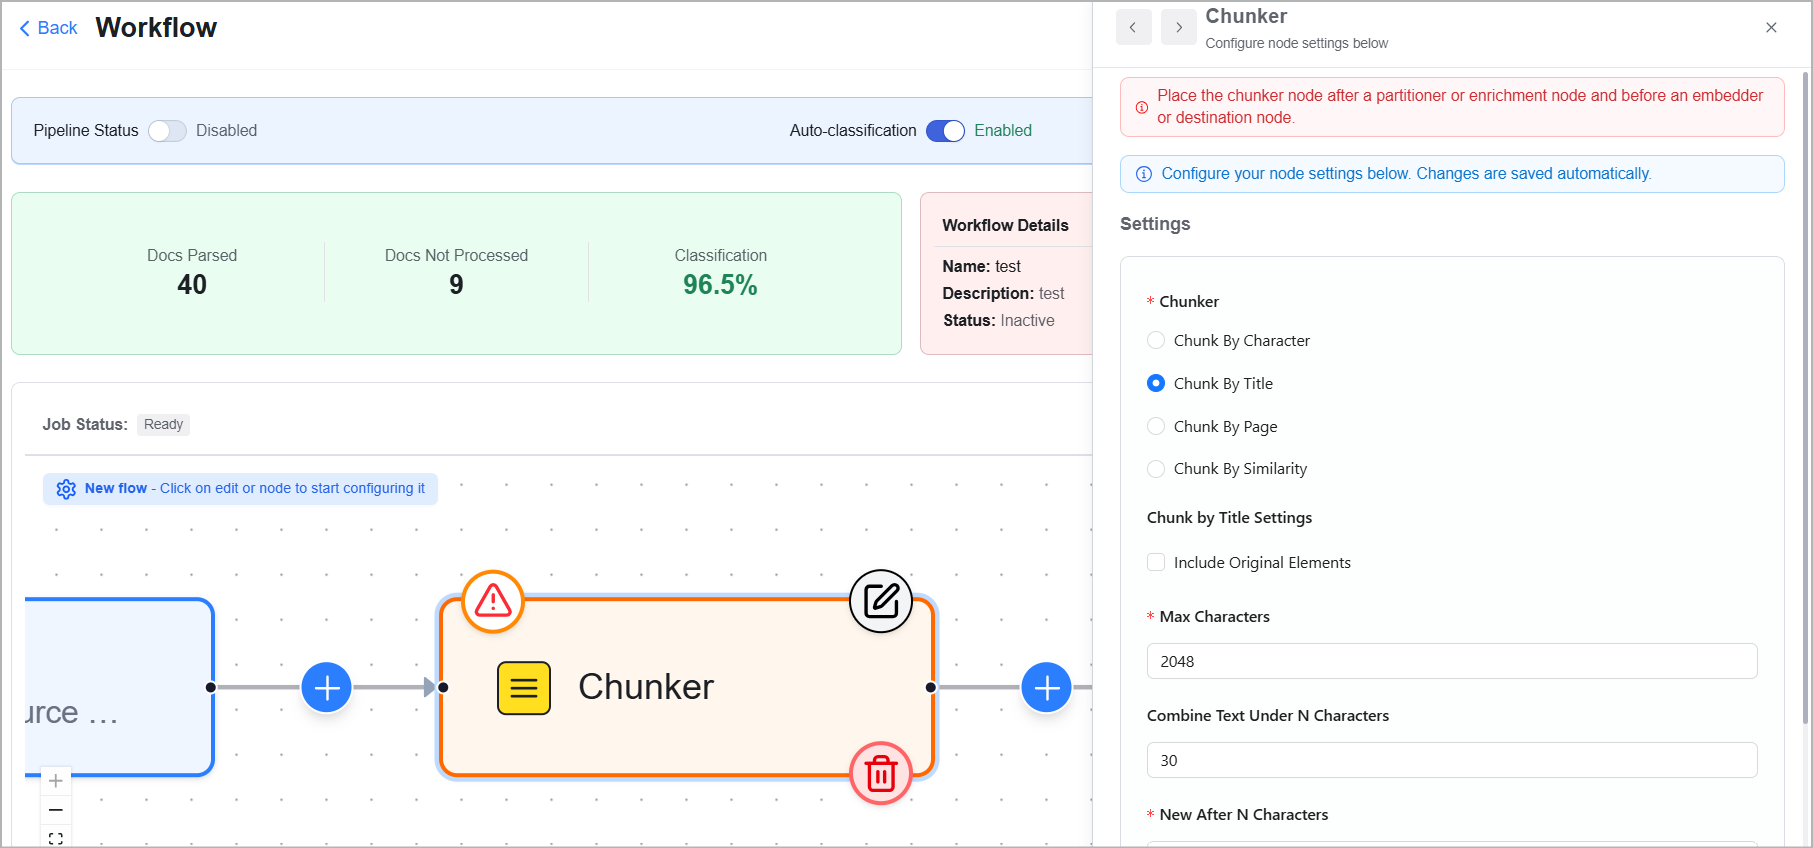
Warning
Ensure that all error warnings on the modules are resolved before running the workflow.
Nodes
Fields
Values Description
Chunker
Chunker
Select from the following:
Chunk By Character - Splits the extracted content into uniform chunks based on a predefined character limit.
Chunk By Title - Splits content at each detected title or heading based on file structure.
Chunk By Page - Splits content page by page, preserving the original pagination from the source file.
Chunk By Similarity - Splits content based on semantic similarity between segments, using vector-based similarity thresholds.
Table Merging Chunker - Combines related table fragments that span multiple pages or sections into a single, unified table structure during chunking.
Contextual Enrichment - Adds contextual information to each chunk to improve retrieval accuracy.
Overlap
Enter the number of characters that should overlap between consecutive chunks during content splitting.
Checkbox: Overlap All
Enable this option to apply overlap to all chunks, including those formed by combining complete structural elements.
Caution
This may break meaningful content boundaries and add redundant or irrelevant text, which can affect retrieval accuracy.
Max Characters
Enter the maximum number of characters allowed per chunk during the content splitting process.
New After N Characters
Enter the number of characters after which a new chunk should be created, regardless of natural content boundaries.
Checkbox: Multipage Sections
Enable this option to detect and merge sections that span across multiple pages during document processing.
Applicable for the Chunk By Title strategy only.
Similarity Threshold
Enter the minimum similarity score required to group sentences or segments together.
Applicable for the Chunk By Similarity strategy only.
Checkbox: Include Original Elements
Enable this option to include non-textual or structural elements—such as images, tables, and headers.
Combine Text Under N Characters
Enter the minimum number of characters for a chunk. Chunks smaller than this will be merged with the next one.
Applicable for the Chunk By Title strategy only.
Contextual Chunking Strategy
Choose either of the following:
V1 - Enable context-aware chunking to maintain semantic relationships between document sections.
None - Selected by default, disables chunking strategy and processes documents without contextual segmentation.
Confidence Threshold
Choose either of the following:
Low - Merges tables even with a weak match between fragments.
Medium - Merges tables with a moderate match between fragments.
High - Merges tables only with a strong match between fragments.
Applicable for the Table Merging Chunker strategy only.
Table Merging Provider
Available by default.
Applicable for the Table Merging Chunker strategy only.
User Prompt
Available by default.
Applicable for the Contextual Enrichment strategy only.
Contextual Chunking Model
Available by default.
Applicable for the Contextual Enrichment strategy only.
Content Extractor
Helps extract content and parse it to JSON.
Applicable only to the Optimized workflow type.
Data Catalog Writer
This should always be placed after the Data Quality Checker and before the Destination node.
Data Quality Checker
This should always be placed after the Global Entity Enricher and before an Embedder node.
DeepDoc Processor
Applicable only to the Specialized workflow type.
Repair Corrupted PDFs
Enable this option to let the platform read the corrupted PDF and remove only the extra or garbage bytes appended after the final %%EOF marker. It does not change, drop, or rewrite any page or document content.
If a PDF is damaged in a way that cannot be fixed without altering its content, the platform rejects the file rather than repairing it.
API Key
Available by default.
Embedder
API Key
Enter the API key used to authenticate the embedding model.
Base URL
Enter the API endpoint for the embedding model.
Select Embedding Model
Select from the following:
Snowflake/snowflake-arctic-embed-l-v2.0
Enrichment
Input Type
Select from the following:
Image
Table
Text
LM Models
Select an appropriate LLM to power your workflow based on the input type.
Prompt
The platform displays default text descriptions for the entities to be extracted and allows you to update them based on your requirements.
Click the Edit
icon to update the text description.Once the updates are complete, click the Check
icon to confirm the changes.Click the Refresh
icon to reset all updated values to their defaults.Click the New Prompt
icon to Choose a New Prompt.
Applicable for Text based input only.
Task (Image)
Select from the following:
Image Description
Task (Table)
Select from the following:
Table Description
Table to HTML
Task (Text)
Named Entity Recognition (NER) is selected by default.
It is a Natural Language Processing (NLP) task that identifies and classifies named entities in text.
Global Entity Enricher
Prompt
The platform displays default instrection for the entities to be extracted and lets you update them to match your requirements.
Click the Edit
icon to update the text description.Once the updates are complete, click the Check
icon to confirm the changes.Click the Refresh
icon to reset all updated values to their defaults.Click the New Prompt
icon to Choose a New Prompt.
Applicable for Text based input only.
LLM Model
Select the LLM model from the list.
Entity Labels
View the entities promoted during Data Preparation of your source. Add or remove entities as needed to customize extraction.
Manually enter the names of the entity labels that should be used to recognize and extract entities from the content.
Click X to remove the entity label.
Parallel Execution Limit
Sets the number of extraction requests that run at the same time. The default value is 3.
Increase the value to process content faster.
Decrease the value to avoid errors and system overload.
Metadata Enricher
Settings
Uses the default setting, no manual configuration required.
Checkbox: Enable Touchfile
Enable this to create a touchfile and store it in the destination.
A touchfile is a lightweight, empty file created solely to signal that a process has completed.
Partitioner
Partition Strategy
Select from the following:
Fast - Choose this option if the uploaded file contains only text, with no embedded images or tables.
Hi Res - Choose this option if the uploaded file contains text with embedded images and tables.
VLM - Choose the Vision-Language Model (VLM) if the uploaded file contains scanned pages, handwritten notes, or other complex document types.
Preprocessor
Repair Corrupted PDF
Enable this option to let the platform read the corrupted PDF and remove only the extra or garbage bytes appended after the final %%EOF marker. It does not change, drop, or rewrite any page or document content.
If a PDF is damaged in a way that cannot be fixed without altering its content, the platform rejects the file rather than repairing it.
Preprocessor Optimized
Applicable only to the Optimized workflow type.
Document Schema
Choose the appropriate template from the dropdown to define the document's schema. The dropdown includes built-in templates and any custom schemas promoted from the Schema Explorer page in Data Preparation.
Promoted Schema
Displays the active schema definition. Updates automatically based on the selected Document Schema.
Repair Corrupted PDF
Enable this option to let the platform read the corrupted PDF and remove only the extra or garbage bytes appended after the final %%EOF marker. It does not change, drop, or rewrite any page or document content.
If a PDF is damaged in a way that cannot be fixed without altering its content, the platform rejects the file rather than repairing it.
Include location info
Enable the option to manually capture the page number and page position (bounding box) for each extracted value, along with the value itself.
Table Replacer
Helps replace the normalized text version of the chunk with the original table structure.
Applicable only to the Optimized workflow type.
Important
Mandatory fields are marked with
.For security reasons, specific field values are hidden by default. Click the Show
icon to view them.
Click
 on the module. The side panel opens to view the existing configuration and allows you to update.
Hover over the module and click
 to immediately remove the module from the workflow.
Enable the Reprocess All Files setting to apply a new configuration to your entire dataset. Leave it disabled to process only files that have changed since the last run (delta processing).
Once the workflow is finalized, click Save & Rerun to save your configuration and run the files in the KB.
Click Save & Exit to save the configuration and close the page without executing it.
Rerunning Workflows
You can re-run workflows multiple times using the same configuration to get real-time data from the source. Choose to run them manually or schedule them to run automatically.
Manual Run
Go to the Data Ingestion page.
Find and select the workflow you want to run.
Click Run to manually execute the workflow.
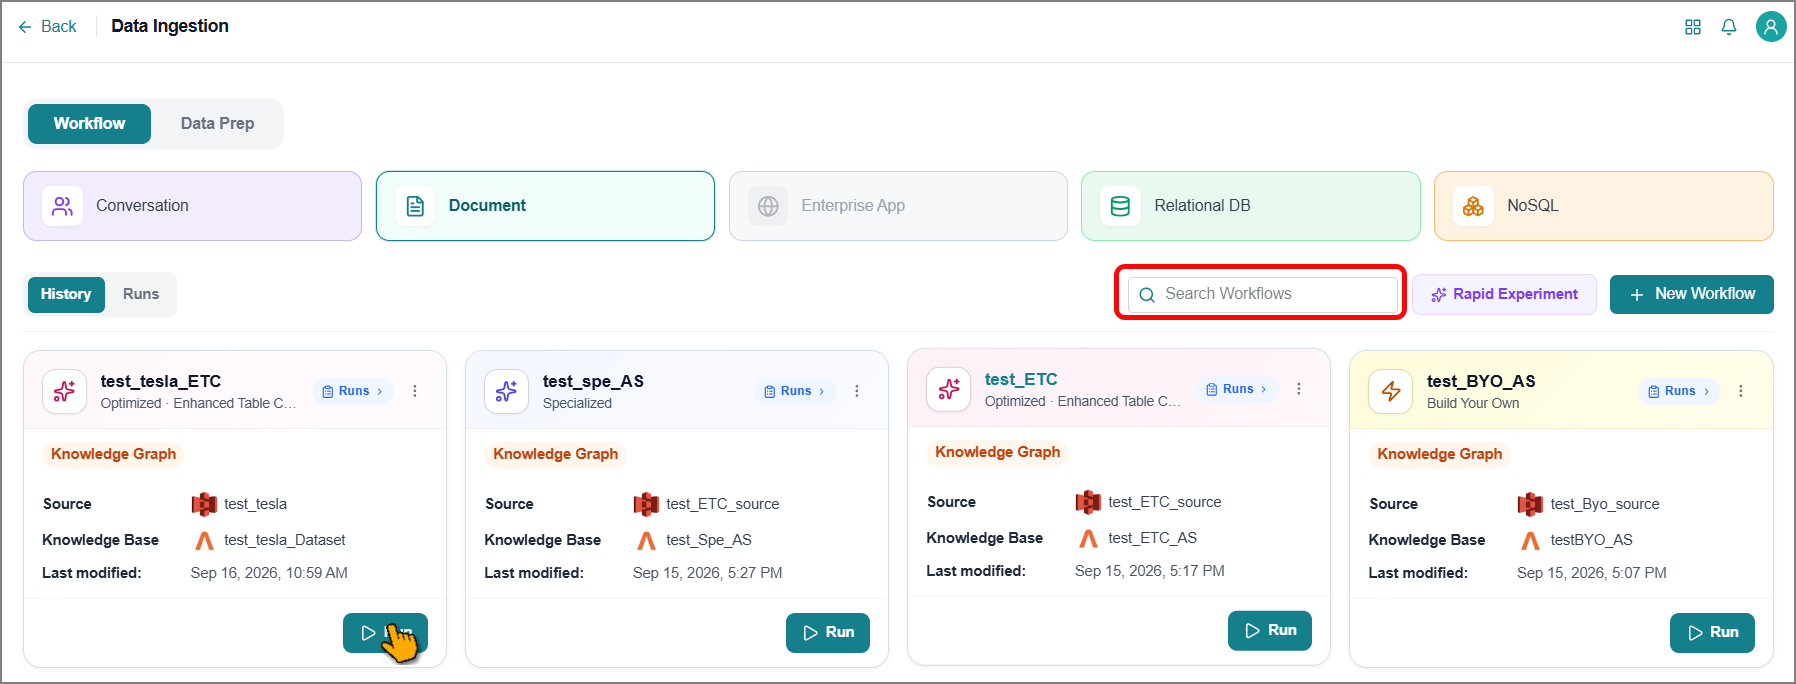
The configured steps are re-executed with real-time status updates.
Schedule Run
Go to the Data Ingestion page.
Find and select the workflow you want to schedule run.
Click on the card to open the workflow configuration page.
Click Schedule.
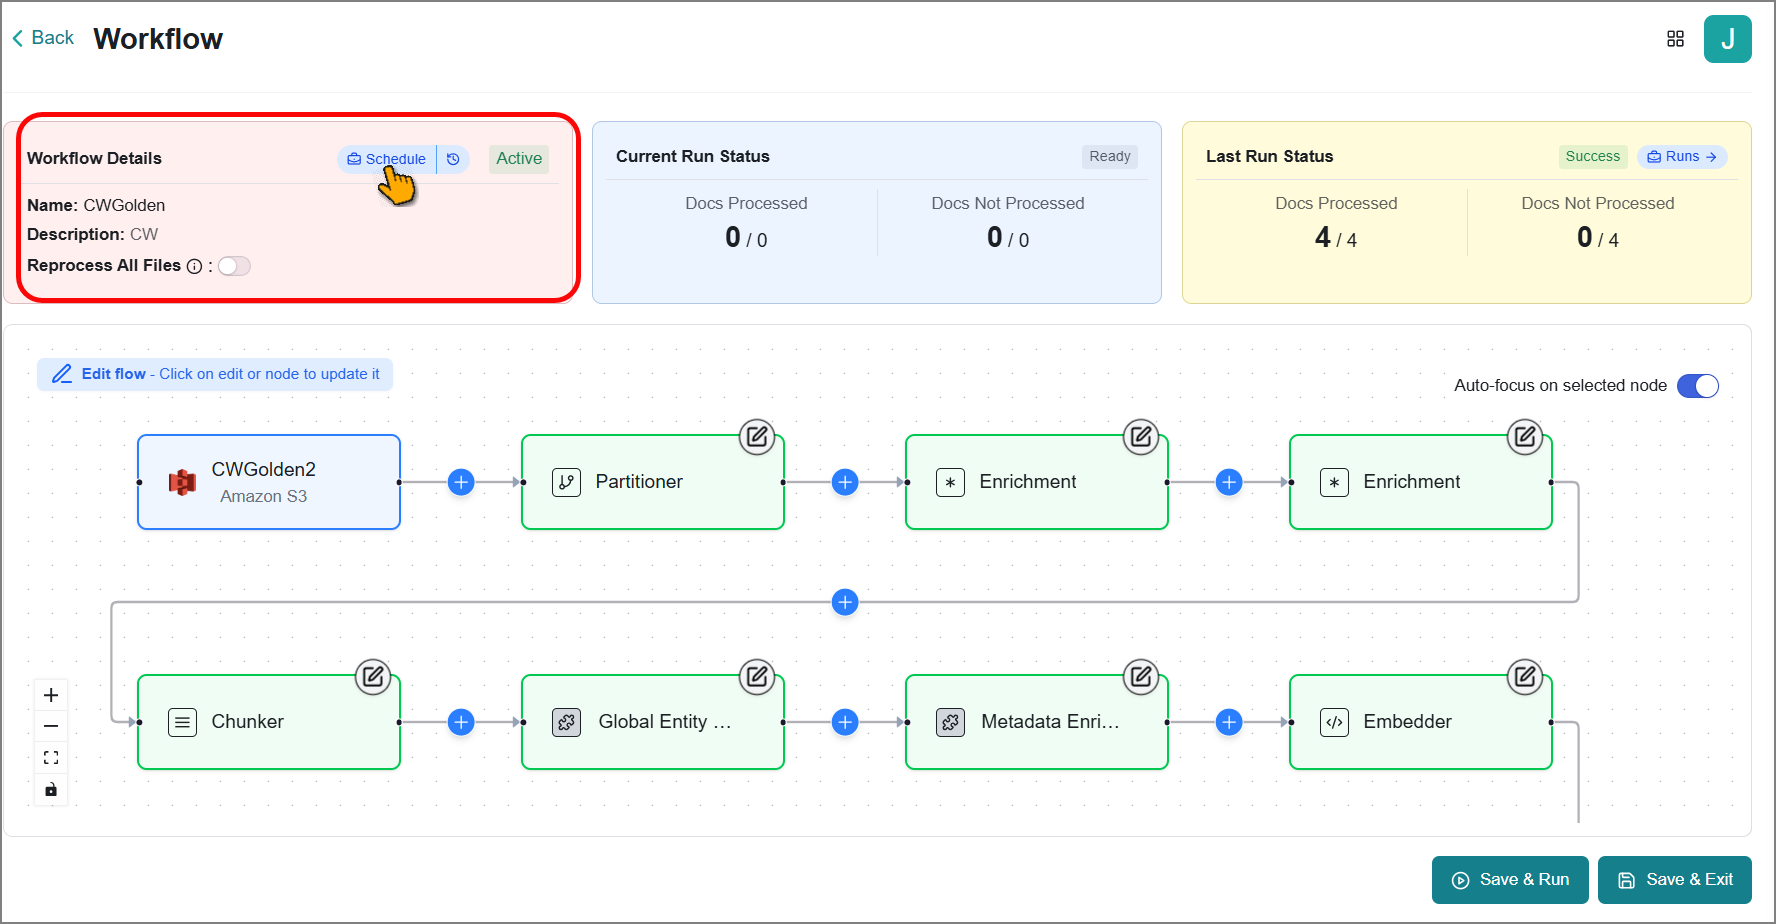
Tip
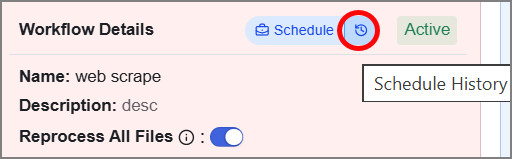
Use the
 icon to open the Schedules History and view a complete list of workflow schedulers and their execution details.
The Schedule window opens.
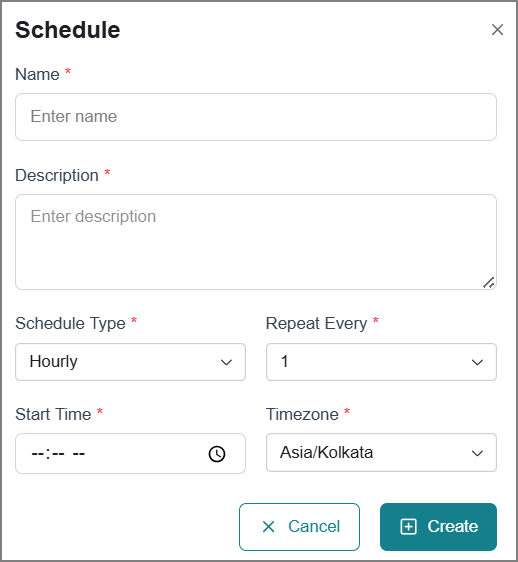
Enter relevant details in the fields.
Field
Description
Name
Enter a name for this schedule.
Description
Enter additional details about the purpose or scope of the schedule.
Schedule Type
Select how frequently the schedule should run:
Hourly
Daily
Weekly
Monthly
Yearly
Repeat Every
Specify the interval for the recurring schedule.
Hourly schedule - 1 to 23
Daily schedule - 1 to 31
Notice
If the scheduler tries to start a new job while a previous one is still running, the system will cancel the new job to avoid overlapping executions.
Days of the week
Select one or more days of the week to run the schedule.
Available for a Weekly schedule only.
Day of the Month
Select the specific date of the month to run the schedule.
Available for Monthly schedules only (1 to 30).
Day and Month
Select the specific month and date to run the schedule.
Available for Yearly schedules only.
Start Time
Set the time when the schedule should begin.
Timezone
Select your timezone to ensure the schedule runs at the correct local time.
Click Create.
The scheduled run has been created, and it will be triggered automatically according to your selected schedule.
Note
Follow the same procedure to update the existing schedule.
Schedules History
The Schedules feature tracks the execution history of both automated and manual runs, and helps you monitor and manage your processes efficiently.
To access the Schedules page:
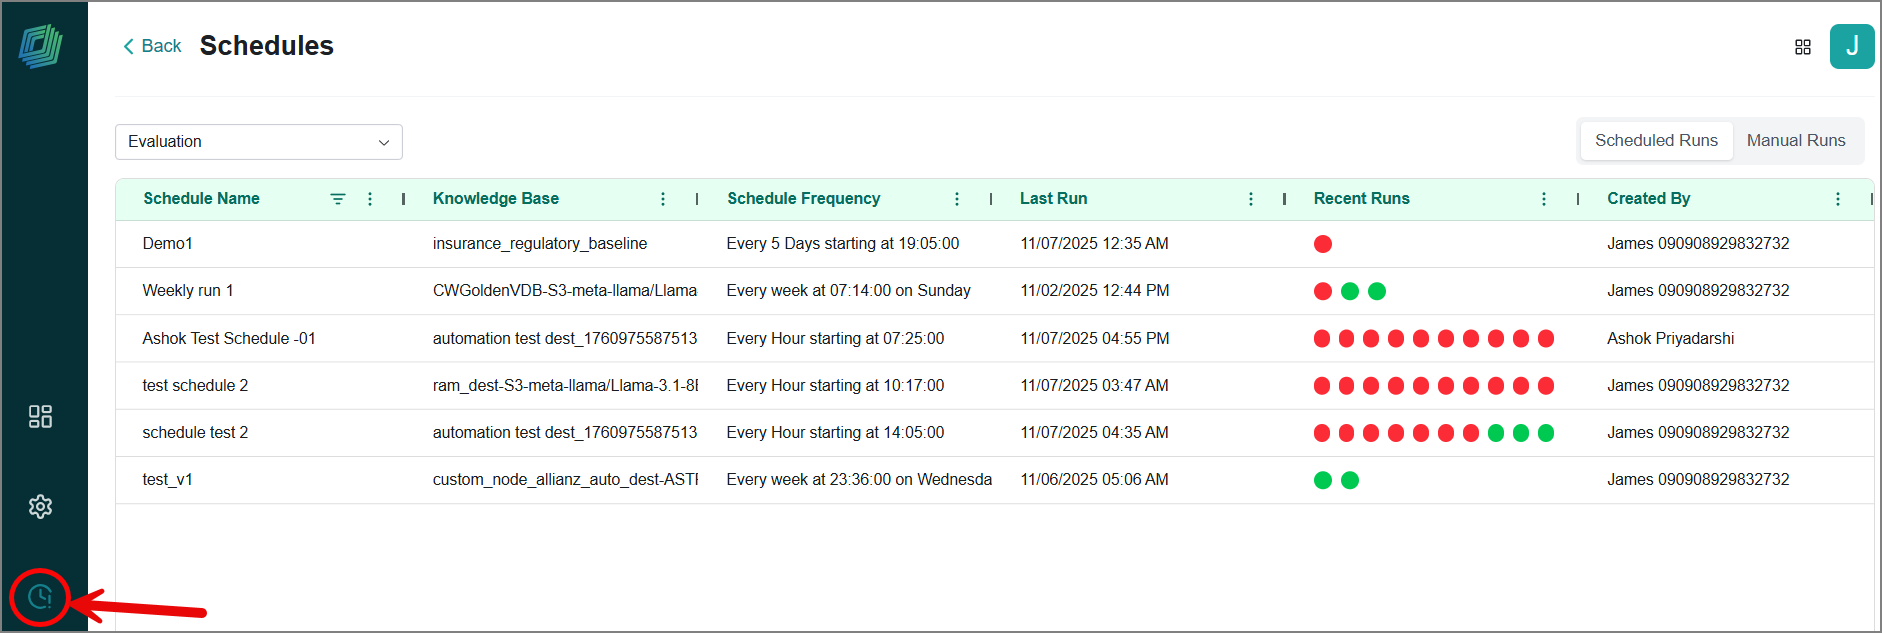
Click the Schedules icon in the left-side panel.
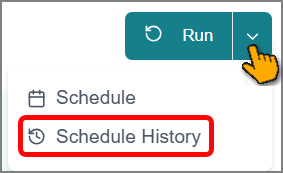
Alternatively, select the Schedule History option from the following sections:
Data Ingestion > Workflow
Data Agents, Evaluation, and Fine-tuning Studio
The Schedules page opens and displays execution details and historical data for all runs. The page is organized into two tabs:

Scheduled Runs tab - Displays the complete history of automated executions.
Agent
Classification Workflows
Data Engineering Agent
Data Orchestration Agent
Data Workflows
Evaluation
Fine-tuning Studio
Manual Runs tabs - Displays the complete history of manually triggered executions.
Agent
Data Engineering Agent
Data Orchestration Agent
Data Prep Workflows
Data Workflows
Evaluation
Fine-tuning Studio
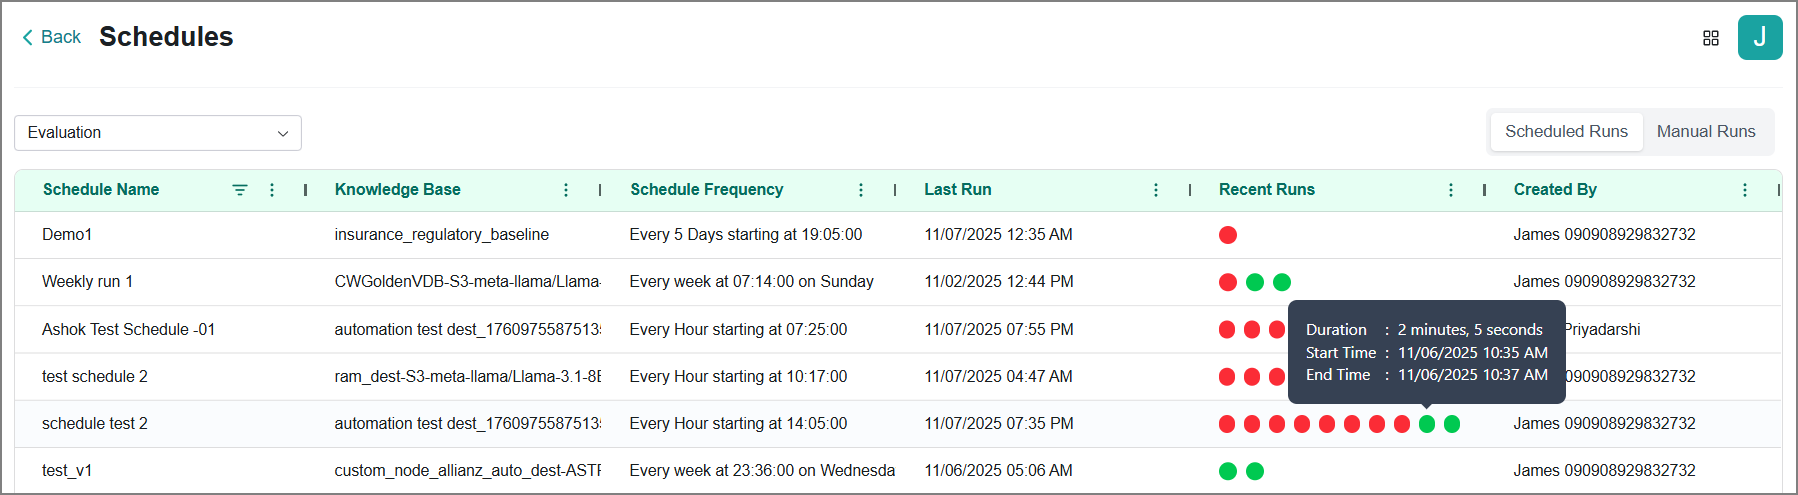
Each item displays up to ten historical runs in the Recent Runs column. Status is indicated through color coding:
Green - Execution successful
Orange - Execution in progress
Red - Execution unsuccessful
Hover over the indicator to view its detailed information.
Filtering Runs
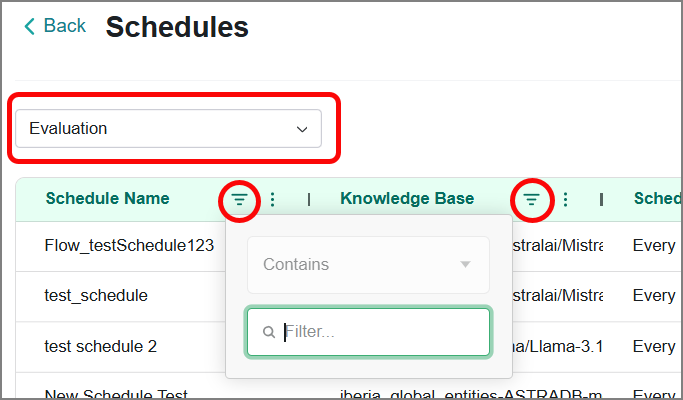
Use the top filters to find the required run:
Dropdown Filter – Click the dropdown and select a run category to narrow your results.
Search Box – Type the schedule name or knowledge base name to quickly find results.
Viewing Workflow History
At the bottom of the Data Ingestion page, you can view real-time details of existing workflows in a card view. Each card displays pipeline configurations, execution status, and error diagnostics, enabling you to maintain data integrity, monitor performance, and troubleshoot issues effectively.
To find a specific workflow, select the data type, then either enter its name in the Search Workflow box or scroll through the list of available workflows.
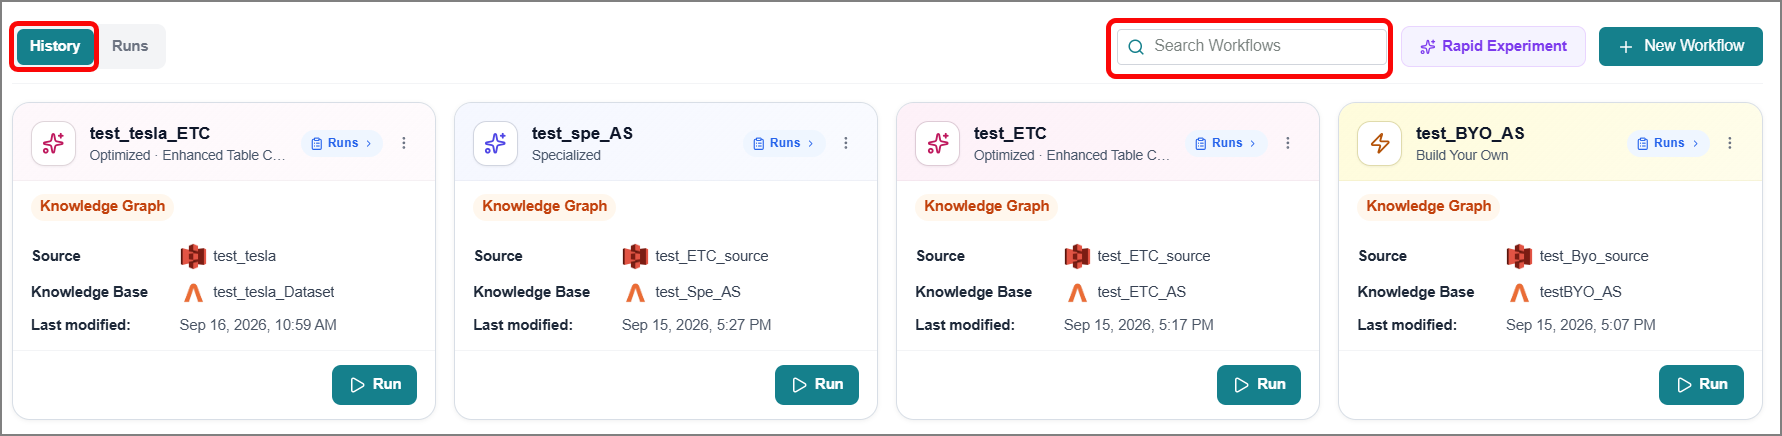
Click the card to open its configuration page, where you can modify the workflow as needed.
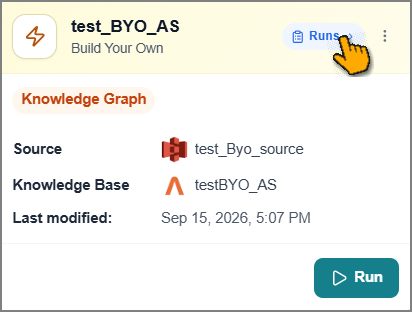
Click Runs to view information about all workflow executions in the Runs tab.
Click the Ellipsis
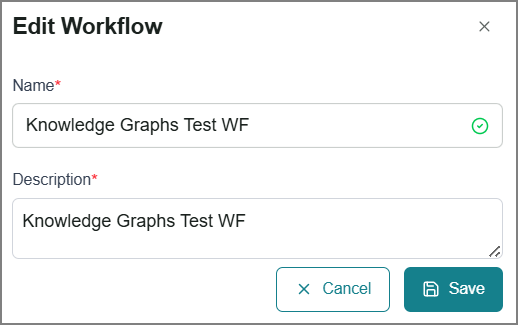
 icon and select Edit.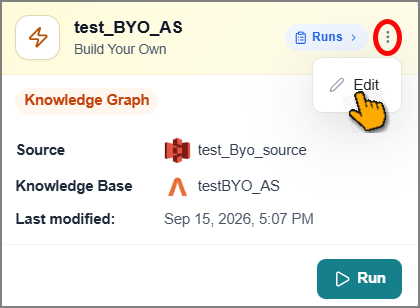
The Edit Workflow window opens to update the workflow's name and description.
Upon successful completion of the workflow, the processed data becomes available for AI-driven tasks.
Viewing Runs
At the bottom of the Data Ingestion page, you can view real-time details of existing workflow execution and their details, such as workflow name, status, timestamp, and flowchart.
Go to the Runs tab to see a list of all execution instances initiated for the workflows.
Click the workflow dropdown and select the required workflow from the list to view its execution details.
Use the time frame filter to find specific runs.
Click View Details to view additional details for a specific execution.
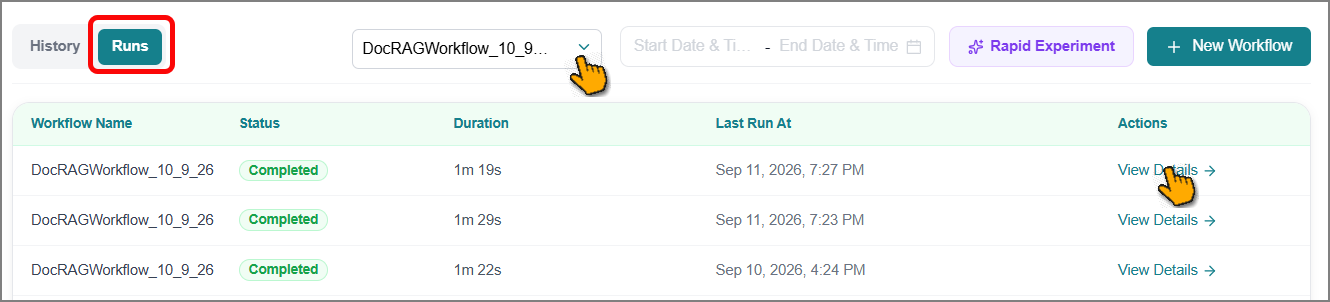
The details are displayed on the right-side panel.
Click View Entity & Chunk Coverage on the Data Quality Checker module to view data quality matrices.
The Entity & Chunk Coverage panel displays data quality information by matching ingested data with the Global Entity Enricher module.
Click
to view information about insight measurement methodology.Click > to expand the document and reveal the complete entity breakdown.
Supporting File Types
The Business AI Cloud supports multiple file formats for data ingestion, RAG processing, and Vector Database storage. This section provides a complete list of compatible file types you can use on the platform to create a KB.
Category | Formats | Description |
|---|---|---|
Word Processing | .abw | AbiWord Document |
.doc | Microsoft Word Document (Legacy) | |
.docx | Microsoft Word Document | |
.dot | Microsoft Word Template | |
.dotm | Microsoft Word Macro-Enabled Template | |
.hwp | Hangul Word Processor | |
.odt | OpenDocument Text | |
.rtf | Rich Text Format | |
.zabw | Compressed AbiWord Document | |
Portable Document Format | ||
Presentation | .pot | PowerPoint Template |
.ppt | Microsoft PowerPoint Presentation | |
.pptm | PowerPoint Macro-Enabled Presentation | |
.pptx | Microsoft PowerPoint Presentation | |
Spreadsheets | .csv | Comma-Separated Values |
.dbf | dBase Database File | |
.et | Kingsoft Spreadsheet | |
.fods | OpenDocument Flat XML Spreadsheet | |
.mw | MacWrite Document | |
.tsv | Tab-Separated Values | |
.xls | Microsoft Excel Spreadsheet (Legacy) | |
.xlsx | Microsoft Excel Spreadsheet | |
Structured Data | .dif* | Data Interchange Format |
.xml | Extensible Markup Language | |
.Json | JavaScript Object Notation Applicable for Build Your Own workflow type only. | |
Email Formats | .eml | Email Message |
.p7s | Digitally Signed Email Message | |
.msg | Outlook Mail Message | |
Plain Text | .txt | Plain Text File |
Markdown & Documentation | .md | Markdown |
.rst | reStructured Text | |
.org | Org Mode | |
Web Formats | .htm | HTML Document |
.html | HTML Document | |
Image Formats | .bmp | Bitmap Image |
.heic | High Efficiency Image Container | |
.jpeg | JPEG Image | |
.jpg | JPEG Image | |
.png | Portable Network Graphics | |
.prn | Printer File | |
.tiff | Tagged Image File Format | |
Apple Formats | .cwk | AppleWorks / ClarisWorks Document |
.mcw | MacWrite Document | |
Specialized Formats | .epub | Electronic Publication |
.eth | Ethereum-related File | |
.pbd | Proprietary Binary Data | |
.sdp | Session Description Protocol | |
.sxg | StarOffice Master Document |
Note
* When processing the .dif file type, note that \n characters are supported. However, \r\n characters will result in an UnsupportedFileFormatError with the message Partitioning is not supported for the FileType.UNK file type.
Supporting File Types - Agentic Search
The Business AI Cloud supports multiple file formats for data ingestion, RAG processing, and Vector Database storage. This section lists all compatible file types you can use to create a knowledge graph that enables Agentic Search.
Category | Formats | Description |
|---|---|---|
Word Processing | .doc | Microsoft Word Document (Legacy) |
.docx | Microsoft Word Document | |
.odt | OpenDocument Text | |
Portable Document Format | ||
Presentation | .ppt | Microsoft PowerPoint Presentation |
.pptx | Microsoft PowerPoint Presentation | |
Spreadsheets | .csv | Comma-Separated Values |
.xlsx | Microsoft Excel Spreadsheet | |
Image Formats | .bmp | Bitmap Image |
.jpeg | JPEG Image | |
.jpg | JPEG Image | |
.png | Portable Network Graphics | |
.dib | Device-Independent Bitmap | |
.webp | Web Picture Format | |
.tif | Tagged Image File | |
.tiff | Tagged Image File Format |
Structured Data Ingestion
Transform your Relational and NoSQL databases into AI-ready Knowledge Bases (KB) with structured data ingestion in Data Layers. Simply connect to your database sources, and the Business AI Cloud platform automatically organizes, refines, and transforms your structured content for AI-driven workflows. Enjoy secure data management with a zero-copy architecture that keeps your data safe while maximizing usability.
Key Elements
Data Modification - Standardize and adjust data attributes to meet downstream application needs.
Metadata Enrichment - Define and maintain descriptive metadata that adds context and enhances discovery.
Data Classification - Group data into logical categories or taxonomies to streamline search and retrieval.
Select the Relational DB or NoSQL to view all existing data source connections and provide insights, such as the count of all sources, synced sources, and unsynced sources.
Creating a Connection
To create a KB, you must first establish a connection to the data sources.
Go to the Home page > Data Ingestion > Relational DB and click Import Metadata.
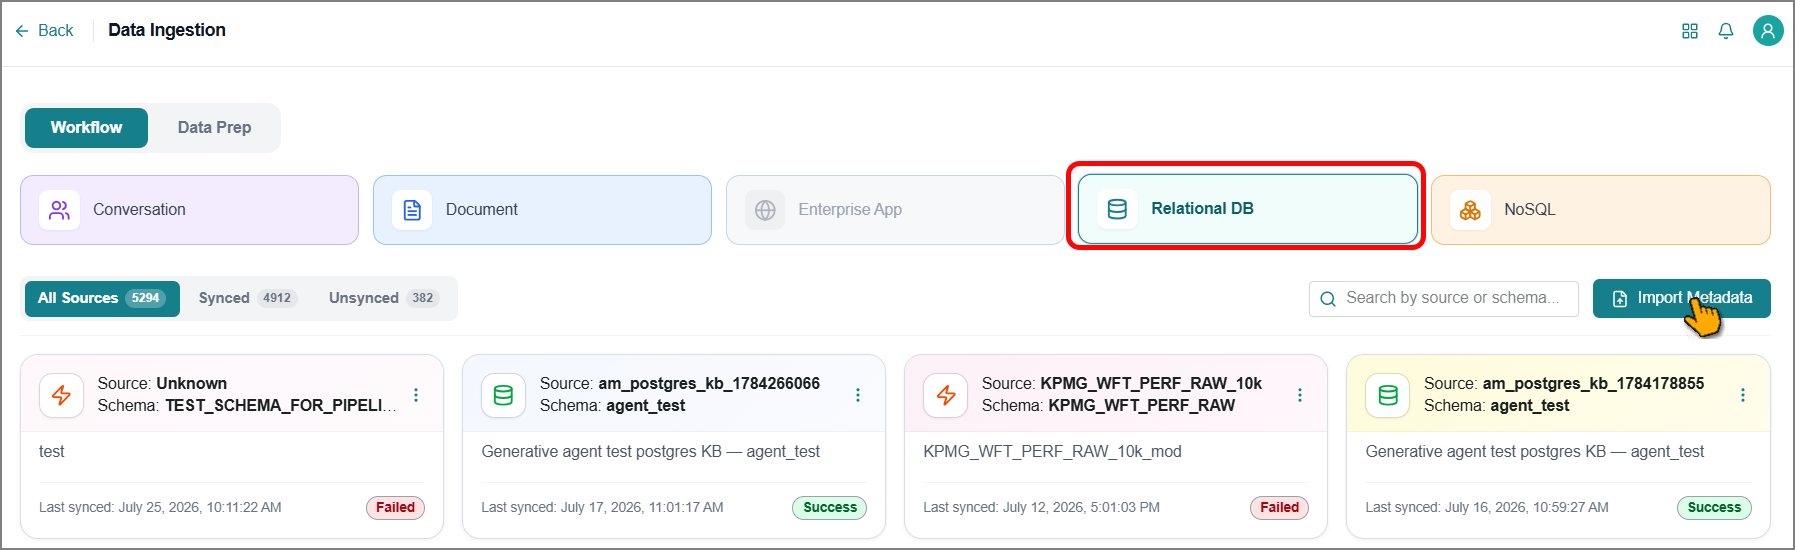
The side panel opens with configuration settings.
Click the Select Source dropdown, then choose a preconfigured relational database source.
The platform displays the schema and lists all related tables for you to choose from.
Click Select Tables, then select the tables you want to import.
Note
By default, the platform selects all tables. Select only the tables whose metadata you need; the platform imports metadata only, not the actual table data.
Click the Select Destination dropdown, then choose a preconfigured Knowledge Base.
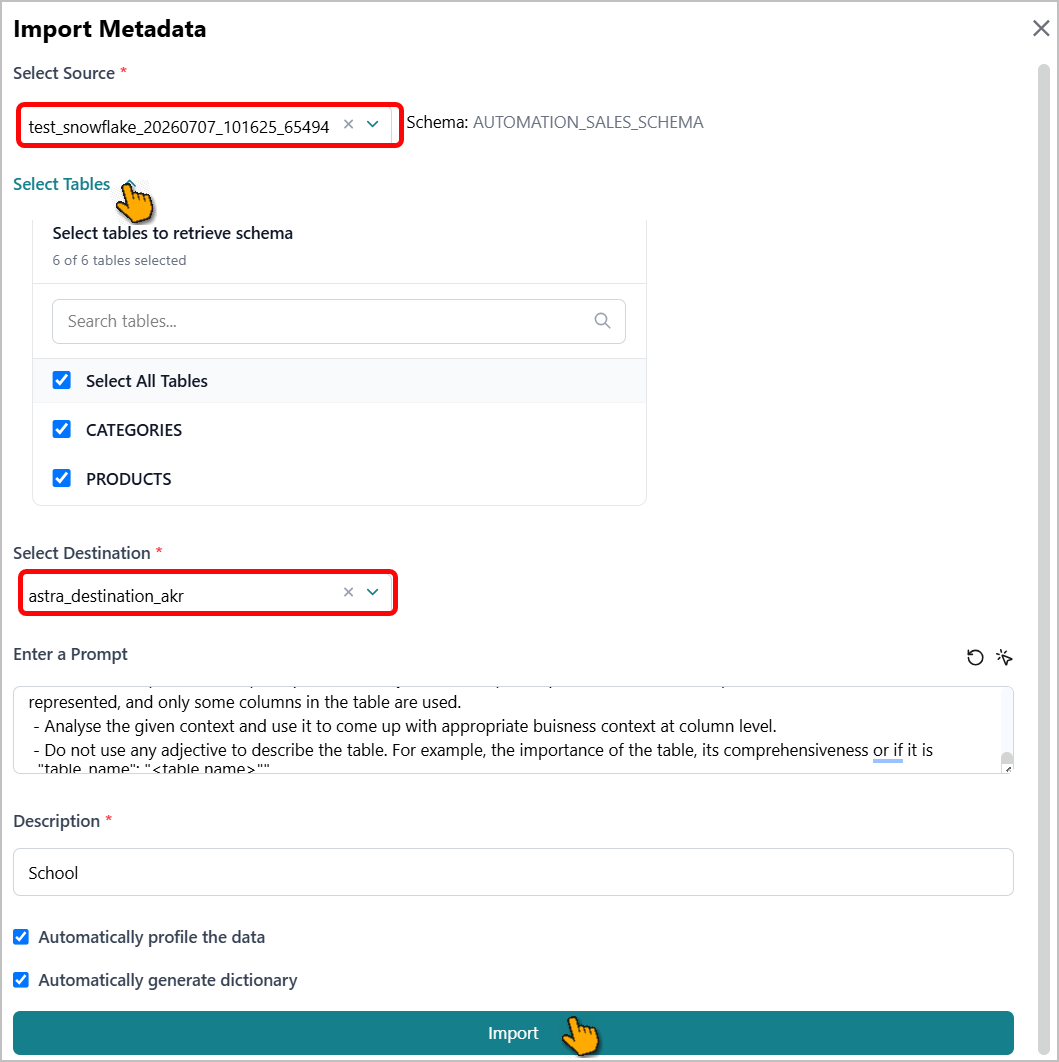
The platform displays default prompt descriptions for the entities to be extracted. You can modify these descriptions as needed:
Update the text directly in the description field.
Click
to Choose a New Prompt.Click
to reset all changes and restore default values.
Enter a detailed description for this KB creation.
Enable the Automatically Profile the Data option to allow the platform to classify metadata according to predefined rules.
Enable the Automatically Generate Dictionary option to allow the platform to create LM-generated descriptions for metadata.
Click Import.
The new data is created on the page. The platform establishes a connection with the source and collects the associated metadata.
Filtering a Connection
Use the available filters to quickly find the desired connection.
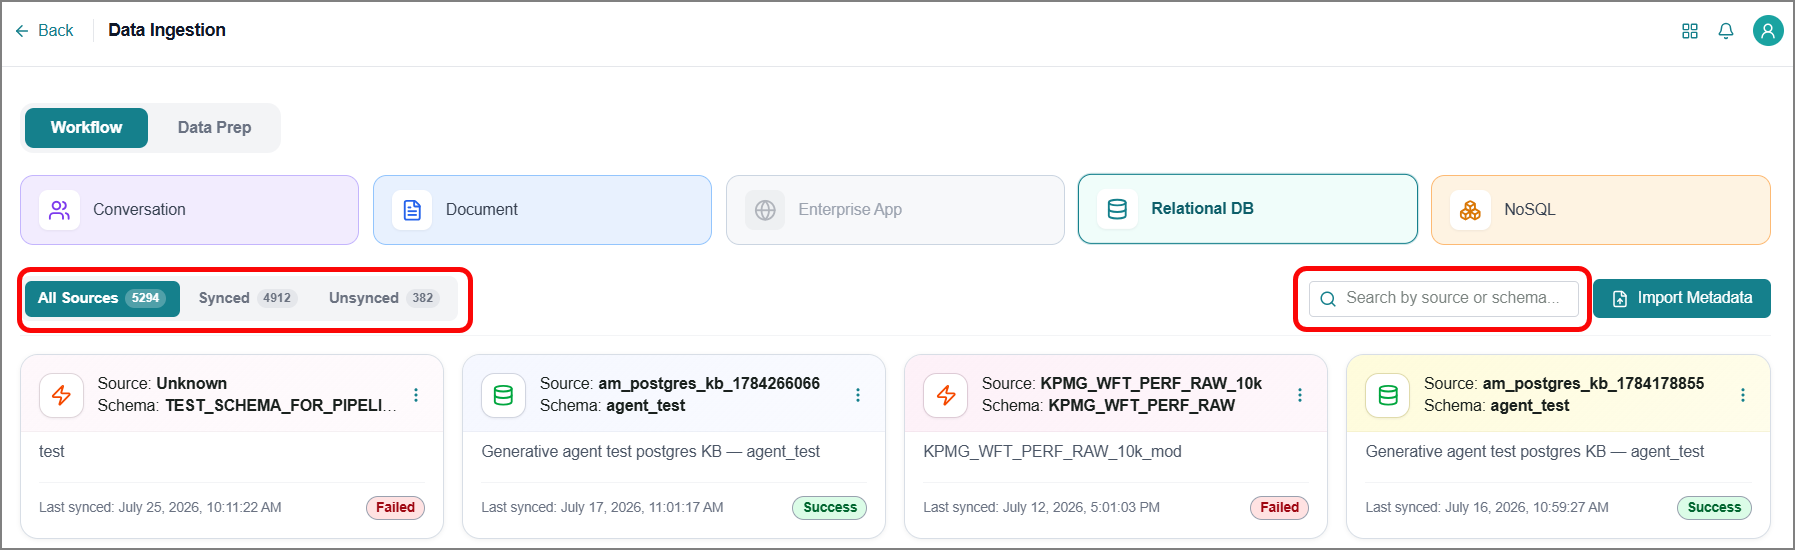
Enter the source name, schema, or description in the Search Box to locate the desired connection.
Toggle between the following tabs to locate the desired connection:
All Sources – Lists all existing connections.
Synced – Lists connections that have been successfully synced and have collected metadata.
Unsynced - Lists connections that have not been synced successfully.
Viewing Metadata
Each connection displays its syncing status to reflect the current state of the data import process, along with the timestamp of the last successful sync.
Processing - The platform is attempting to establish a connection with the source.
Failed - The connection attempt or metadata import process was unsuccessful due to an error.
Completed - The connection was successfully established, and metadata was imported without errors.
The platform allows you to view all metadata imported from your source system. You also have the flexibility to edit the automatically generated descriptions and adjust table relationships to ensure they accurately reflect your data structure.
To view metadata:
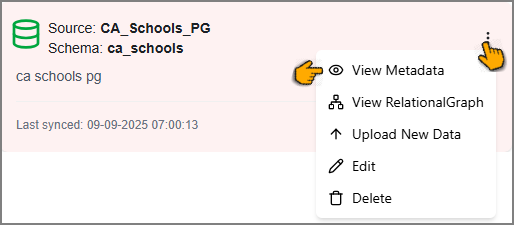
Go to the desired connection and click the Ellipsis
 icon to view additional options.
Click View Metadata.
The Data Visualization page opens with the Data Profile tab selected by default.
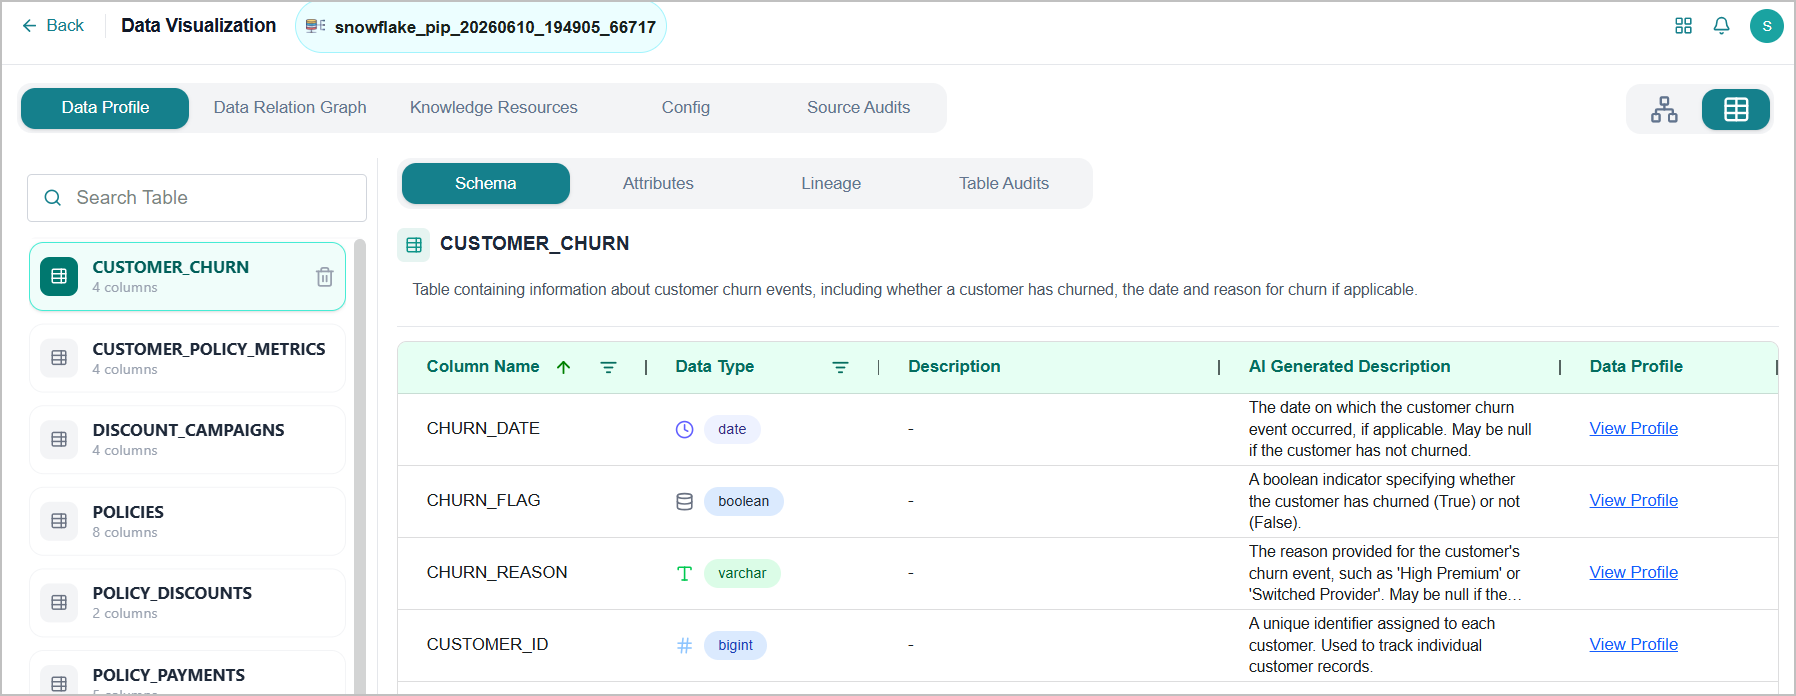
The page has two main areas:
Left Panel: Displays all tables available in the selected KB. Select a table to load its metadata in the right panel.
Right Panel: Displays detailed information about that table across these tabs:
Schema tab - Displays table-level description and column-level details.
Attributes tab - You can create and view Personally Identifiable Information (PII) groups for the columns in the selected table.
Lineage tab - Displays a visual graph of your data's full journey.
Table Audits tab - Displays the table's change history, including modifications and their timestamps.
Schema Tab
The Schema tab displays table-level and column-level metadata for the selected table.
Update the Table Description
To update the table description, search and filter the required table within the Schema tab.
Use the search box on the left panel to locate the table you want to update.
Select it to view the table's metadata in the right panel.
Click the description box to edit.
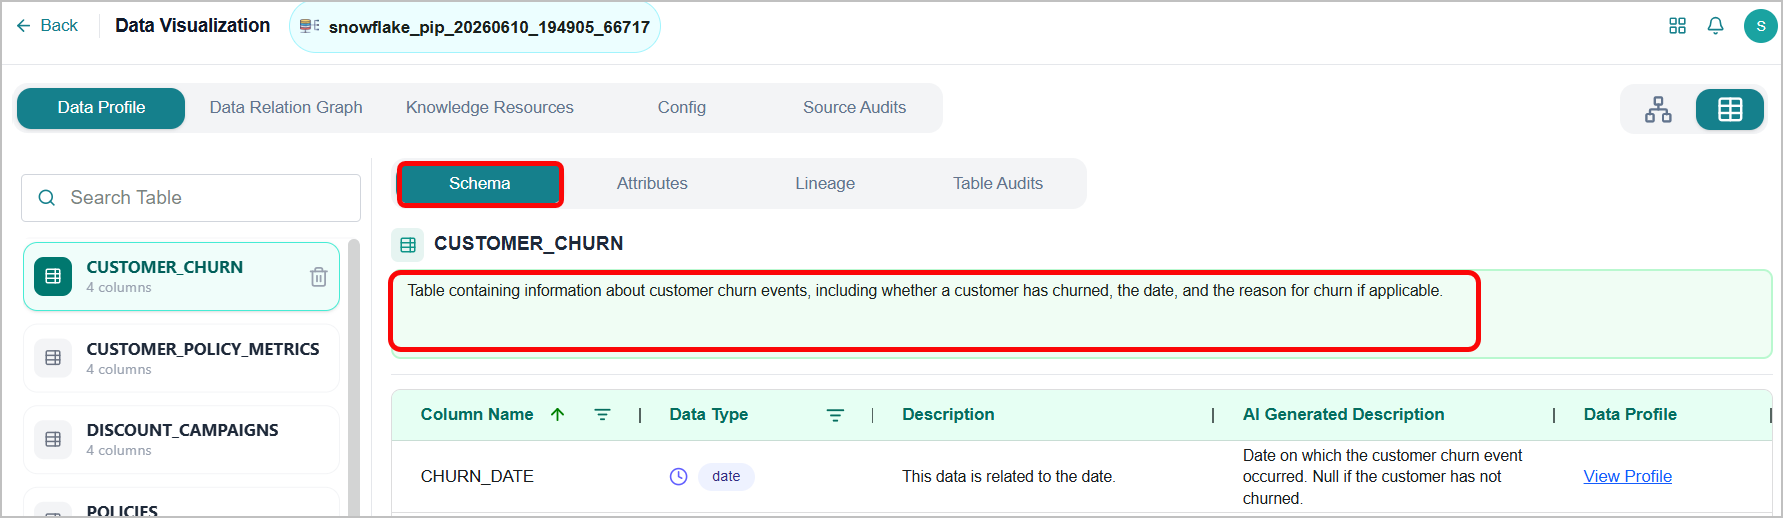
Update the description as needed.
The description is auto-saved, and a success message appears.
Update a Column Description
To view and update a column description:
Apply column-level filters to narrow down and locate specific data within the selected table.
Hover over the row to view the addition option, click the Edit
 icon on the description cell to edit the existing description, or add a new one.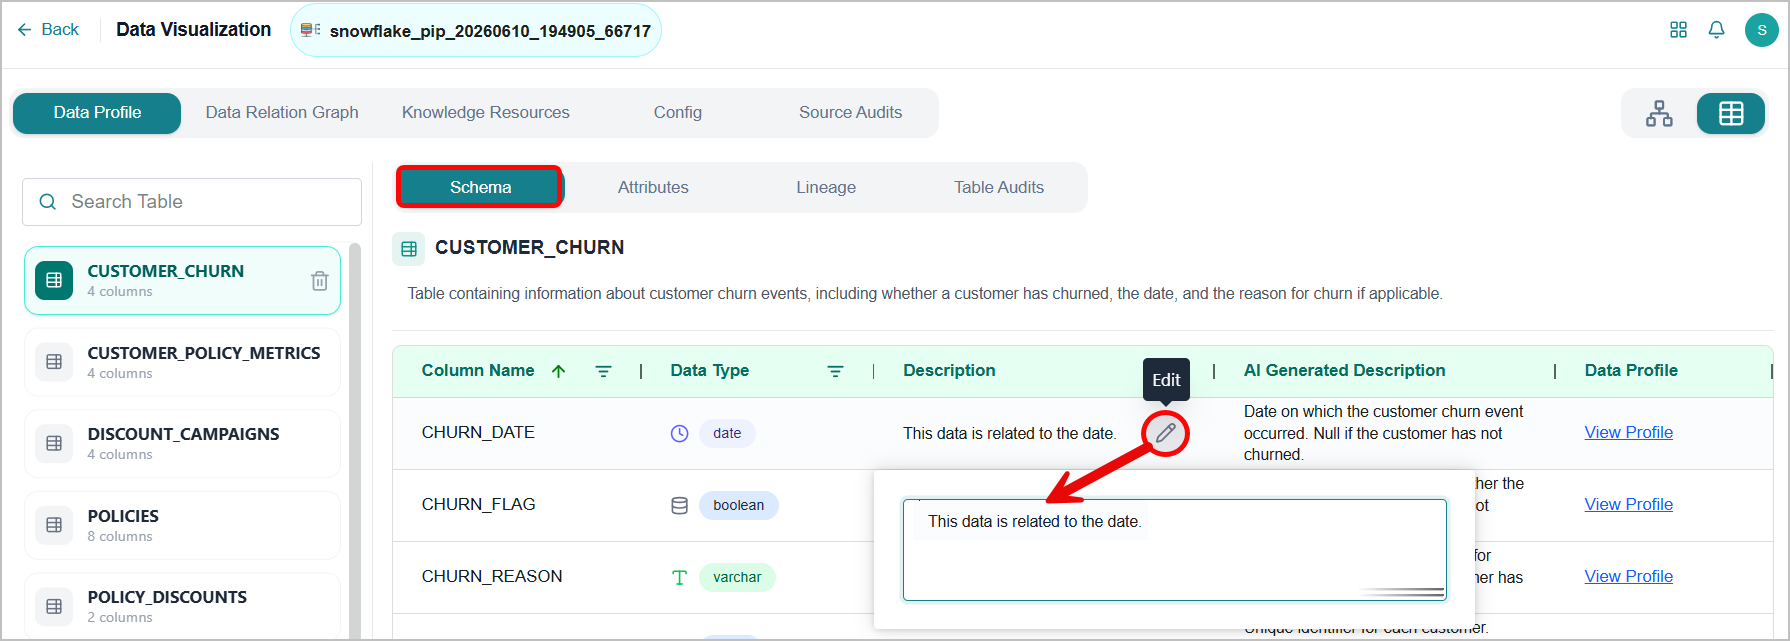
By default, the agent generates an AI-Generated Description, a natural-language summary that explains the table's purpose, contents, and context.
Viewing a Data Profiling
The platform automatically profiles your data when it creates or refreshes a Knowledge Base.
To view the data profiling:
Click View Profile.
The Data Profile panel opens from the right.
Choose table columns from the dropdown to view their key details.
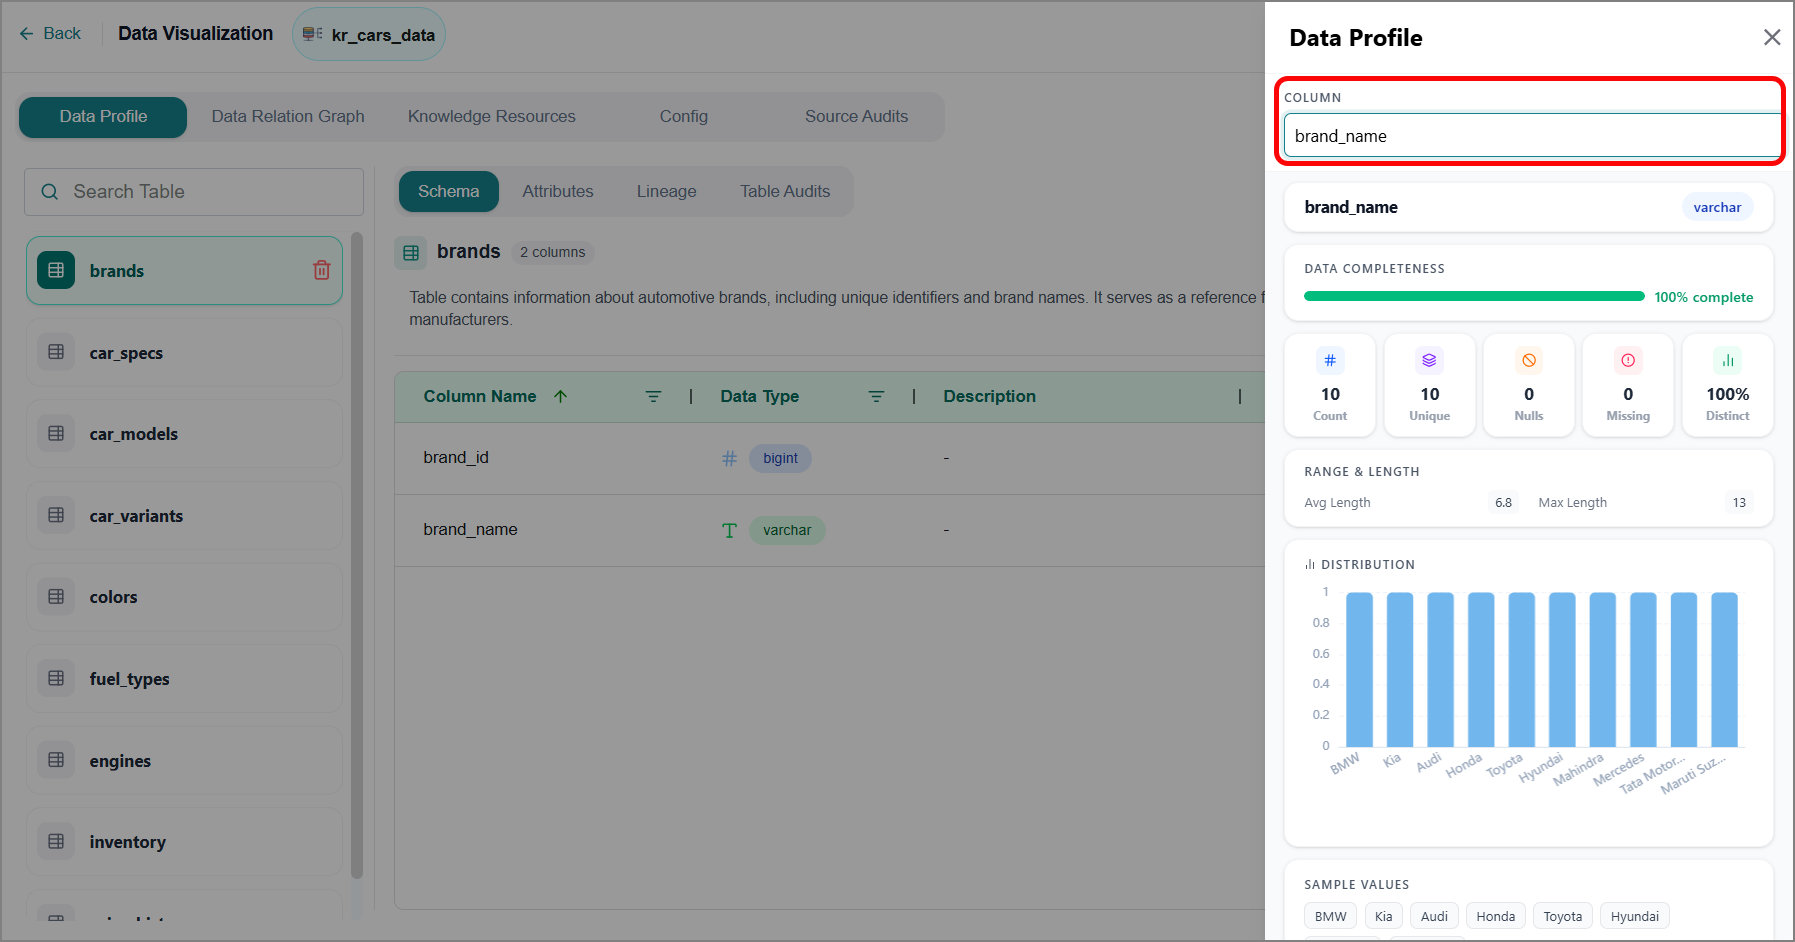
Attributes Tab
The Attributes tab lets you tag and organize columns in the selected table to capture how each one is used and how it should be protected. Use this tab to:
Create and manage Personally Identifiable Information (PII) to track and protect personal information.
Tag columns as Watermark or Natural Key columns.
Switch to the Attributes tab to view and update these settings.
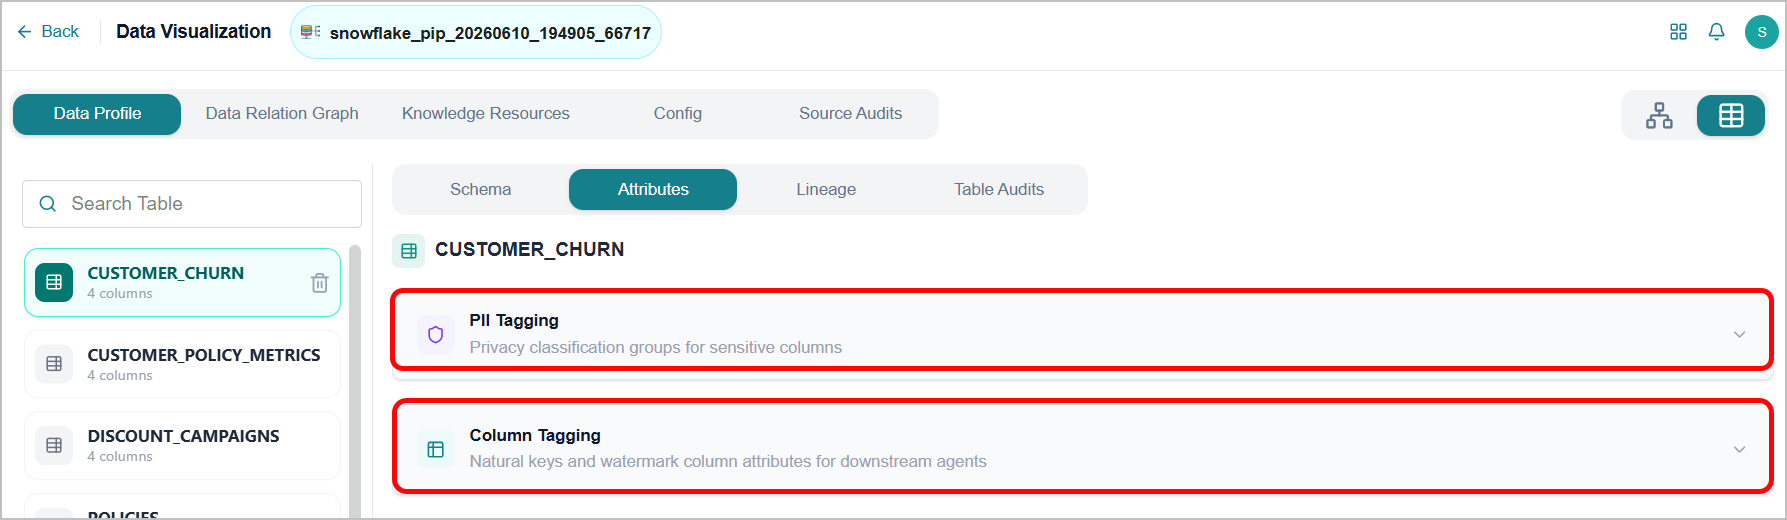
Creating a PII Group
A PII group identifies columns that contain Personally Identifiable Information, such as names, email addresses, or ID numbers.
Expand the PII Tagging section.
Click Add PII Group.
The Add PII Group window opens.
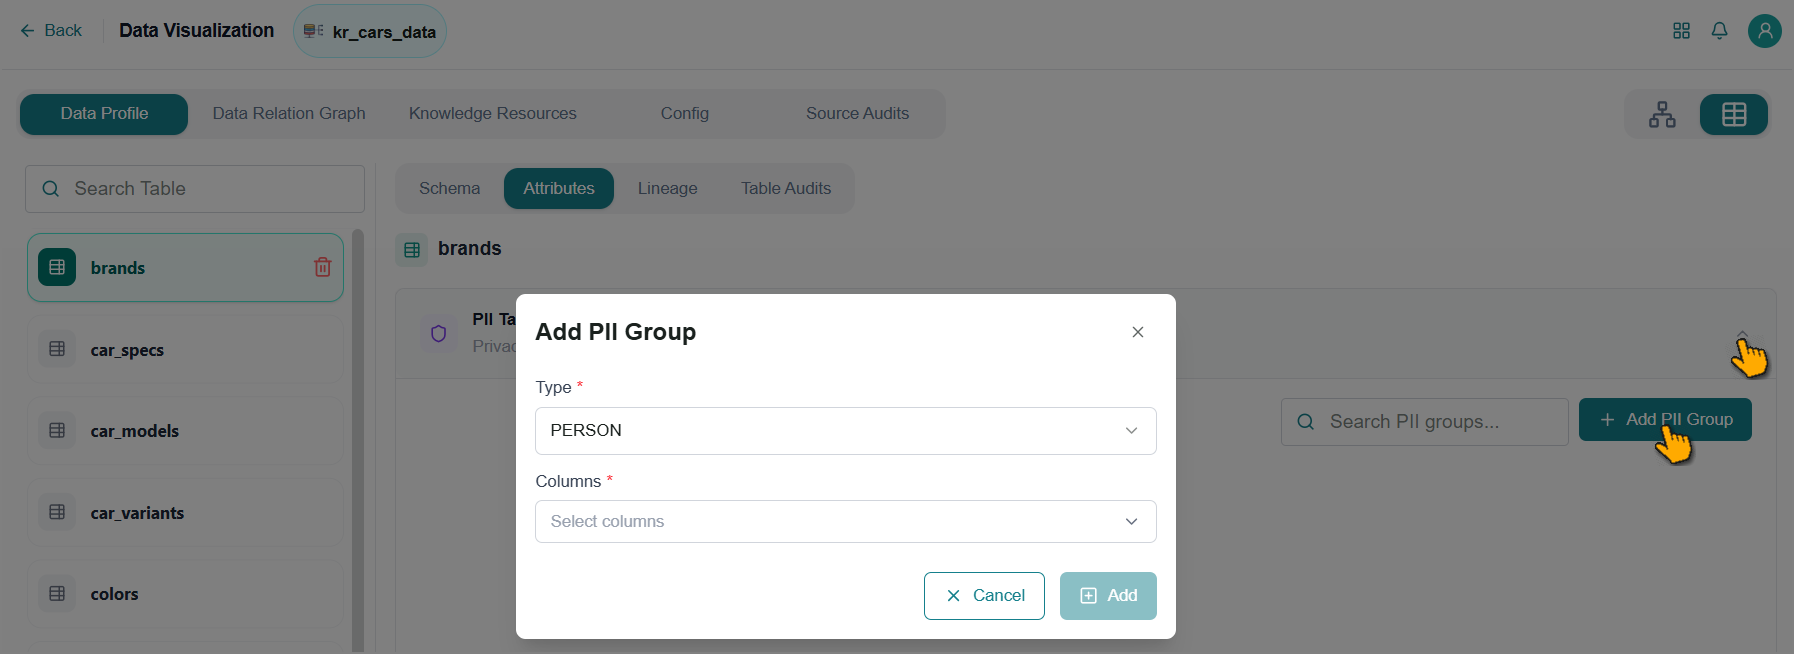
Select the PII type from the dropdown.
Select one or more columns from the table using the dropdown.
Click Add.
The new PII group appears as a card on the tab.
Modifying a PII Group
After you create a PII group, you can modify it at any time.
Expand the PII Tagging section.
Click the Ellipsis
icon on the group card.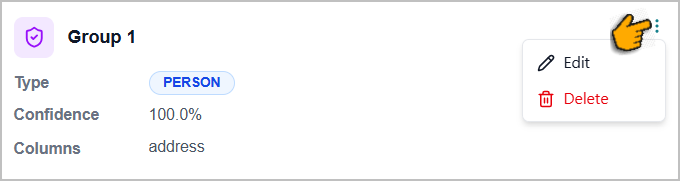
Click Edit.
The Edit PII Group window opens.
Update the PII type and column selections as needed.
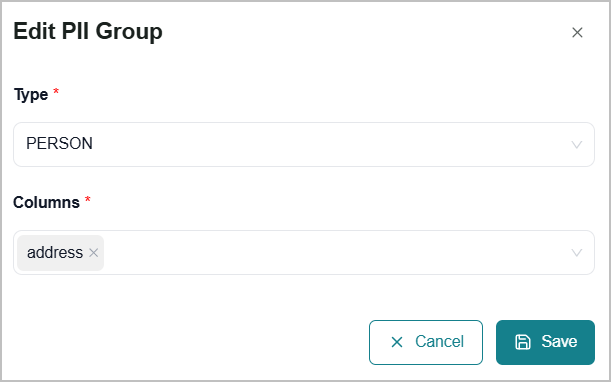
Click Save to.
Deleting a PII Group
Click the Ellipsis
icon on the group card.Click Delete.
A confirmation dialog box opens.
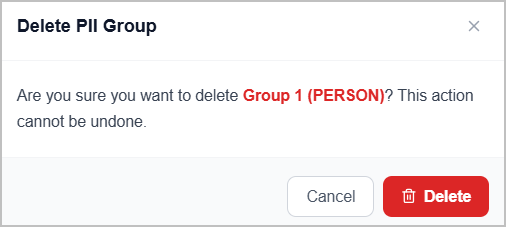
Click Delete to confirm.
A success message appears, and the group is removed from the list.
Note
Removing a PII group does not delete or alter the columns themselves. It only removes the classification label from those columns.
Tagging Columns
Tag columns as Watermarks or Natural Keys, so downstream processes can identify and use the correct columns.
Watermark column - A column, usually a timestamp or a sequence number, that shows how up to date each row is. The platform uses this tag to detect new or changed records since the last sync.
Natural key column – A column that already exists in your data and uniquely identifies each row. The platform uses this tag to identify records without relying on a system-generated ID.
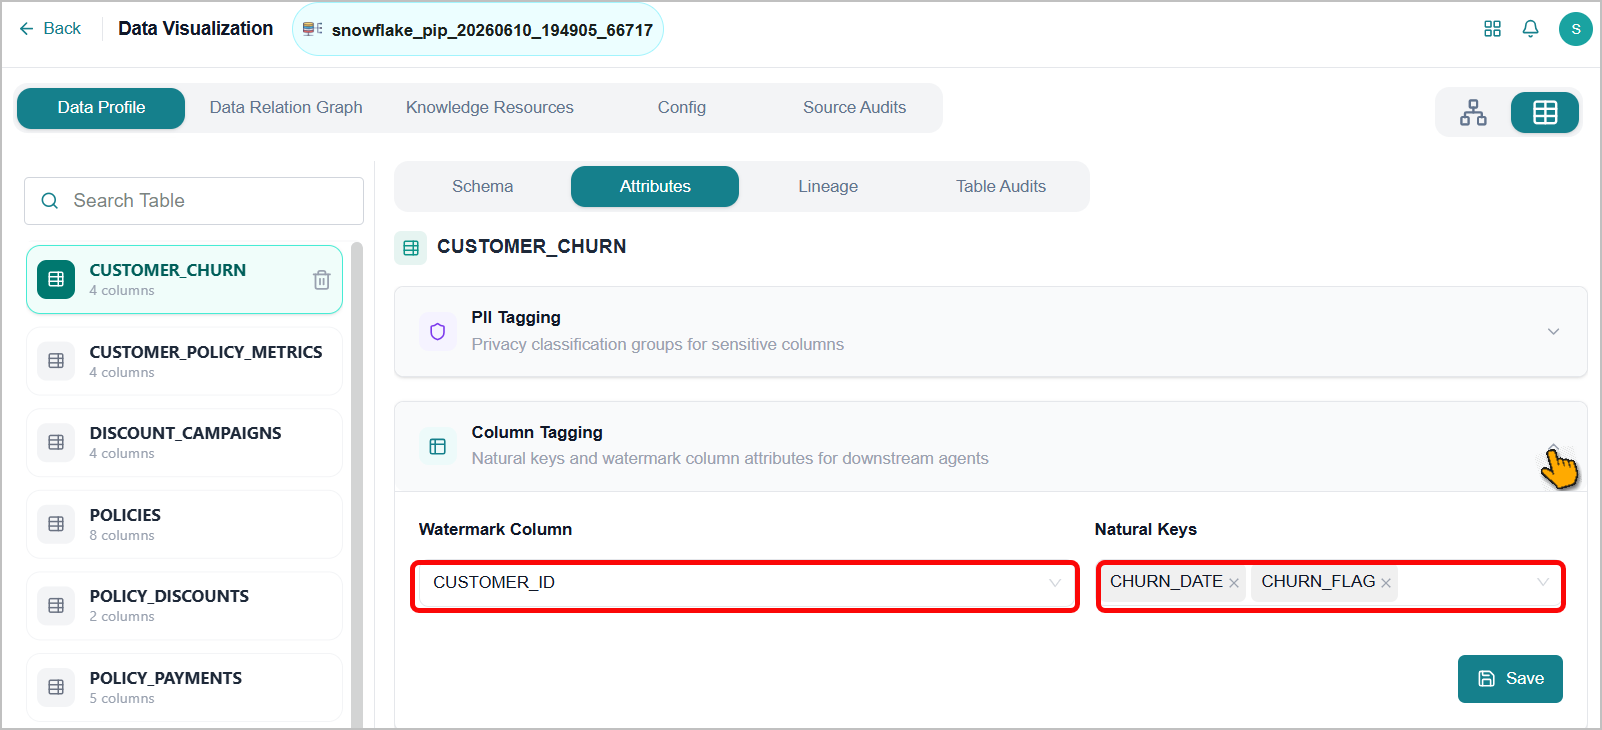
To tag a column:
Expand the Column Tagging section.
Click the Watermark Column dropdown and select the column that best reflects the table's timestamp.
Click the Natural Keys dropdown and select one or more columns that best serve as the table's primary key.
Click Save to save the changes.
Lineage Tab
The Lineage tab provides a visual map of how data flows through the platform for a selected table. The map shows where the data comes from, how it is processed along the way, and where it ends up. Use this view to understand your data's full journey without manually tracing it across multiple sources.
Switch to the Lineage tab. The data flow map appears, showing the complete data path connected to the selected table.
The map displays three types of elements:
Source nodes – Where the data originates.
Transformation nodes – Steps where the data is processed or modified.
Destination nodes – Where the processed data is delivered or consumed.
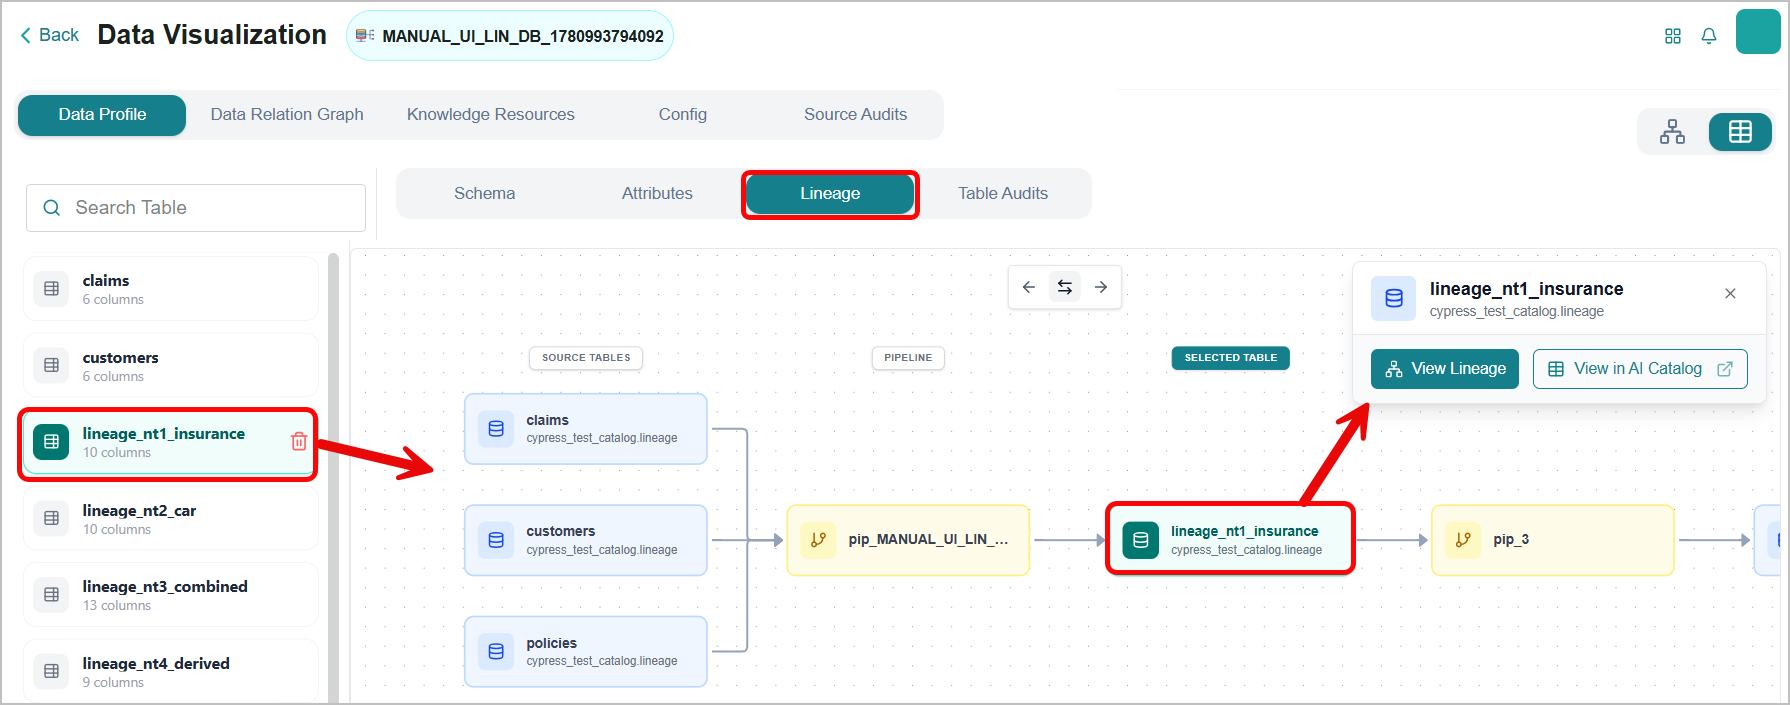
Each shape on the map represents a step in the data flow. You can click any node to see more information about it.
Click a node on the map.
A details panel appears with additional information about that step.
Click View Lineage to open the full lineage view for that table or pipeline.
Click View in AI Catalog to open the related Knowledge Base information in a new browser tab.
Click View Pipeline Detail to open the pipeline information in a new browser tab.
Use the icons in the toolbar to control the scope of the map:
Click the Backward
 icon to display upstream sources only, tracing the path of data before it reaches the selected table.
Click the All
 icon to display the full lineage, showing the complete data flow from source to destination across all transformation steps.
Click the Forward
 icon to display only downstream consumers, tracing how data flows from the selected table to dependent processes or outputs.
Table Audits Tab
The Table Audits tab records all changes made to the table, so you can review and validate table-level modifications.
Switch to the Table Audits tab to view all table-level modifications, each with an associated timestamp.
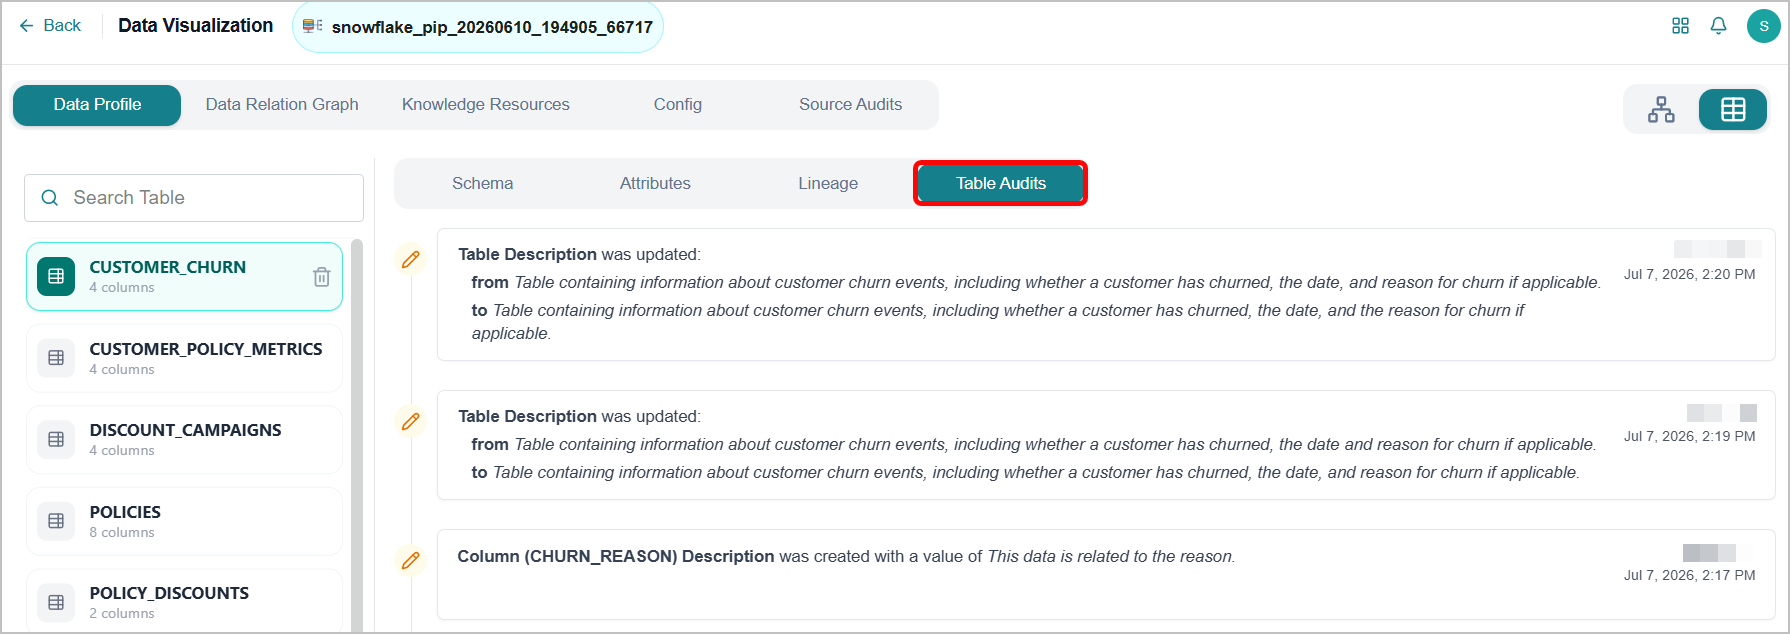
Deleting a Table
You can delete a table from a Knowledge Base (KB) when it is no longer needed.
Warning
Once you delete a table, it is unavailable in the KB until your next workflow run.
To delete a table:
In the left panel, select the table you want to remove.
Click the Delete
 icon.
icon.The confirmation dialog box opens.
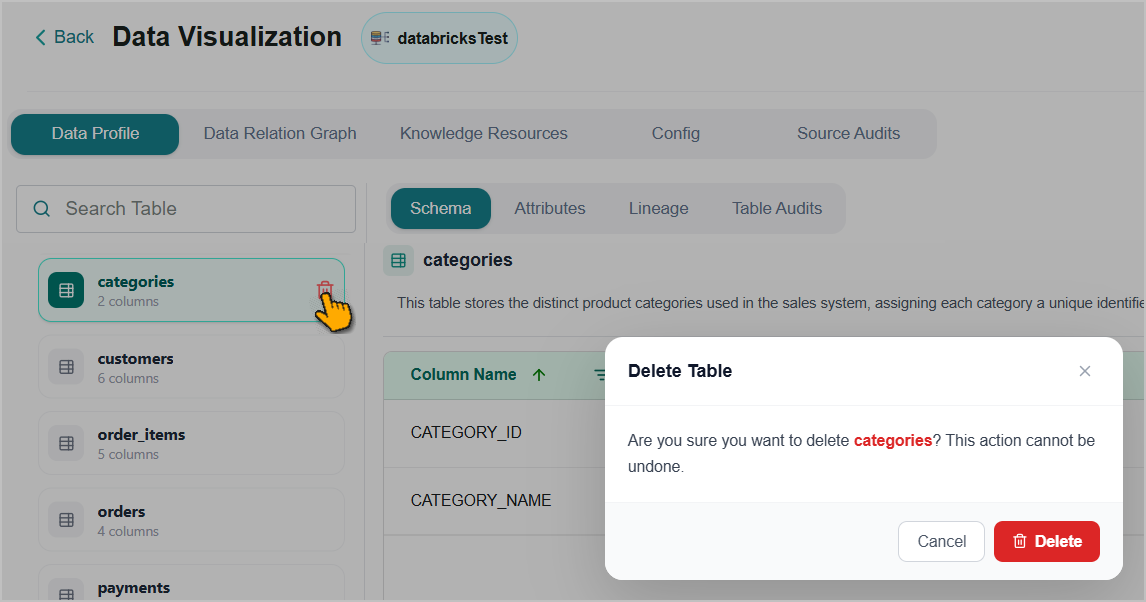
Click Delete to confirm.
The table is removed from the list.
Viewing a Data Relation Graph
The Data Relation Graph is a dynamically generated visual representation of inter-table relationships within a Knowledge Base (KB). The platform automatically constructs this graph during KB creation and updates it with each subsequent KB refresh.
You can also update the graph manually at any time. This gives your agents immediate access to the latest table relationships without waiting for a full KB refresh.
To access this feature:
Go to the desired connection and click the Ellipsis
icon to view additional options.Click View Relation Graph.
The Data Relational Graph tab opens, and the Graph view is displayed by default.
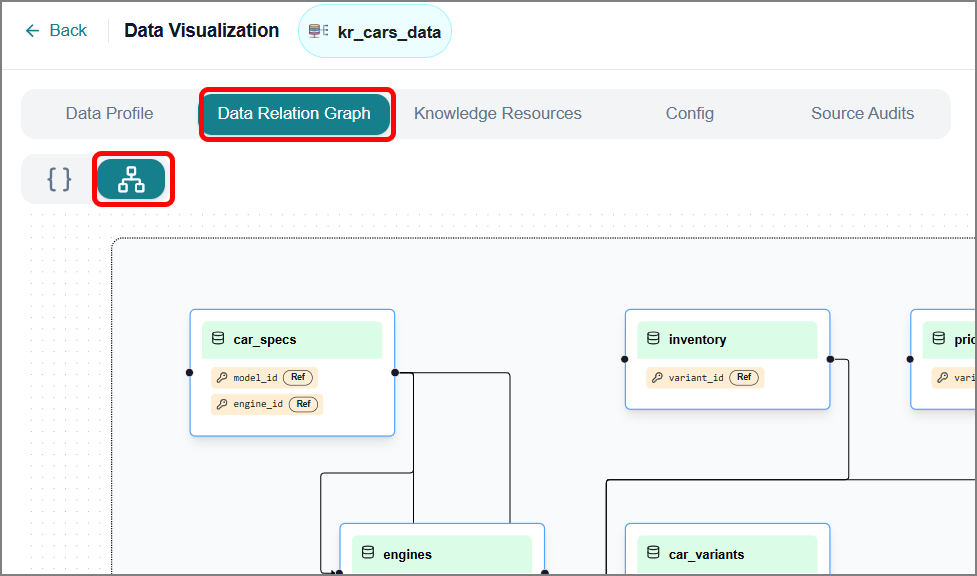
Note
You can use the View Metadata option to open additional tabs.
Click
 to switch to the code view. It displays the table's relationship in JSON format.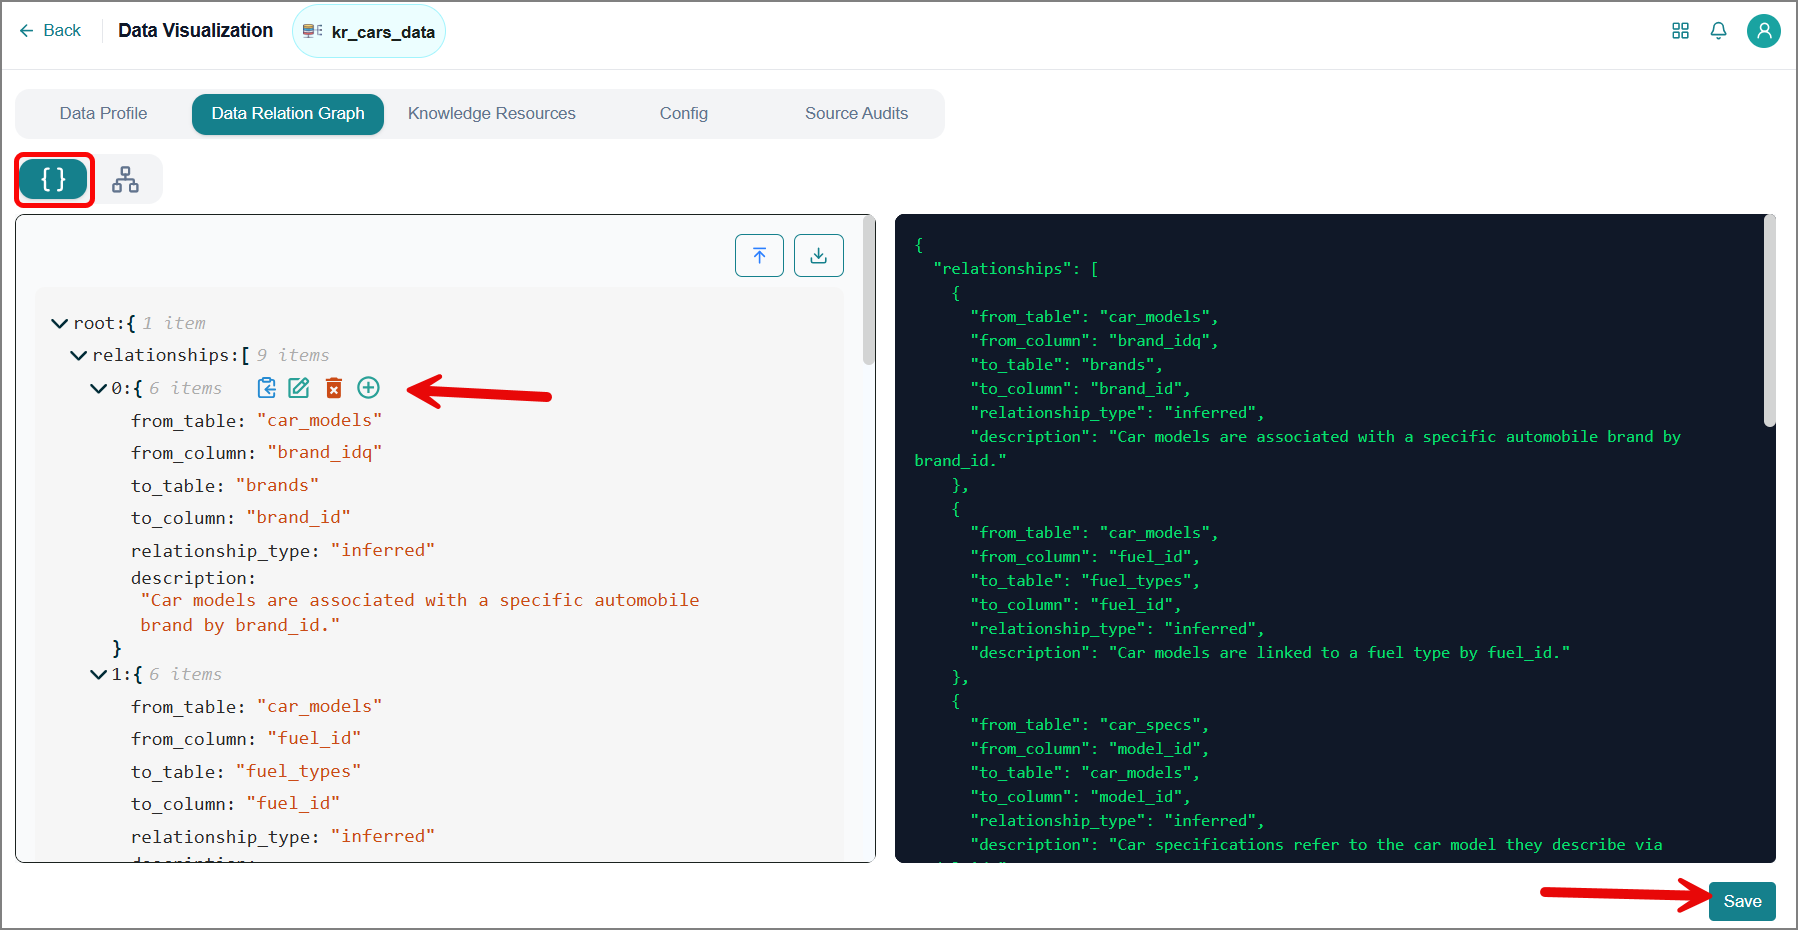
Click
 to download the JSON output to your local system.
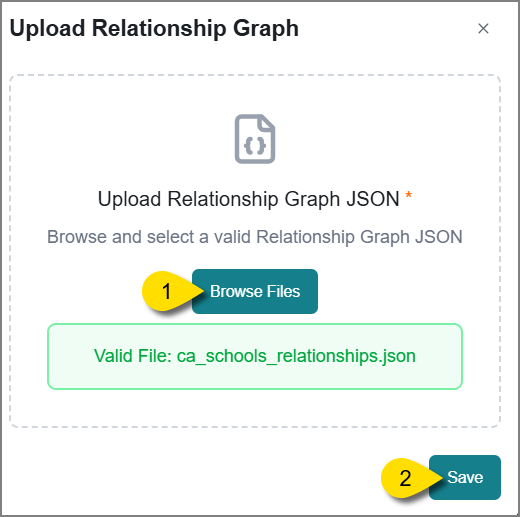
Click
 to upload a new or updated JSON file.
The Upload Relationship Graph window opens.
Click Browse Files to select a JSON file from your local system.
The file format is validated automatically.
Click Save to upload the file.
Once uploaded, a success message appears.
Use the Visual Editor panel on the left to directly edit the JSON code.
Hover over the panel to view the following icons:
Icon
Description

Click to copy the code to your clipboard.

Click to edit the code.
Click
 to confirm the edit.
Click
 to cancel the edit.

Click to delete the code.

Click to add a new relationship.
Caution
Changes to this code will affect the table's relationships and the graph view.
Click Save to confirm your changes.
Once saved, a success message appears.
Viewing a Knowledge Resource
Knowledge Resources are trusted, business-approved reference materials that support agents when answering your questions in a KB. The platform stores each resource type separately and makes it available to agents whenever they process a question against that KB.
Golden SQL tab – Displays validated natural-language-to-SQL pairs stored against the KB.
Instructions tab – Displays KB-specific prompt instructions. When processing your questions, agents refer to these proven queries and instructions rather than generating new SQL statements, resulting in more consistent and reliable results across your KBs.
Glossary upload – A structured resource for mass-updating table and column metadata in a source, so agents use consistent, business-approved terminology.
Golden SQLs
A Golden SQL is a validated natural-language question paired with its trusted SQL answer. Together, these combinations define the authoritative logic behind your metrics, reports, and dashboards.
Note
Queries promoted as Golden SQL from the Data Analyst Agent are automatically available here.
To upload golden SQL manually:
Go to the desired connection and click the Ellipsis
icon to view additional options.Click View Metadata.
Switch to the Knowledge Resource tab.
The Golden SQL tab is displayed by default.
Click Import Knowledge Resource.
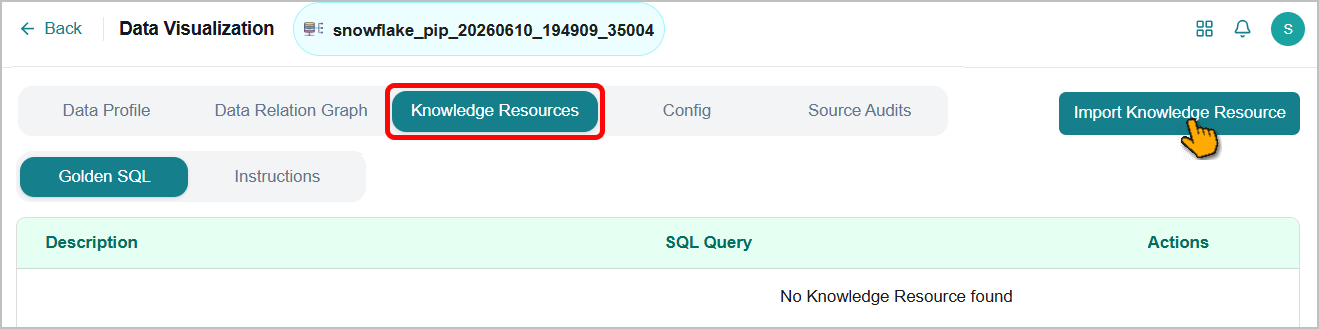
The Import Knowledge Resource window opens.
Hover over the info
icon and download the template file in CSV format for easy reference.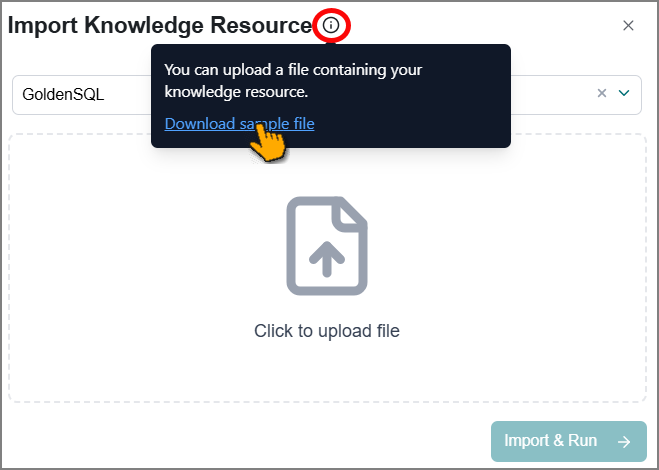
Use the template to create business-specific natural-language question-SQL combinations as a data resource, then store them on your local system.
Choose the Golden SQL option.
Click Upload File to browse to and select your GoldenSQL file on your system.
Click Import & Run.
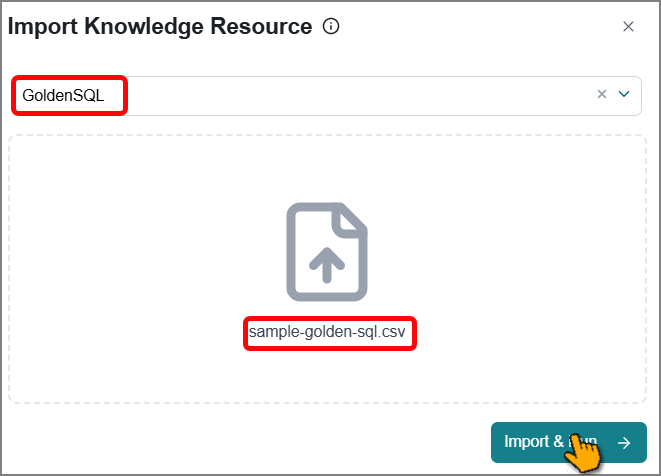
The platform reads your file and imports GoldenSQL data. Likewise, you can upload multiple files.
Managing Golden SQLs
The platform allows you to review and manage GoldenSQL data as needed in the Golden SQLs tab.

Upload multiple GoldenSQL files; newly added ones will be appended.
Remove GoldenSQL's data from the list.
To remove a GoldenSQL:
Click the Delete
icon.The confirmation dialog box opens.
Read the warning carefully, then click Yes to confirm.
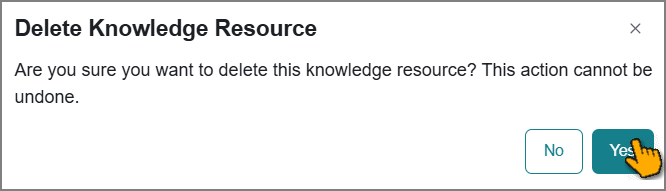
The GoldenSQL data is removed from the list.
Prompt Instructions
The Instructions tab in a Knowledge Resource lets you create and manage instructions (prompts) that are specific to a knowledge base. These instructions provide an AI agent with additional context about the knowledge base, such as its purpose, content scope, or preferred response format.
Whenever an agent references this knowledge base, the platform sends both the agent's master prompt and the KB-level instructions to the agent together. This combined input helps the model generate responses that are more accurate, relevant, and aligned with the knowledge base's content.
You can maintain multiple prompt versions, switch between them, and control which version is active at any time.
Important
Only the active prompt version is used when the agent processes queries against the KB.
Create an Instruction
When you open the Instructions tab for the first time, the prompt text box is empty. Follow these steps to create your first Instructions.
Enter your instruction in the text box, using plain, natural language.
Click AI-Powered Save.
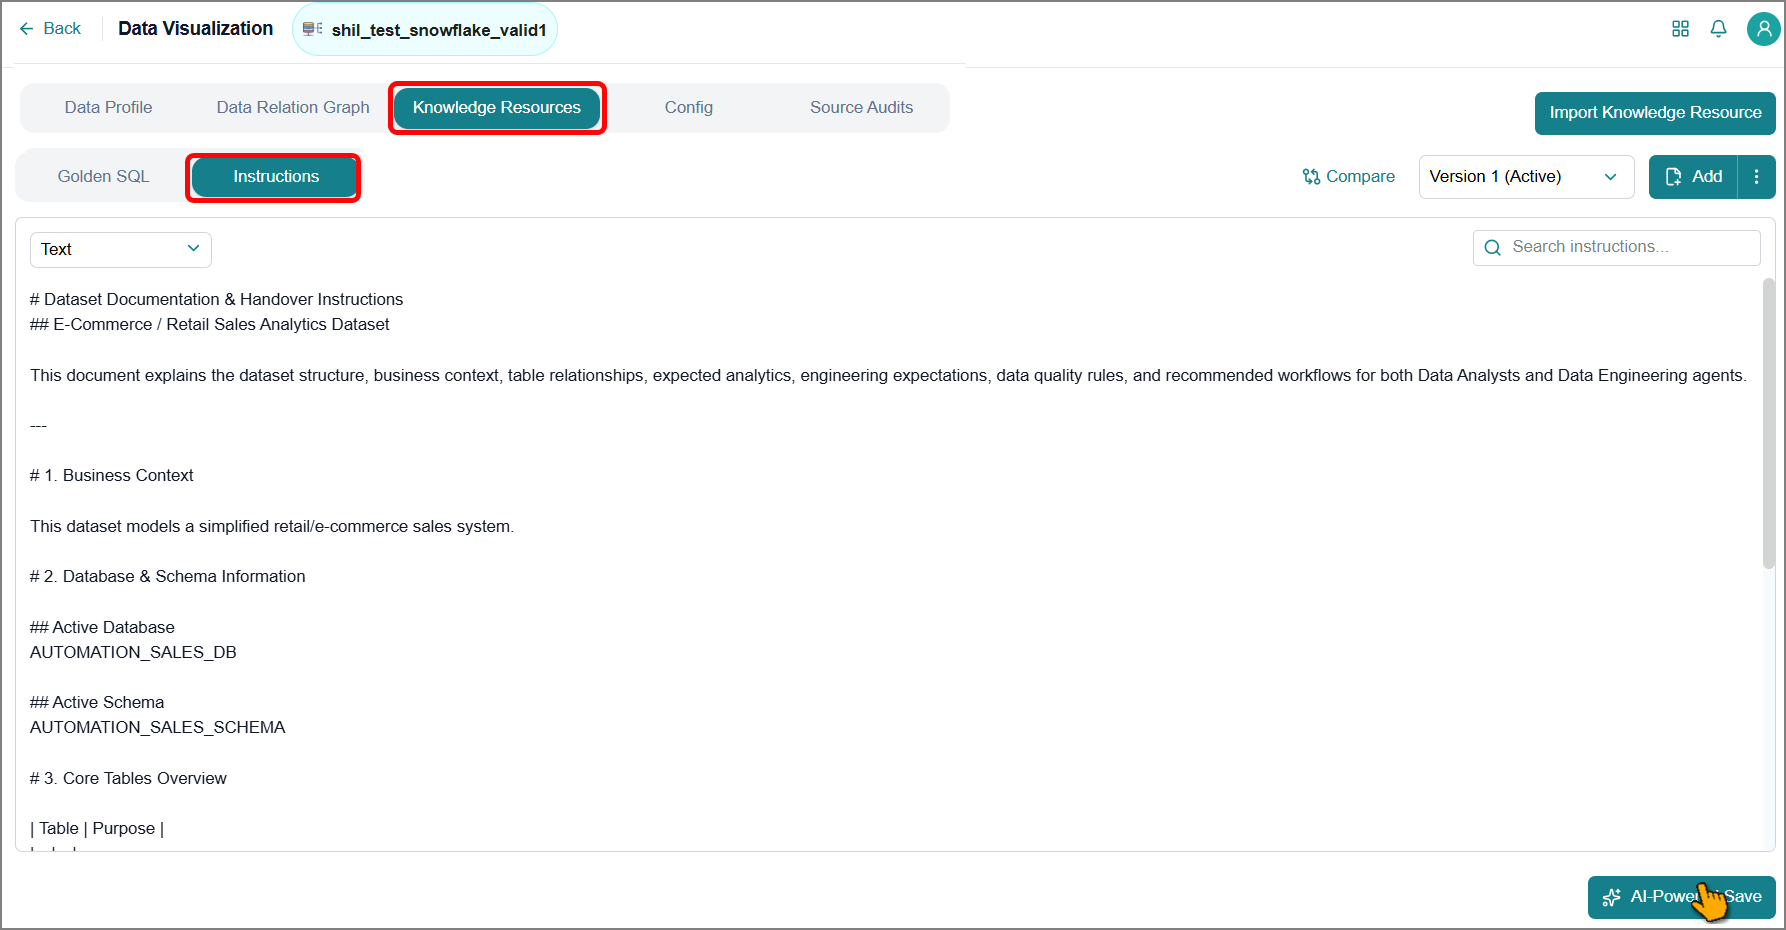
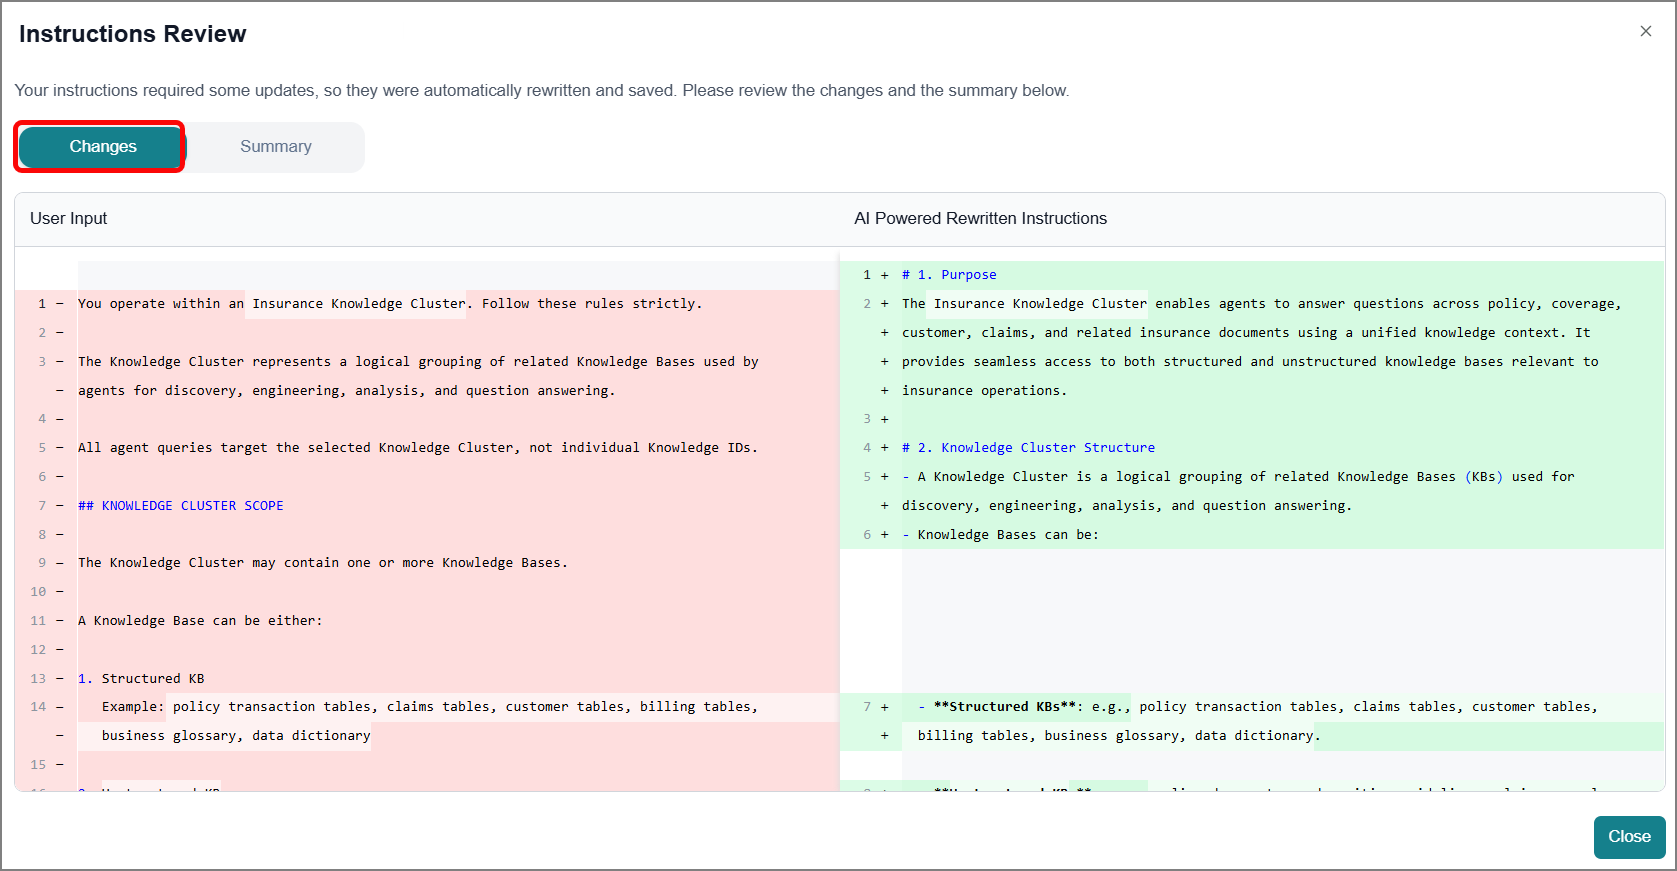
The Instruction Review window opens. The platform agent reviews the instruction you entered and rewrites it into a clearer, AI-ready version. This step improves the agent's ability to use your instructions effectively.
Review your instruction next to the agent-generated version on the Changes tab.
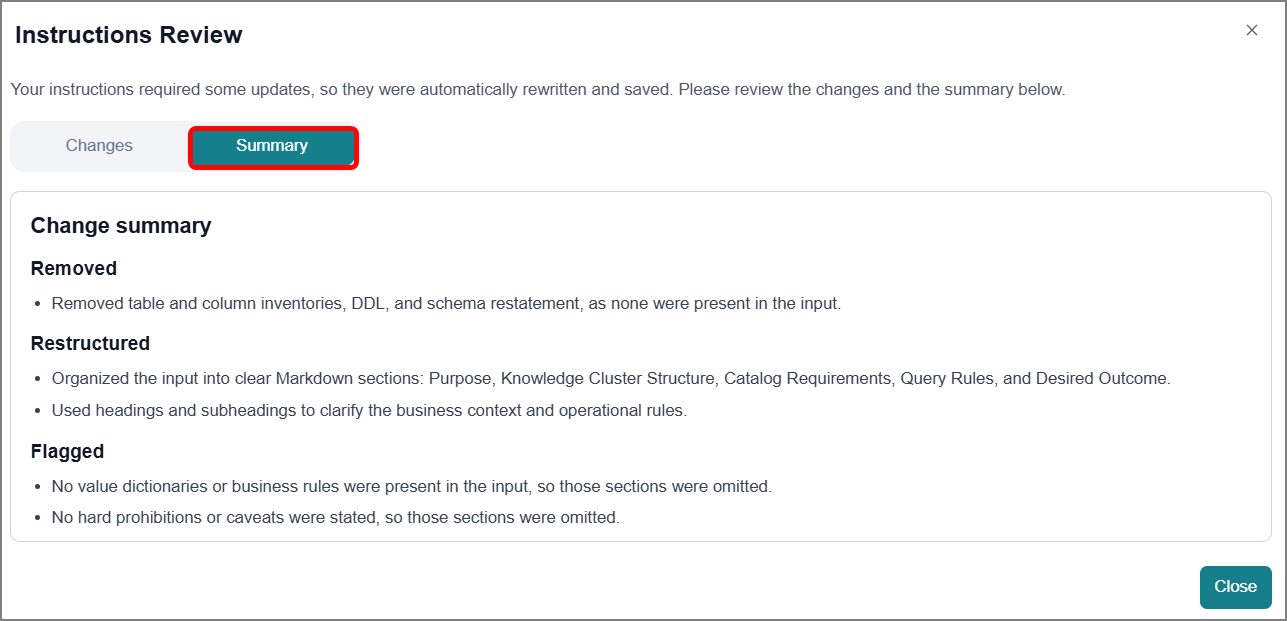
Click the Summary tab to view a summary of the changes the agent made.
Click Close to close the Instruction Review window.
You can update the AI-generated instruction, if needed.
From the dropdown, select Markdown to view your instruction formatted in Markdown next to the plain text.
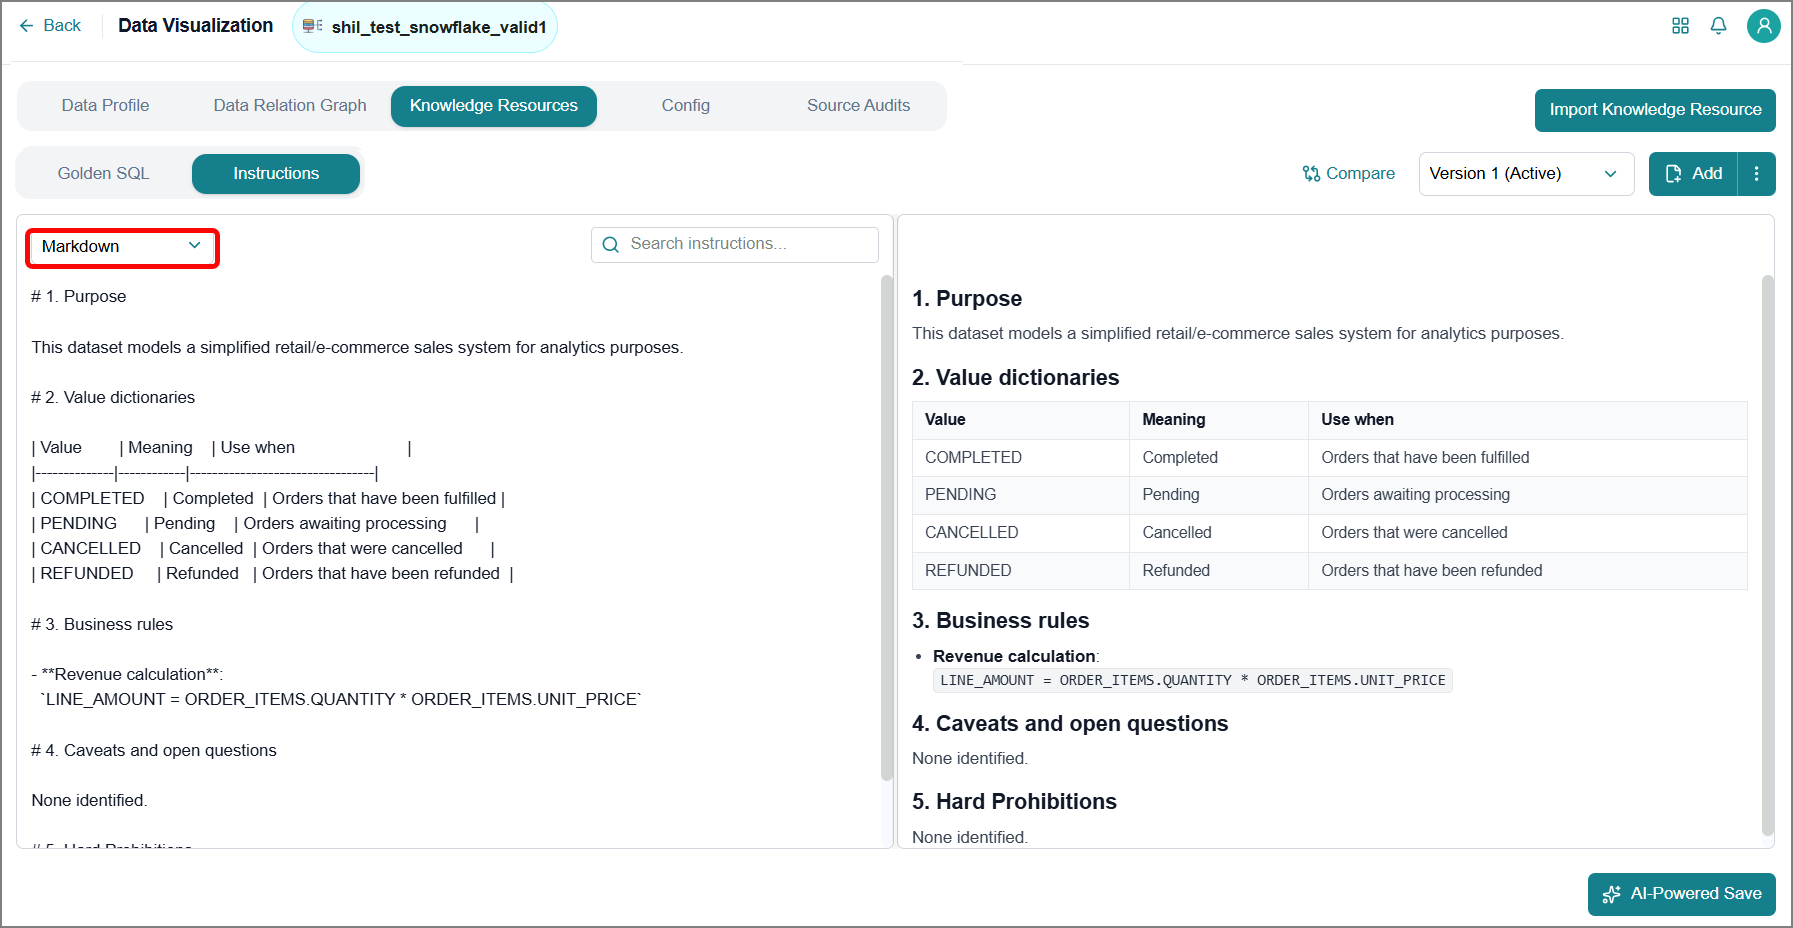
Use this view to quickly check that the formatting looks correct.
The instruction is saved as Version 1 and automatically set as the active instruction.
Create an Instruction Version
You can create additional instruction versions based on any existing version. To create a new instructions version:
Click Add.
The Create New Version window opens.
From the dropdown, select the base version you want to copy from.
To make this new version an active Instruction, enable the Make Active option.
Click Create.
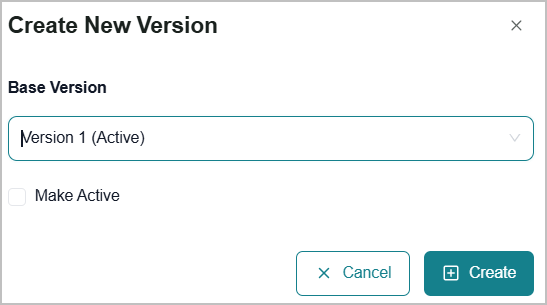
The new version is created from the base version you selected.
Edit the instruction text in the text box as needed.
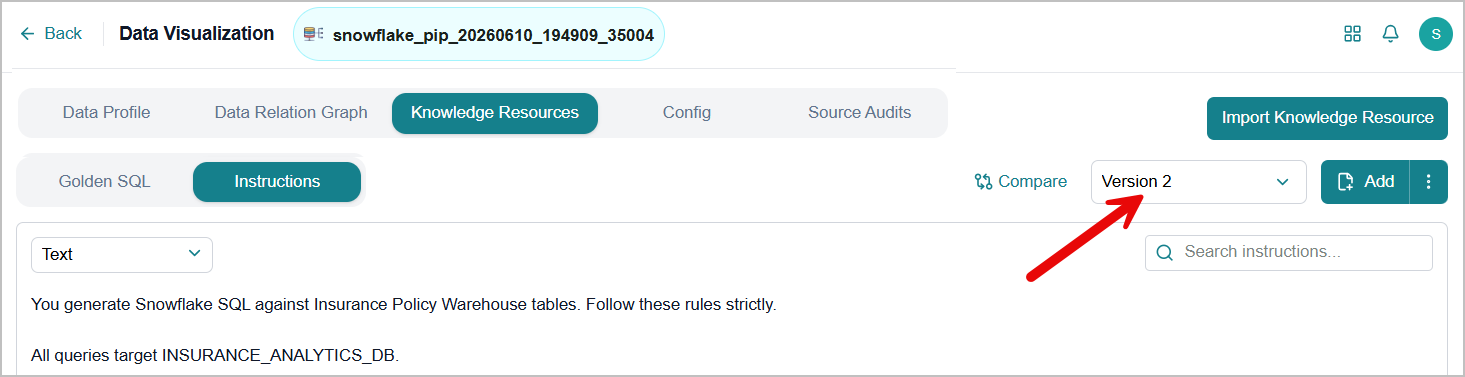
Select Markdown from the dropdown to render the instruction in Markdown alongside the plain text for quick validation.
Click Update to save the changes.
Compare Instruction Versions
The platform lets you review Instruction versions side by side, making it easy to spot differences and confirm which version best meets your needs before you activate one.
To compare Instruction versions:
Click Compare.
The Compare Versions window opens, displaying the active version alongside the currently displayed version.

Click the dropdown to switch between versions and compare the instructions.
Click X to close the window.
Set Instruction Version as Active
Only one instruction version can be active at a time. To change the active version:
From the version dropdown, select the prompt version you want to activate.
Click the Ellipsis
icon next to Add.Click Mark this Version Active.
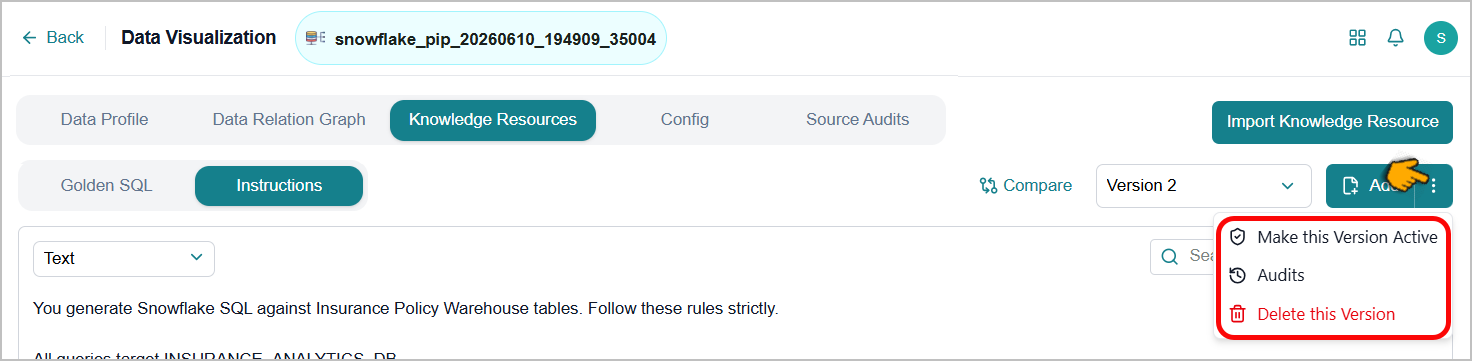
The selected version is now set as the active prompt.
View Instruction Audits
The platform keeps a complete history of every change made to a prompt instruction, including what changed, when it changed, and what events occurred.
To view instruction history:
Click the Ellipsis
icon next to Add.Click Audits.
The Instruction Version Audits window opens.
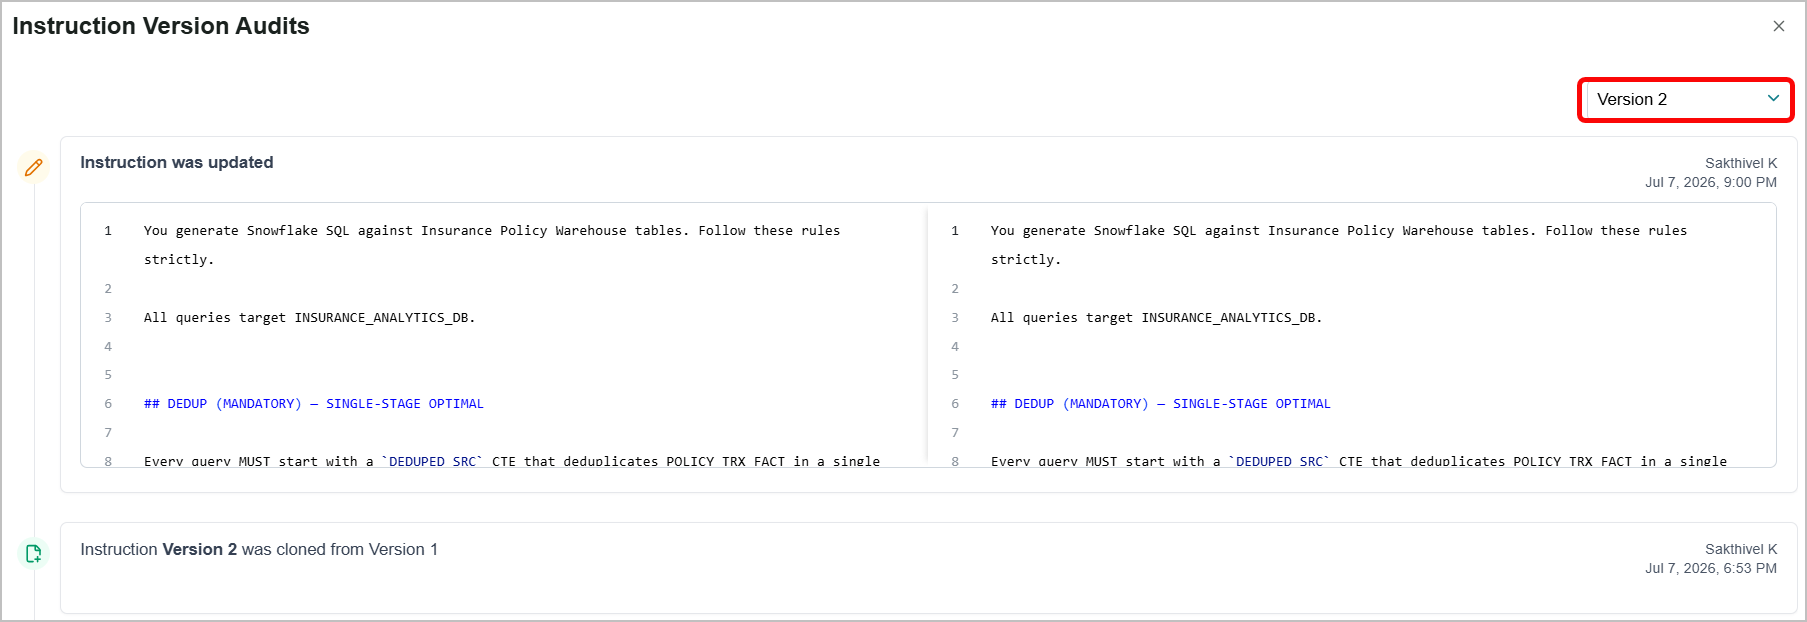
It shows a log of all saved versions of the instruction, along with the changes associated with each.
Select a version from the Version dropdown.
The audit log updates to display the change history for the selected version.
Delete Instruction Version
Note
You cannot delete the active prompt version. Set a different version as active before deleting.
From the version dropdown, select the prompt version you want to remove.
Click the Ellipsis
icon next to Add.Click Delete this Version.
The confirmation dialog box opens.
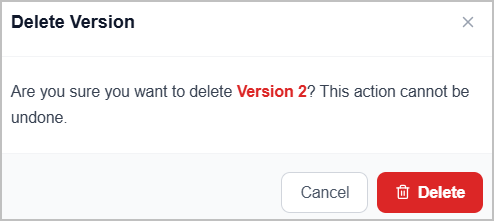
Click Delete.
The selected prompt version is removed from the list.
Bulk Updating Source Metadata
You can update table and column descriptions in a source all at once, instead of editing them one by one. This keeps your business terminology consistent, so agents use the approved names and descriptions your organization has agreed on.
To upload:
Go to the desired connection and click the Ellipsis
icon to view additional options.Click View Metadata.
Switch to the Knowledge Resource tab.
The Golden SQL tab is displayed by default.
Click Import Knowledge Resource.
The Import Knowledge Resource window opens.
Choose the Glossary option.
Hover over the info
icon and download the template file in CSV format for easy reference.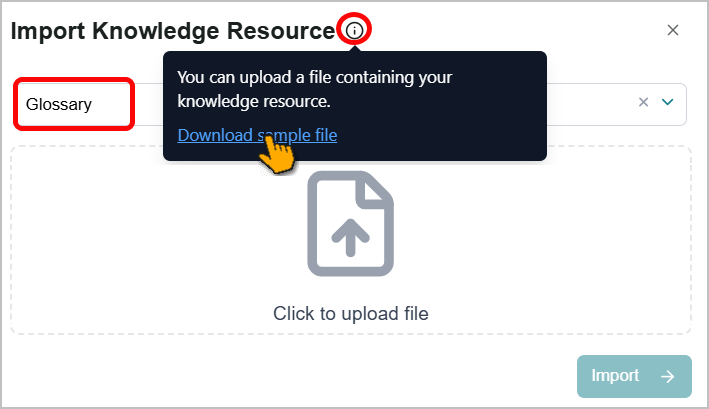
Use the template to update the table and column descriptions as a data resource and store them on your local system.
Click Upload File to browse to and select your glossary file on your system.
Click Import & Run.
The platform reads your file and updates the metadata of the source tables.
Exporting and Importing Configuration
The Export and Import feature lets you move a knowledge base's configuration between connections or environments. You can export tables, column descriptions, attributes, Golden SQLs, and instructions as a single file, then import that file into another knowledge base to quickly apply the same setup.
To access this feature, switch to the Config tab.
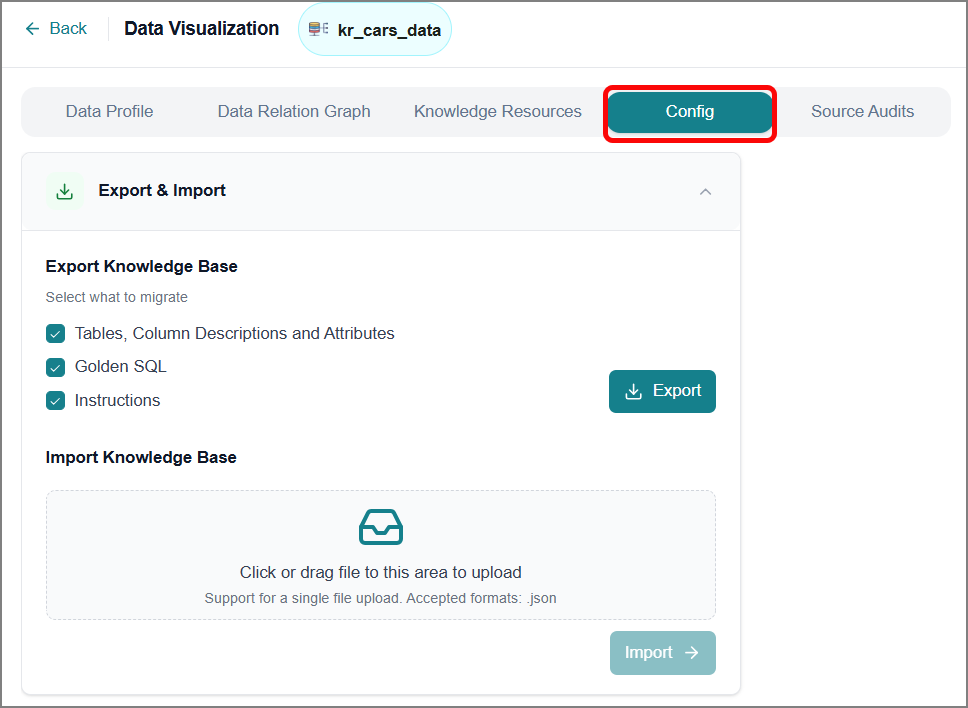 |
To export a KB configuration:
Select Export & Import to expand the panel if it is not already open.
Under Export Knowledge Base, select the checkboxes for the items you want to include:
Tables, Column Descriptions and Attributes
Golden SQL
Instructions
Select Export.
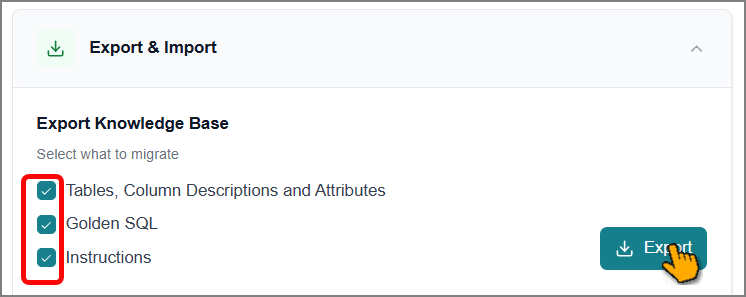
The platform generates a
.jsonfile containing your selected configuration and downloads it to your local system.
To import a knowledge base configuration:
Under Import Knowledge Base, select the upload area or drag your file into it.
Select the
.jsonfile you want to import.Note
The upload area supports a single file at a time.
Select Import.
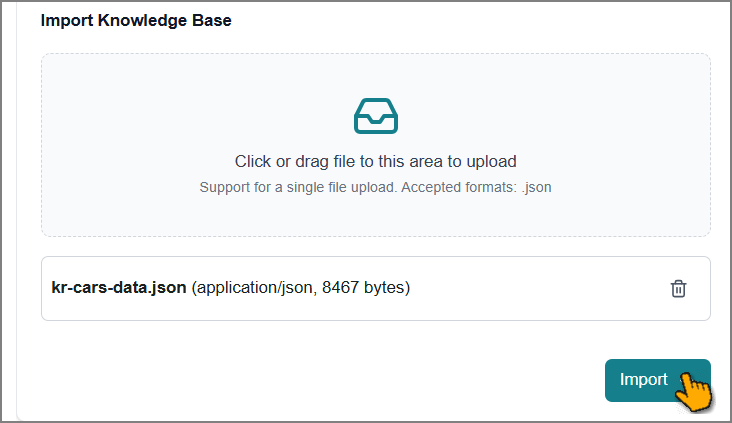
The platform reads the file, automatically matches the imported configuration to the target KB, and displays the results on the Import Knowledge Base page.
Select the Info icon to view additional details about how the mapping works.
Review the mapping results carefully. Select the table name from the dropdowns to update any mapping as needed.
Tip
This mapping confirms that your imported data aligns with the correct tables, columns, and resources in your target KB.
Click Apply Mappings.
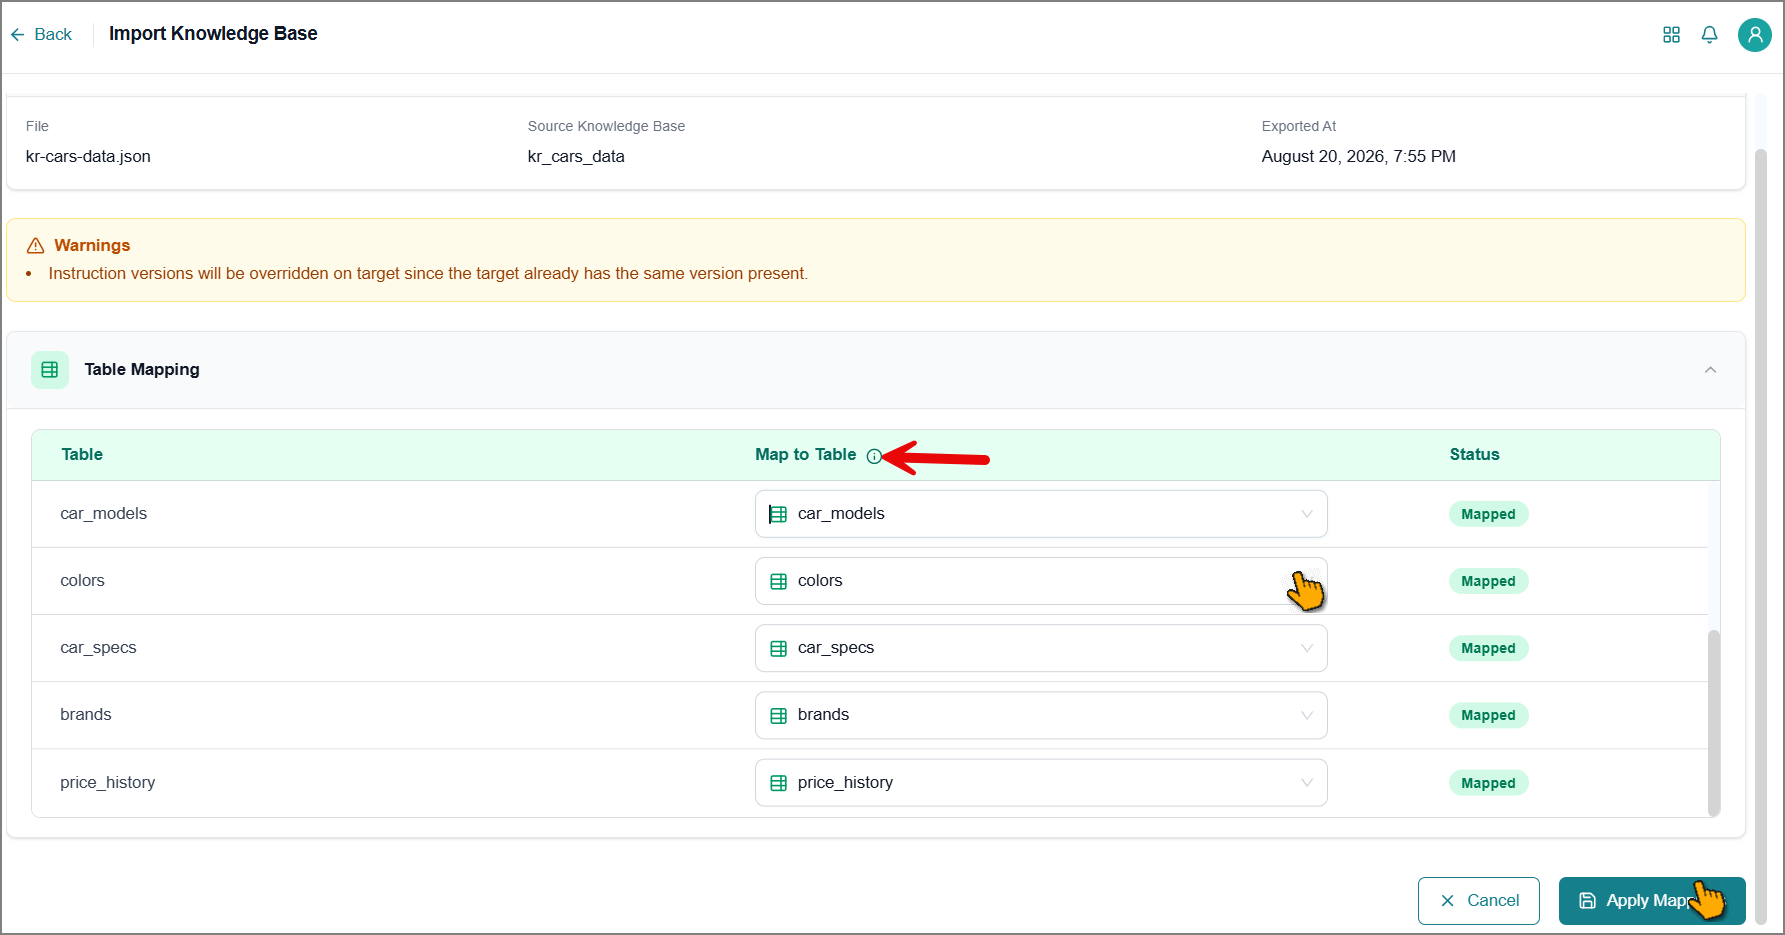
The platform applies the imported configuration to your knowledge base based on the confirmed mapping and displays a summary on the Import Report page.
Click Go to Knowledge Base.
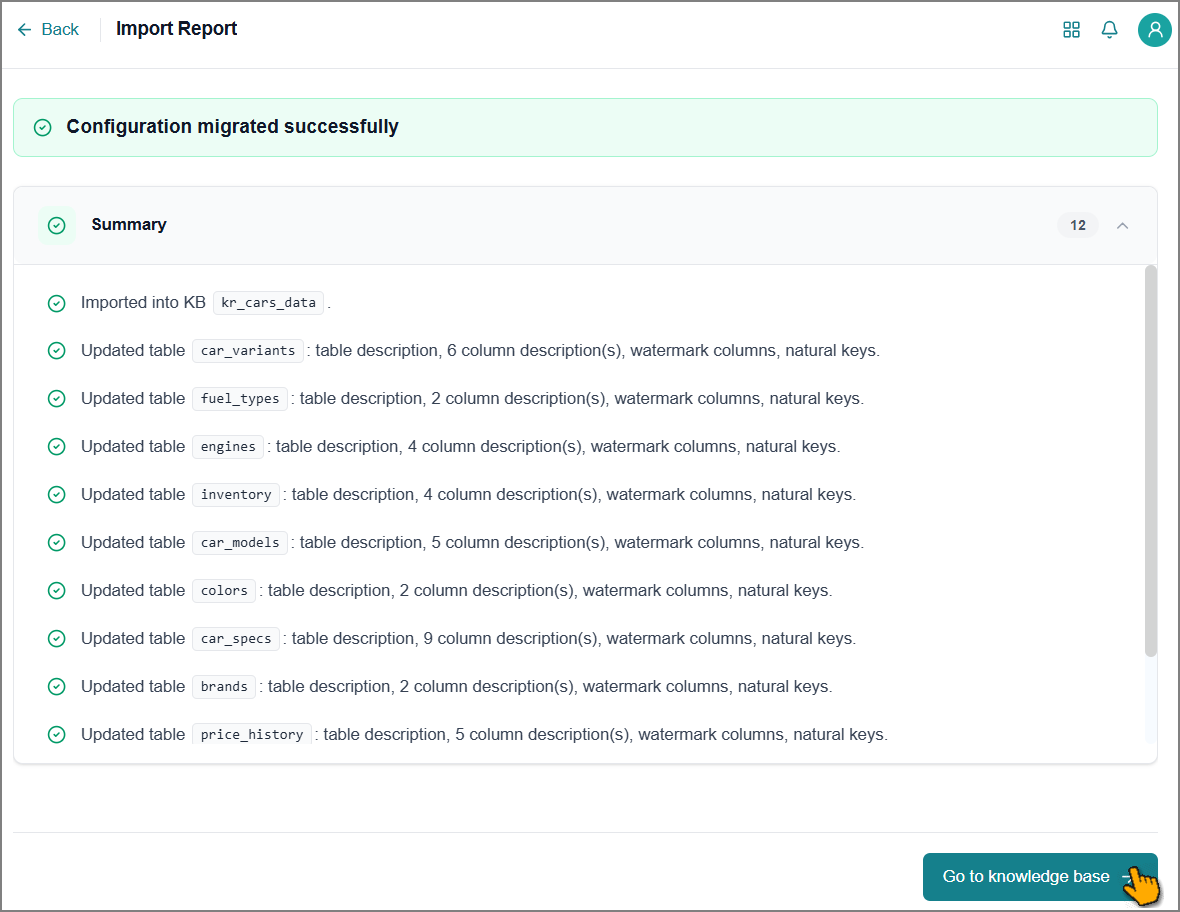
You return to the knowledge base, where the imported configuration is now applied.
Viewing Source Audits
The Source Audits tab records all changes to the KB source, allowing you to review and validate KB-level modifications. It supports change tracking and validation for administrators and technical users who maintain data source integrity across the platform.
Switch to the Source Audits tab. It displays a list of all KB-level changes, sorted with the most recent change at the top. Each entry shows the type of change and the date and time it occurred.
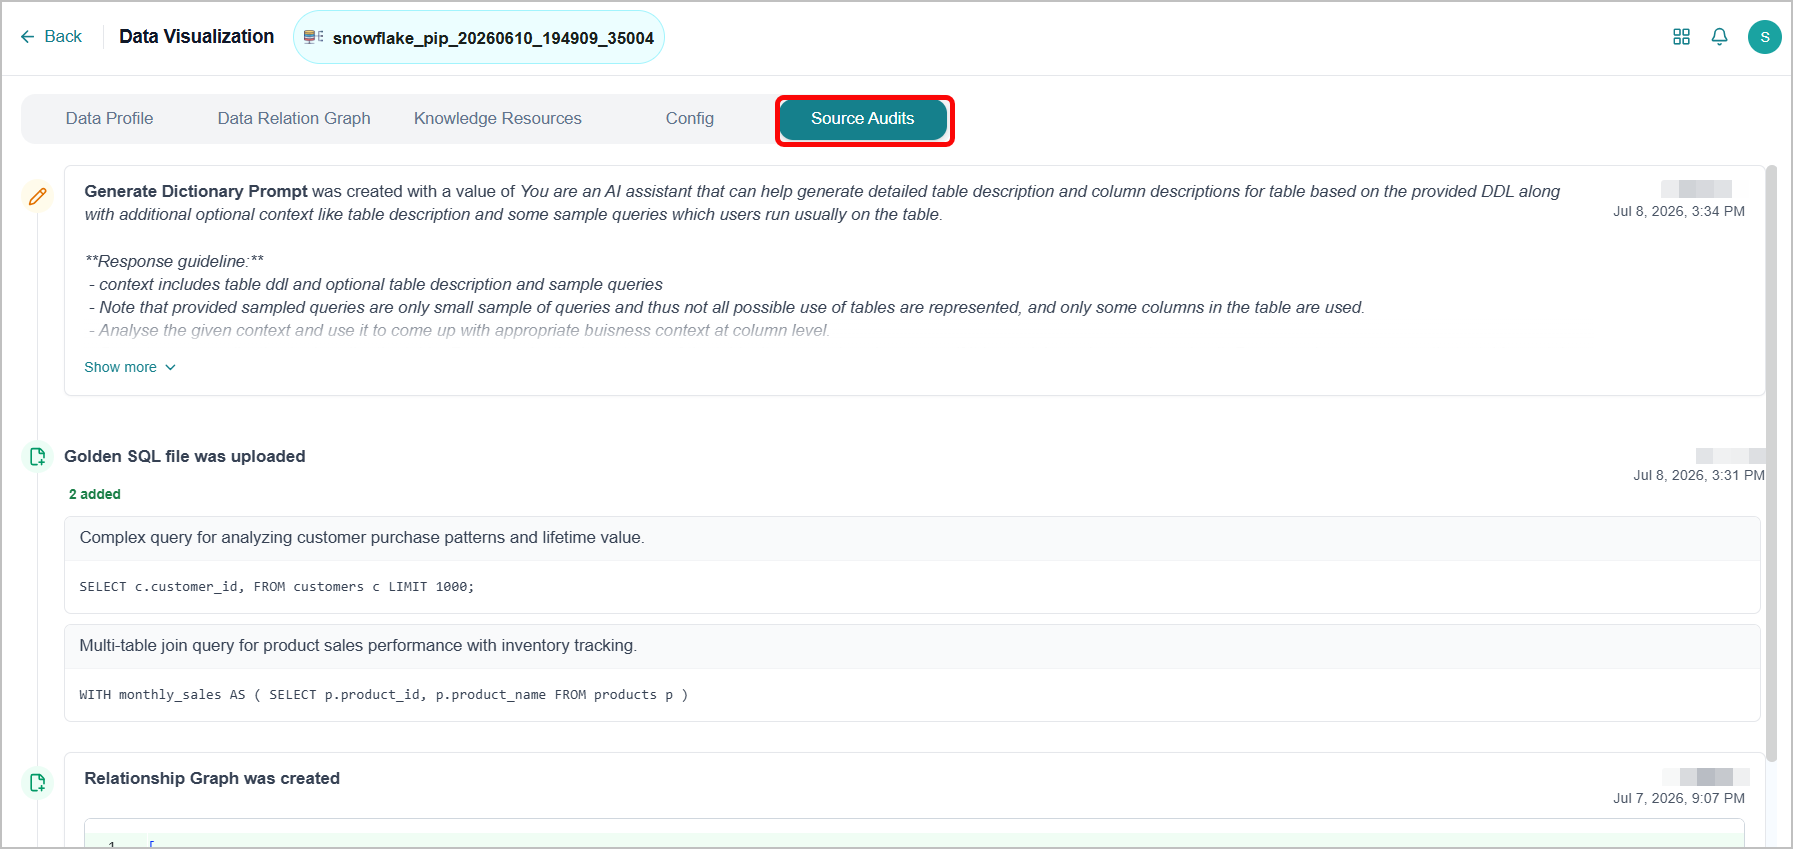
The tab records the following types of changes:
Source Creation - When a new source is added through the data ingestion page.
Metadata Edits - Updates to the source description, the Automatically Profile the Data setting, or the Automatically Generate Dictionary setting.
Data Relation Graph - Changes to how tables are connected to each other.
Golden SQL - Additions or updates to validated question-and-SQL combinations.
Table Deletion - When a metadata table is deleted through the data ingestion page.
Editing a Connection
You can edit existing source connection configurations to improve metadata retrieval accuracy and completeness.
To edit the connection:
Go to the desired connection and click the Ellipsis
icon to view additional options.Click Edit.
The Edit Metadata page opens in the side panel.
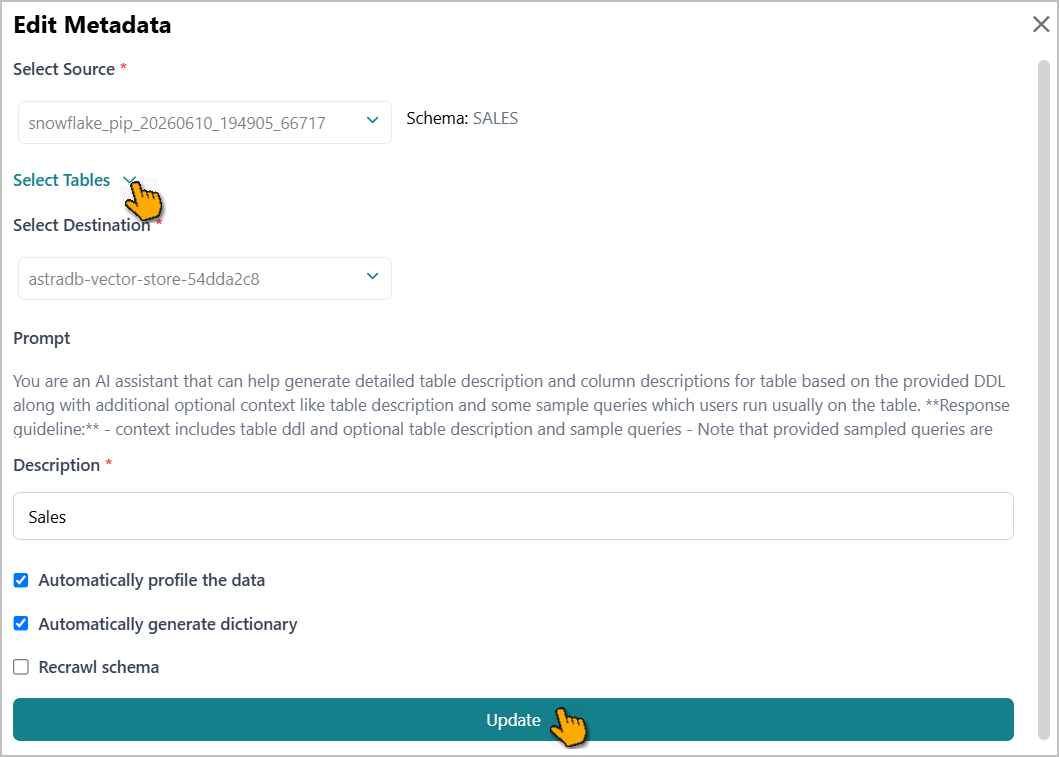
You can edit all configuration settings except the source and destination locations and the prompt.
To edit the settings, refer to the Creating a Connection section.
Select the required tables in the source to retrieve only their metadata.
Click Select Tables to expand.
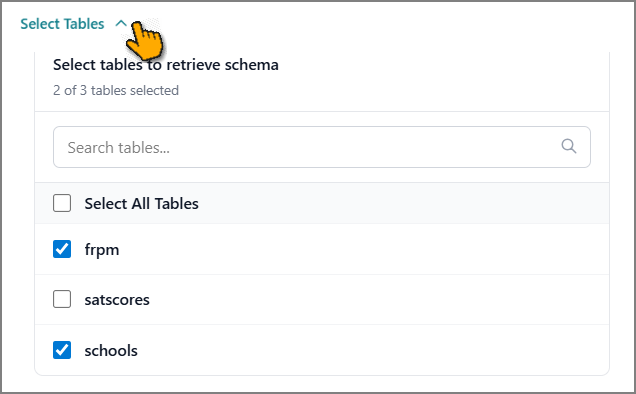
Select the check boxes for the required tables.
Enable the Recrawl Schema checkbox to refresh the selected schema, updating metadata and reflecting any recent changes in the source structure.
Click Update to save the configuration.
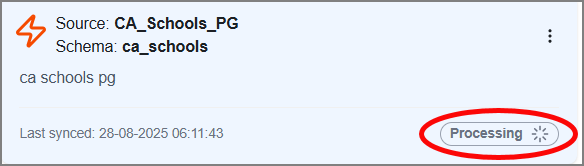
The platform will initiate a resync based on the updated settings. You can view the status on the card.
Upload Additional Data
You can upload additional data to the source location via the established connection.
To upload new data:
Go to the desired connection and click the Ellipsis
icon to view additional options.Click Upload New Data.
The Add Data page opens in the side panel.
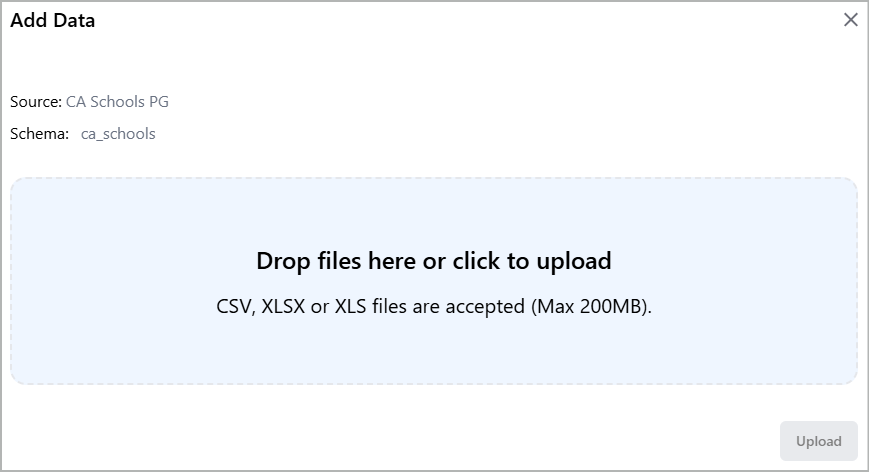
Drag and drop files onto this page, or click Click to Upload to browse and choose files from your local system.
Note
You can upload files in CSV, XLSX, or XLS formats.
The maximum allowed file size for upload is 200 MB.
Click Upload.
The platform sends the new data to the source system and makes its metadata available within the platform.
Deleting a Connection
You can delete any existing connection from this page.
Go to the desired connection and click the Ellipsis
icon to view additional options.Click Delete.
The confirmation message appears.
Click Delete to confirm.
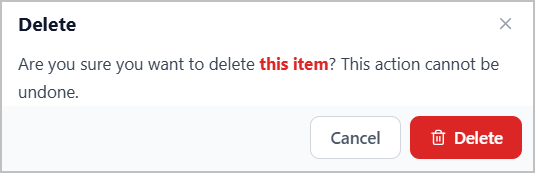
The connection is removed from the list.