Agent SDK
Agent SDK is where you build, manage, and operate AI agents. An agent is a configured AI process that executes tasks, accesses knowledge, and interacts with external systems on behalf of your users. The Agent SDK covers the full agent lifecycle: from initial build and testing through ongoing monitoring and optimization.
Key Capabilities:
Create and configure agents using the Agent Builder or Copilot Agent Builder.
Build and manage reusable Agent Skills.
Run Agent Evaluations to measure performance against curated test scenarios.
Monitor agent activity via the Agent Health Dashboard and execution logs.
Optimize agents through prompt refinement and SLM fine-tuning.
Create application interfaces to surface agent outputs to end users.
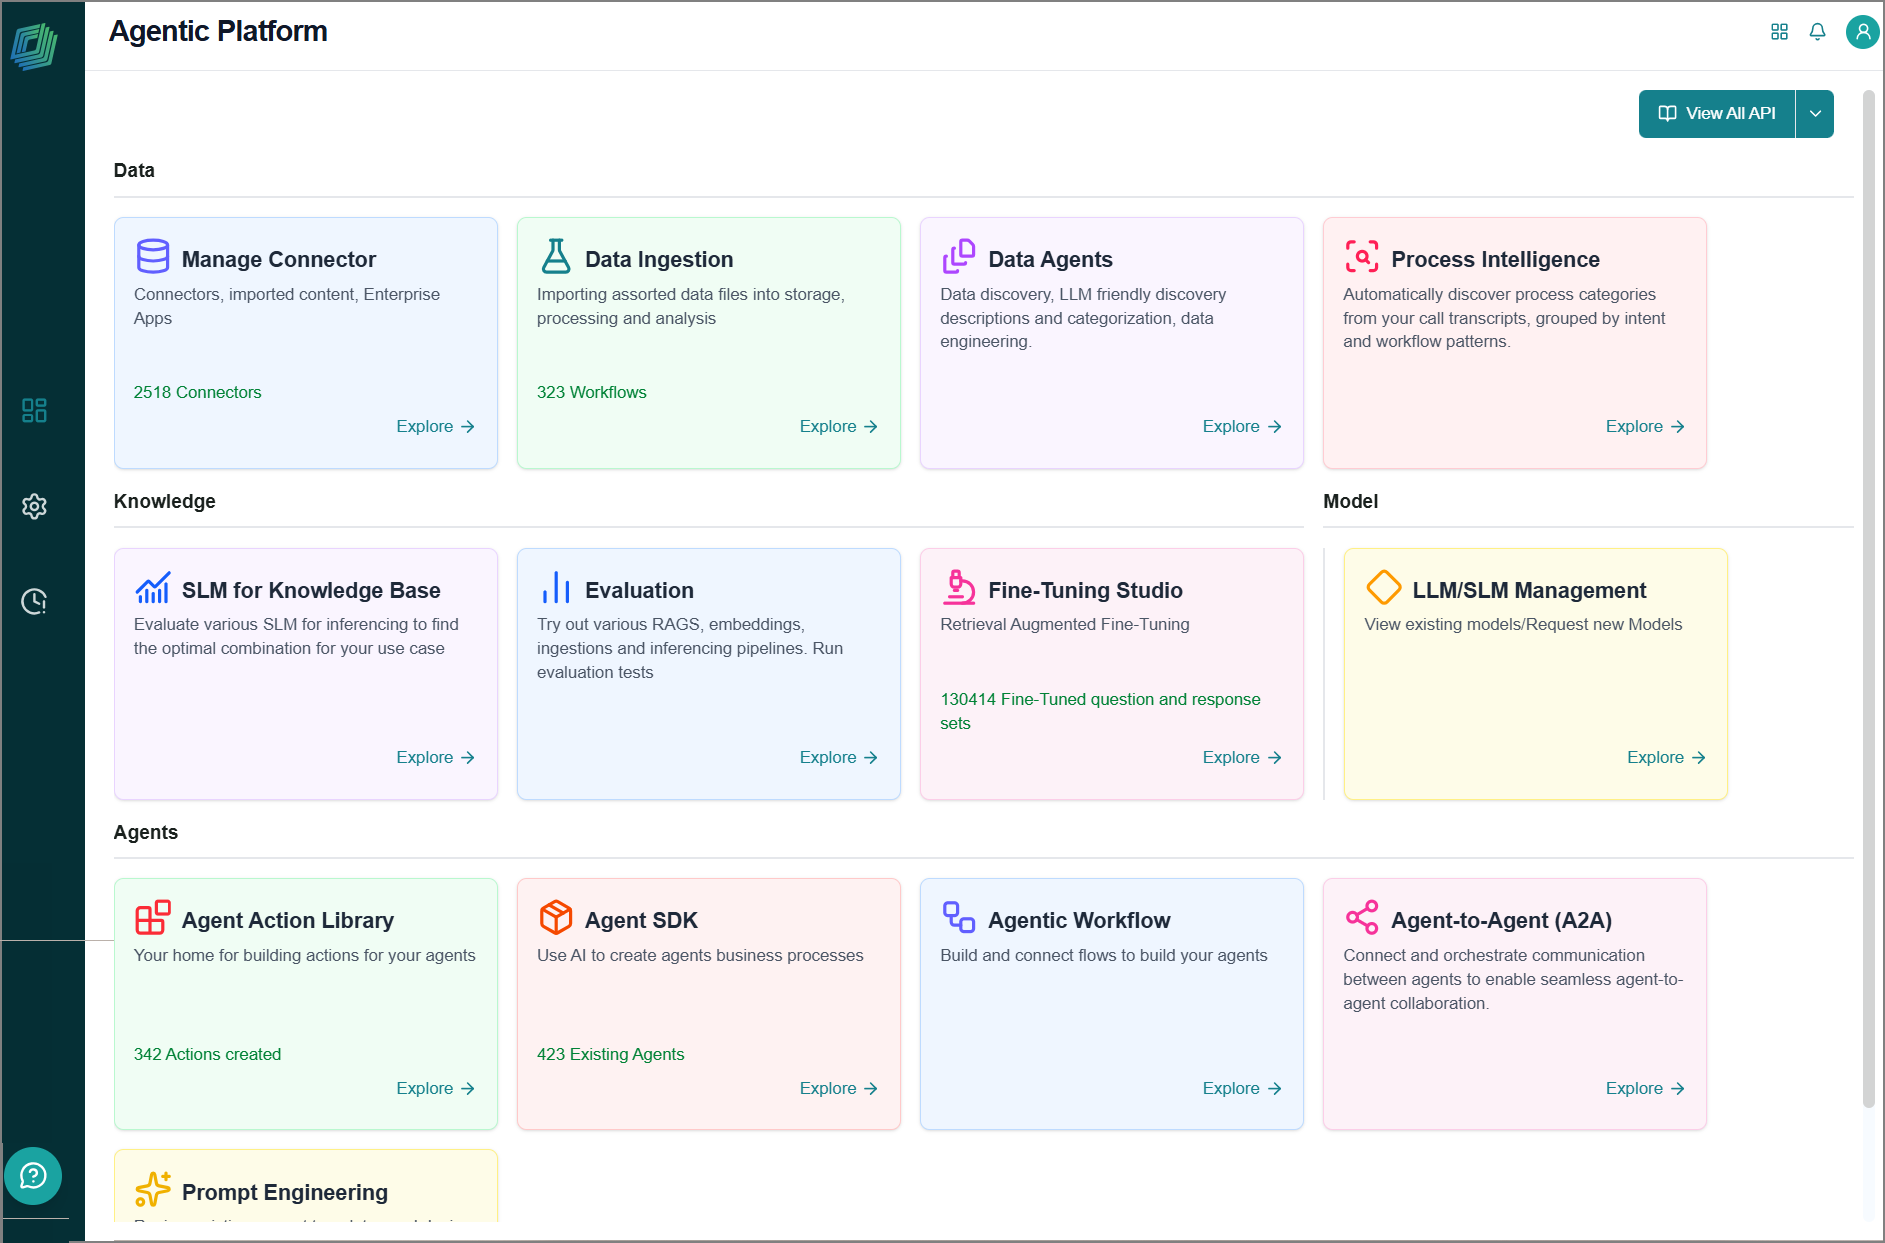
To access this page, go to the home page > Agents > Agent SDK.
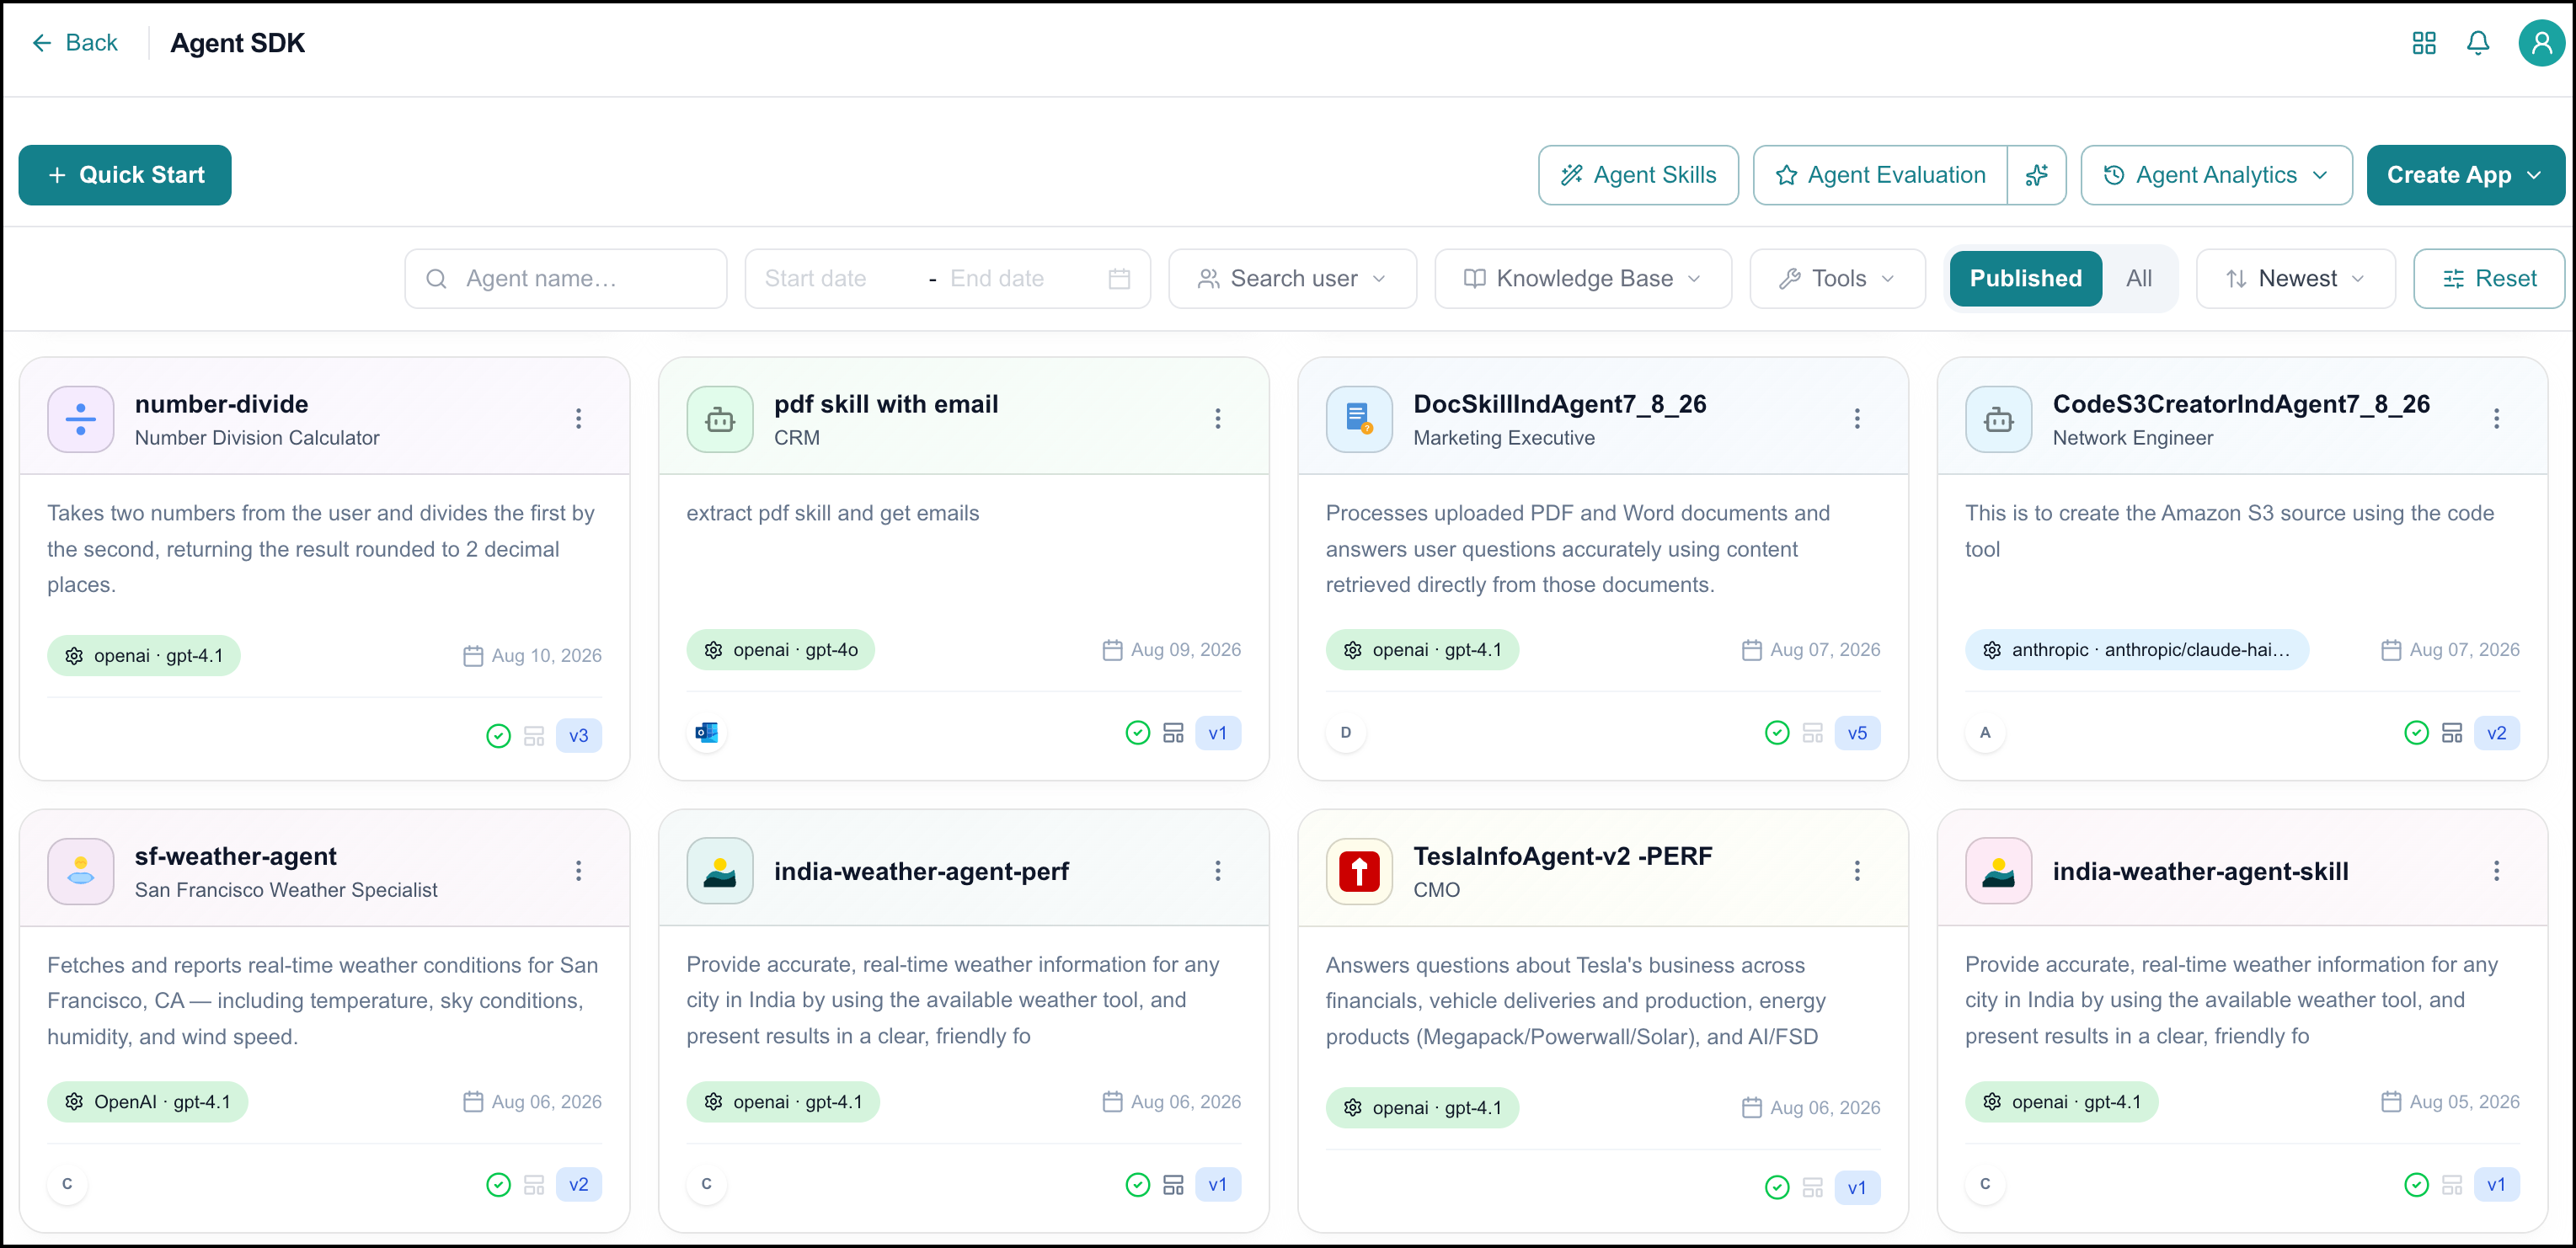
The Agent SDK page opens and displays a default list of widely supported agents. This allows you to quickly review, manage, or extend existing agent configurations.
Tip
Auto Coder Agent is a default agent that generates dynamic code based on user queries and provides valuable responses. It can be integrated with supervisor agents to handle their requests.
Creating an Agent
The Agent SDK page allows you to create agents in two ways:
Build manually (fill out a form, manually configure)
Start with AI (use the Copilot Agent Builder, which is conversational, AI-assisted)
For most use cases, the BAIC Copilot Agent Builder is the best choice. Simply describe your agent's purpose in plain language, and the platform handles the configuration for you. It will even generate and save test cases, create an icon, and write a description for your agent. If you need precise control over settings such as model selection, hooks, long-term memory, temperature, or task configuration, and want to specify all aspects of the agent yourself, use the Agent Builder to configure your agent manually.
Once you have created an agent, you can use Agent Evaluation to evaluate its performance against curated test scenarios and measure real outcomes, such as task completion rates, output quality, correctness of tool usage, and performance.
Build an Agent Manually
To create an agent manually using the Agent Builder:
Go to the home page > Agents > Agent SDK.
The Agent SDK page opens.
Click Quick Start.
The Quick Start window opens.
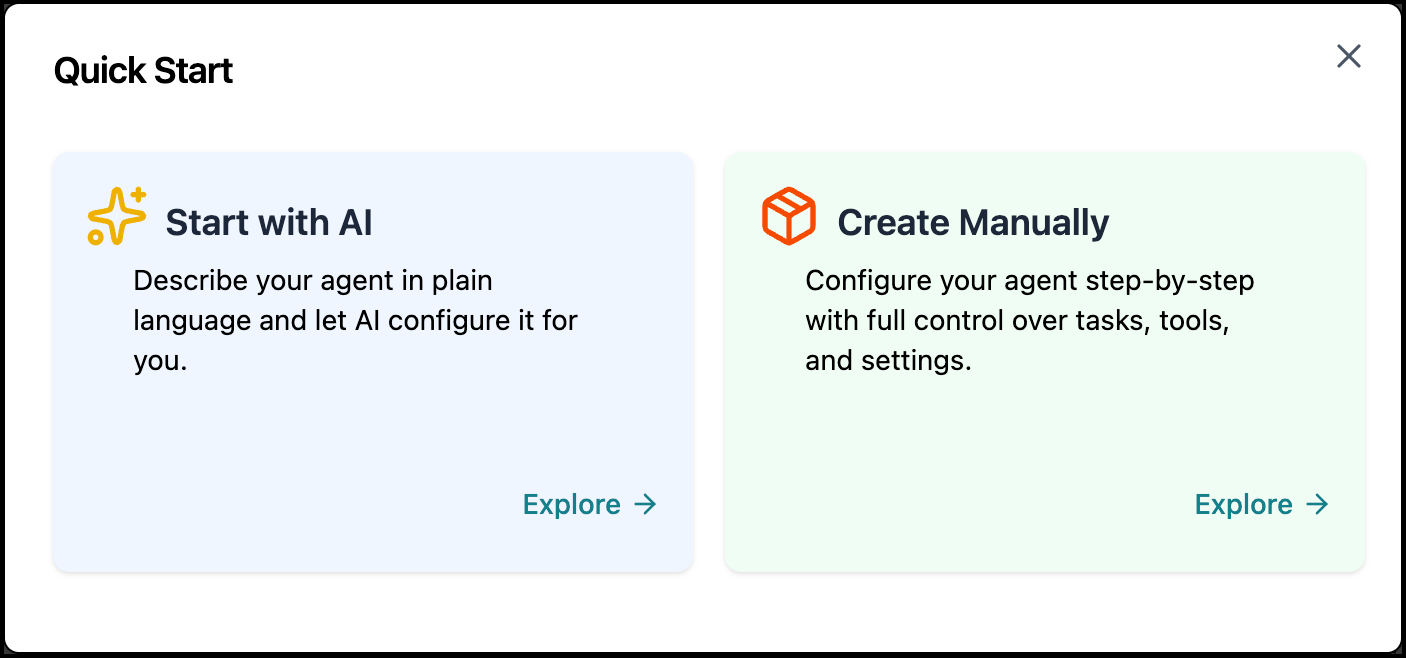
Click Create Manually.
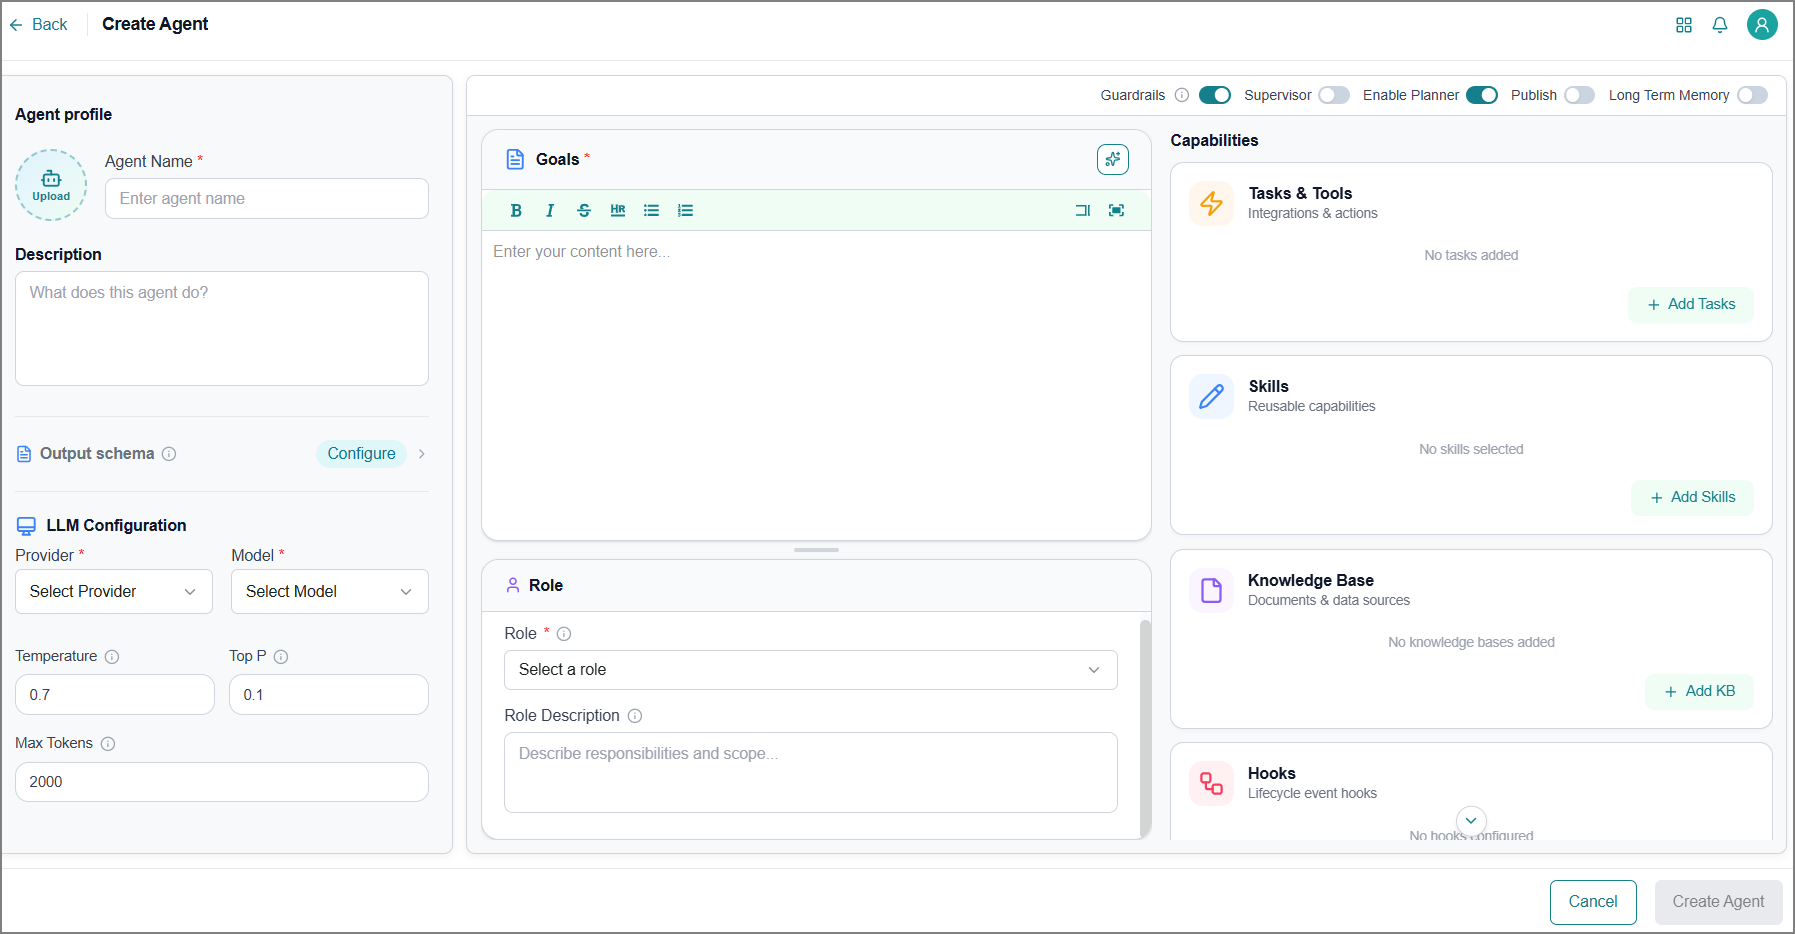
The Create Agent page opens.
Field
Description
Agent Profile
Upload Icon
Define an avatar or icon for your agent. Refer to Upload an Icon for more information.
Agent Name
Enter a name for the agent.
Description
Describe the agent in detail, including relevant background.
Output Schema
You can define the Create Output Schema basis on which the agent will respond to user queries.
LLM Configuration
Provider
Choose an LLM provider from the dropdown.
Alternatively, select SLM to tag fine-tuned SLM models from the Business AI Cloud's Knowledge Layer.
Model
Choose the desired model from the dropdown.
Temperature
Enter a value between 0 and 1 to control the creativity of the model’s responses.
Use higher values (e.g., 0.7-1.0) to produce more diverse and creative outputs.
Use lower values (e.g., 0.1-0.3) for more predictable, focused results.
Top-P
Enter a value between 0 and 1 to limit the probability space used for word selection.
A lower Top-P (e.g., 0.1–0.3) restricts output to high-probability words.
A higher Top-P (e.g., 0.8–1.0) allows a broader range of possibilities, promoting more varied responses.
Max Tokens
Enter the maximum number of tokens (words and characters combined) the model should generate in its response. This helps control response length.
Goals
Click the Prompt
 icon to import a predefined prompt. Refer to Prompt Gallery to import details.
Alternatively, enter prompts instructions based on the agent's intended behavior. Use the text box tools for quick work.
Role
Choose a predefined role from the dropdown.
The role defines what the agent does and its area of expertise.
Role Description
Describe the agent's role in detail, including relevant background, experience, and perspective.
Guardrails
Enable this option to run automated safety and compliance checks on every interaction with this agent. Guardrails inspect both the prompt sent to the agent and the response sent back to the user, flagging content such as prompt-injection attempts or sensitive information. Click the Info
 icon to view the Guardrail Category List.
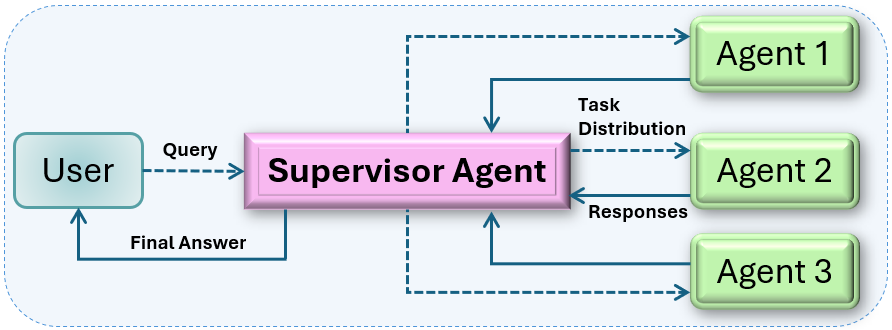
Supervisor
Enable this option to create a supervisor agent that handles complex problems by coordinating task management through specialized sub-agents.
When enabled, the supervisor agent coordinates multi-agent workflows. The supervisor receives requests, analyzes requirements, and delegates tasks to specialized sub-agents.
Enable Planner
Enable this option to break down complex tasks into steps and create execution plans in advance.
Publish
Enable this option to share the agent with your account. If not enabled, only you will be able to access the agent.
Long-term Memory
Enable this option to allow the agent to remember key facts and user preferences across separate sessions. Unlike short-term memory, which is limited to the active session, long-term memory persists between conversations. For example, if a user mentions their manager's name or how they prefer responses formatted, the agent can recall that information the next time it is invoked.
When enabled, the agent automatically extracts facts and preferences from each conversation and stores them for future use. At the start of each execution, the agent loads relevant memories into its context using semantic search.
Memory is stored at the user level rather than the agent level, meaning it is shared across all agents that have long-term memory enabled for that user. For example, a fact captured during a conversation with one agent can be referenced by another enabled agent. When you enable this option, a confirmation message reminds you that memory is shared across agents.
Published agents have this feature enabled for any user who uses them.
Capabilities
Tasks/Tools
You can Add Tasks/Tools that have been preconfigured to extend your agent's functionality.
Skills
Switch to the Skills tab to add new skills to the agent.
Adding Skills enables the agent to read attachments and extract their content to answer user queries.
Knowledge Base
Switch to the Knowledge Base tab to add KBs to the agent.
Adding Knowledge Bases enables the agent to access specific information, resulting in more accurate, context-aware responses.
Hooks
You can add hooks to inject context, run integration actions, or invoke other agents at key points in the agent's lifecycle. Hooks fire automatically at the event you configure: at the start of or after a session, before or after each agent response, or before or after each tool call. Refer to Adding Hooks for the configuration steps.
LInked Agents
Switch to the Agents tab to Add Sub-agents.
Applicable for the Supervisor agent only.
Note
Mandatory fields are marked with
 .
.Click Create Agent.
The new agent is created with a success message and is ready for execution. Refer to Interacting with AI Agents to use this agent.
Upload an Icon
All new agents are tagged with a default icon. You can keep the default icon or update it.
To update the agent icon:
Click the Icon next to Agent Profile .
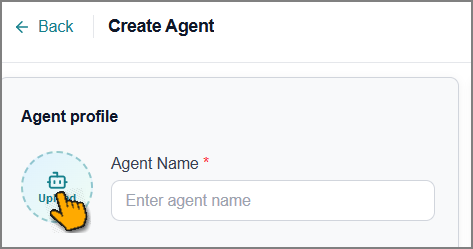
The Choose an Icon window opens.
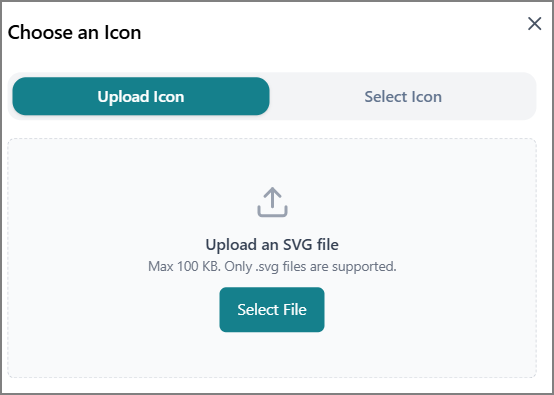
Choose one of the following options:
Upload Icon tab - Click Select File to choose a file to upload.
Notice
The file must be in SVG format, with a maximum size of 100 MB.
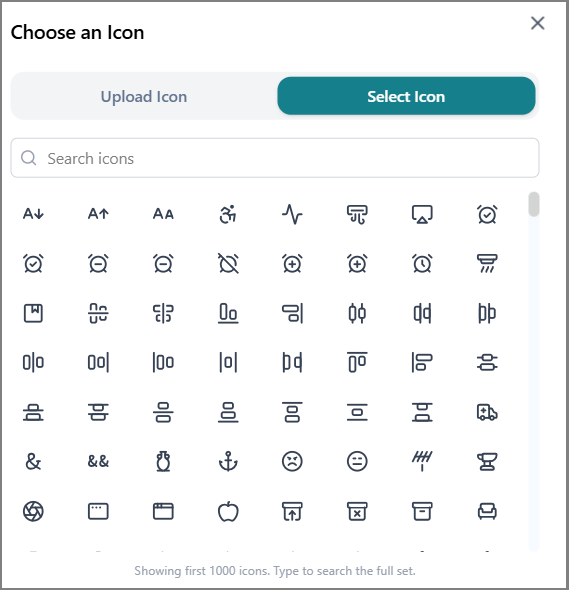
Select Icon tab: Choose any one of the available icons to add.
Create Output Schema
When you create an agent, you choose how it formats its responses. You can keep the output as readable text, or define a structured JSON format so the response is easy to parse and use in downstream systems.
To set up an Output Schema:
Click Configure.
The Output Schema panel opens from the right.
Select the required Output Format:
Markdown - The agent's output is returned in standard markdown format.
JSON - The agent's output is returned as structured JSON, in a format you define or have the platform generate automatically.
If you select JSON, choose how to define the structure:
Auto-generate the structure - Turn on JSON Schema.
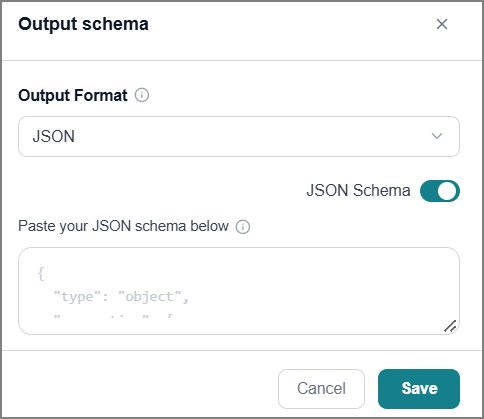
If the JSON box is empty. The system generates a structured output format that matches your task description.
Alternatively, you can manually define the JSON schema in the text box. The system follows the schema you provide.
Define the structure manually: Enter the required keys and their corresponding values based on the output you want.
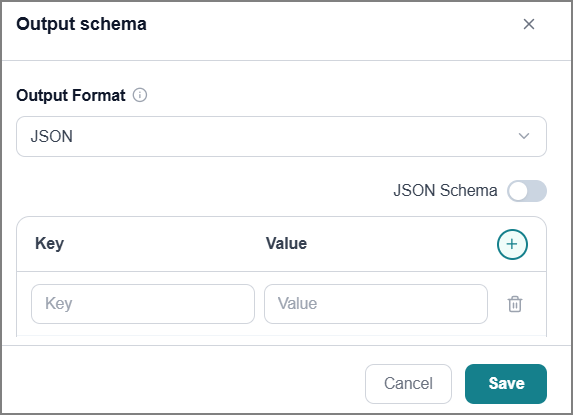
Click the Add
 icon to add more key-value pairs, if needed.
Click the Delete
 icon next to any pair you want to remove.
Click Save to store the configuration.
The agent is saved with your chosen output format, and it returns responses in that format.
BAIC Copilot Agent Builder
Using the Copilot Agent Builder is as simple as entering a description of the agent you want to build. This starts an iterative conversation in which the agent builder asks clarifying questions to establish the right role, tone, and scope for the new agent. The Copilot builder supports configuring and managing supervisors, sub-agents, and standalone agents.
During the build process, the agent builder automatically detects required integrations (such as Slack, email, and calendar access) and presents options for proceeding if any are missing.
The agent builder also queries connected Knowledge Bases to generate and save data-backed test cases (e.g., test_cases.md). Optionally, you can prompt the agent builder to run an end-to-end test or an evaluation of the agent, and output performance metrics such as success rate, average response time, and any identified issues or failures.
Most of the settings on the Create Agent page are also available in the Copilot Agent Builder.
To create an agent using the Copilot Agent Builder:
Go to the home page > Agents > Agent SDK > Quick Start and click Start with AI.
The Agent Copilot page opens.
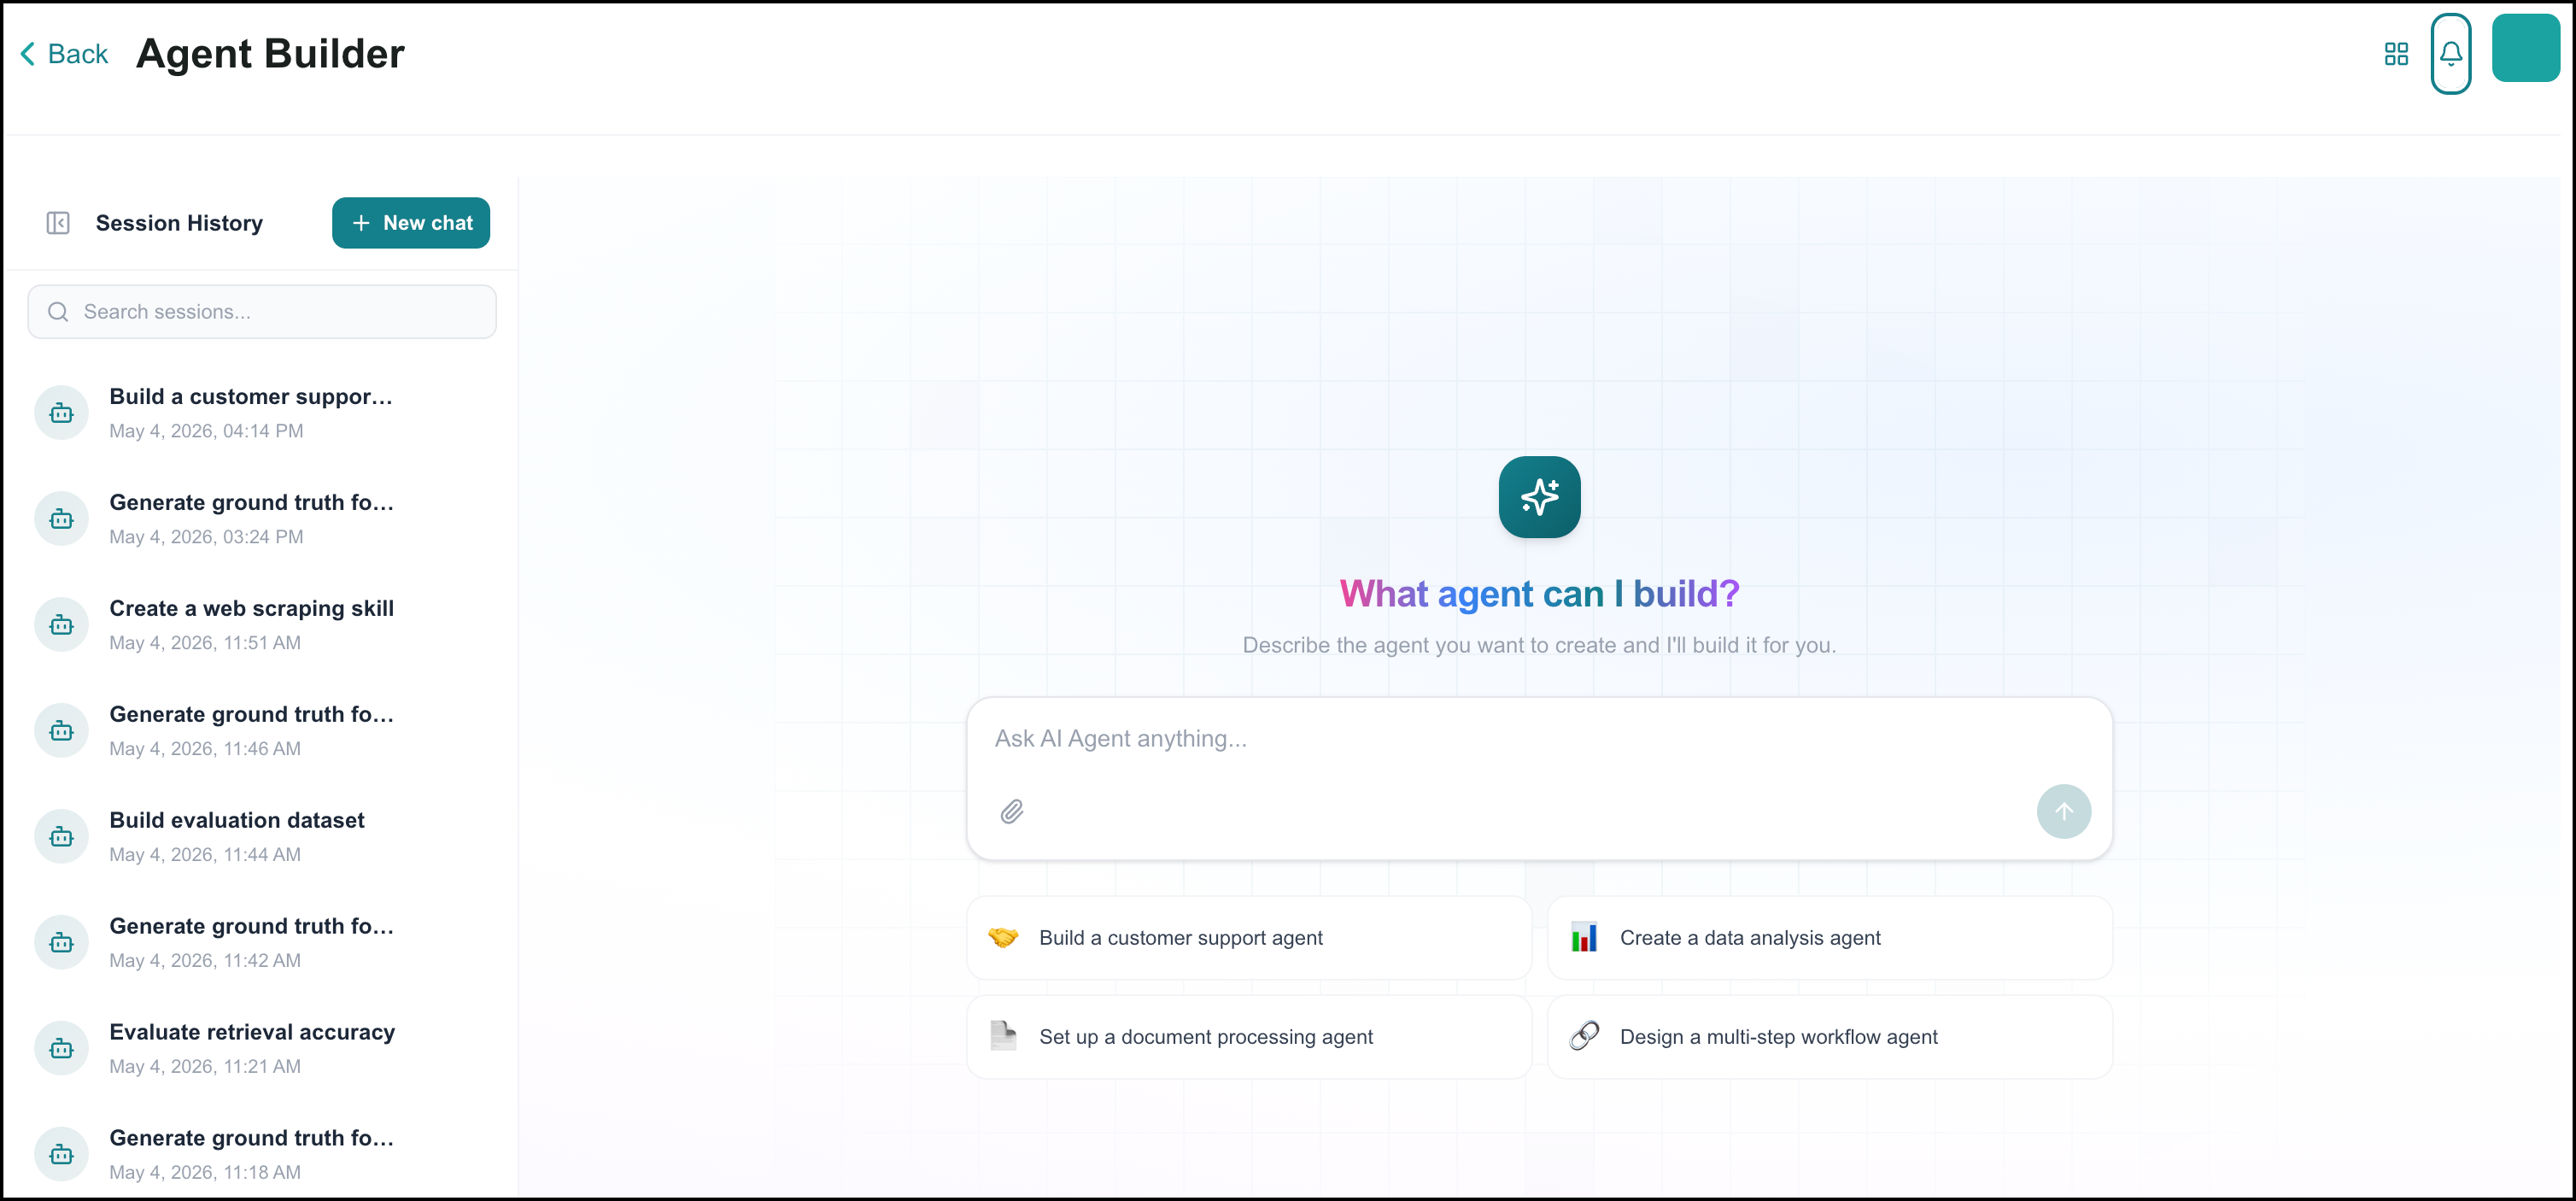
From the left panel:
Define the settings for your first session. These become the default settings for all your upcoming sessions. Refer to BAIC Copilot Settings for more information.
Click New Chat to start a new chat.
Search for and select a previous chat to revisit that session.
To manage a session, hover over it, then use the Edit
 icon to update the session name, or use the Delete icon to remove the session.
Type a natural language description of the agent's intended purpose and functionality in the description box and press Enter.
Use the Attach Files
 icon to upload files for more context.
Provide a description and an SVG-format icon to use as the agent's avatar.
Your request can be simple and open-ended: "Create an agent to get the weather in Palo Alto, California."
The agent builder will ask clarifying questions and guide the conversation as it builds the agent.
Use Shift+Enter to answer multiple questions in a single reply.
Once you approve, the new agent is created with a success message and is ready for testing, publishing, and execution (see Interacting with AI Agents) or further tweaks to its configuration.
Once the new agent is created, a manual configuration panel opens. You can use the Settings panel to make further changes to the agent.
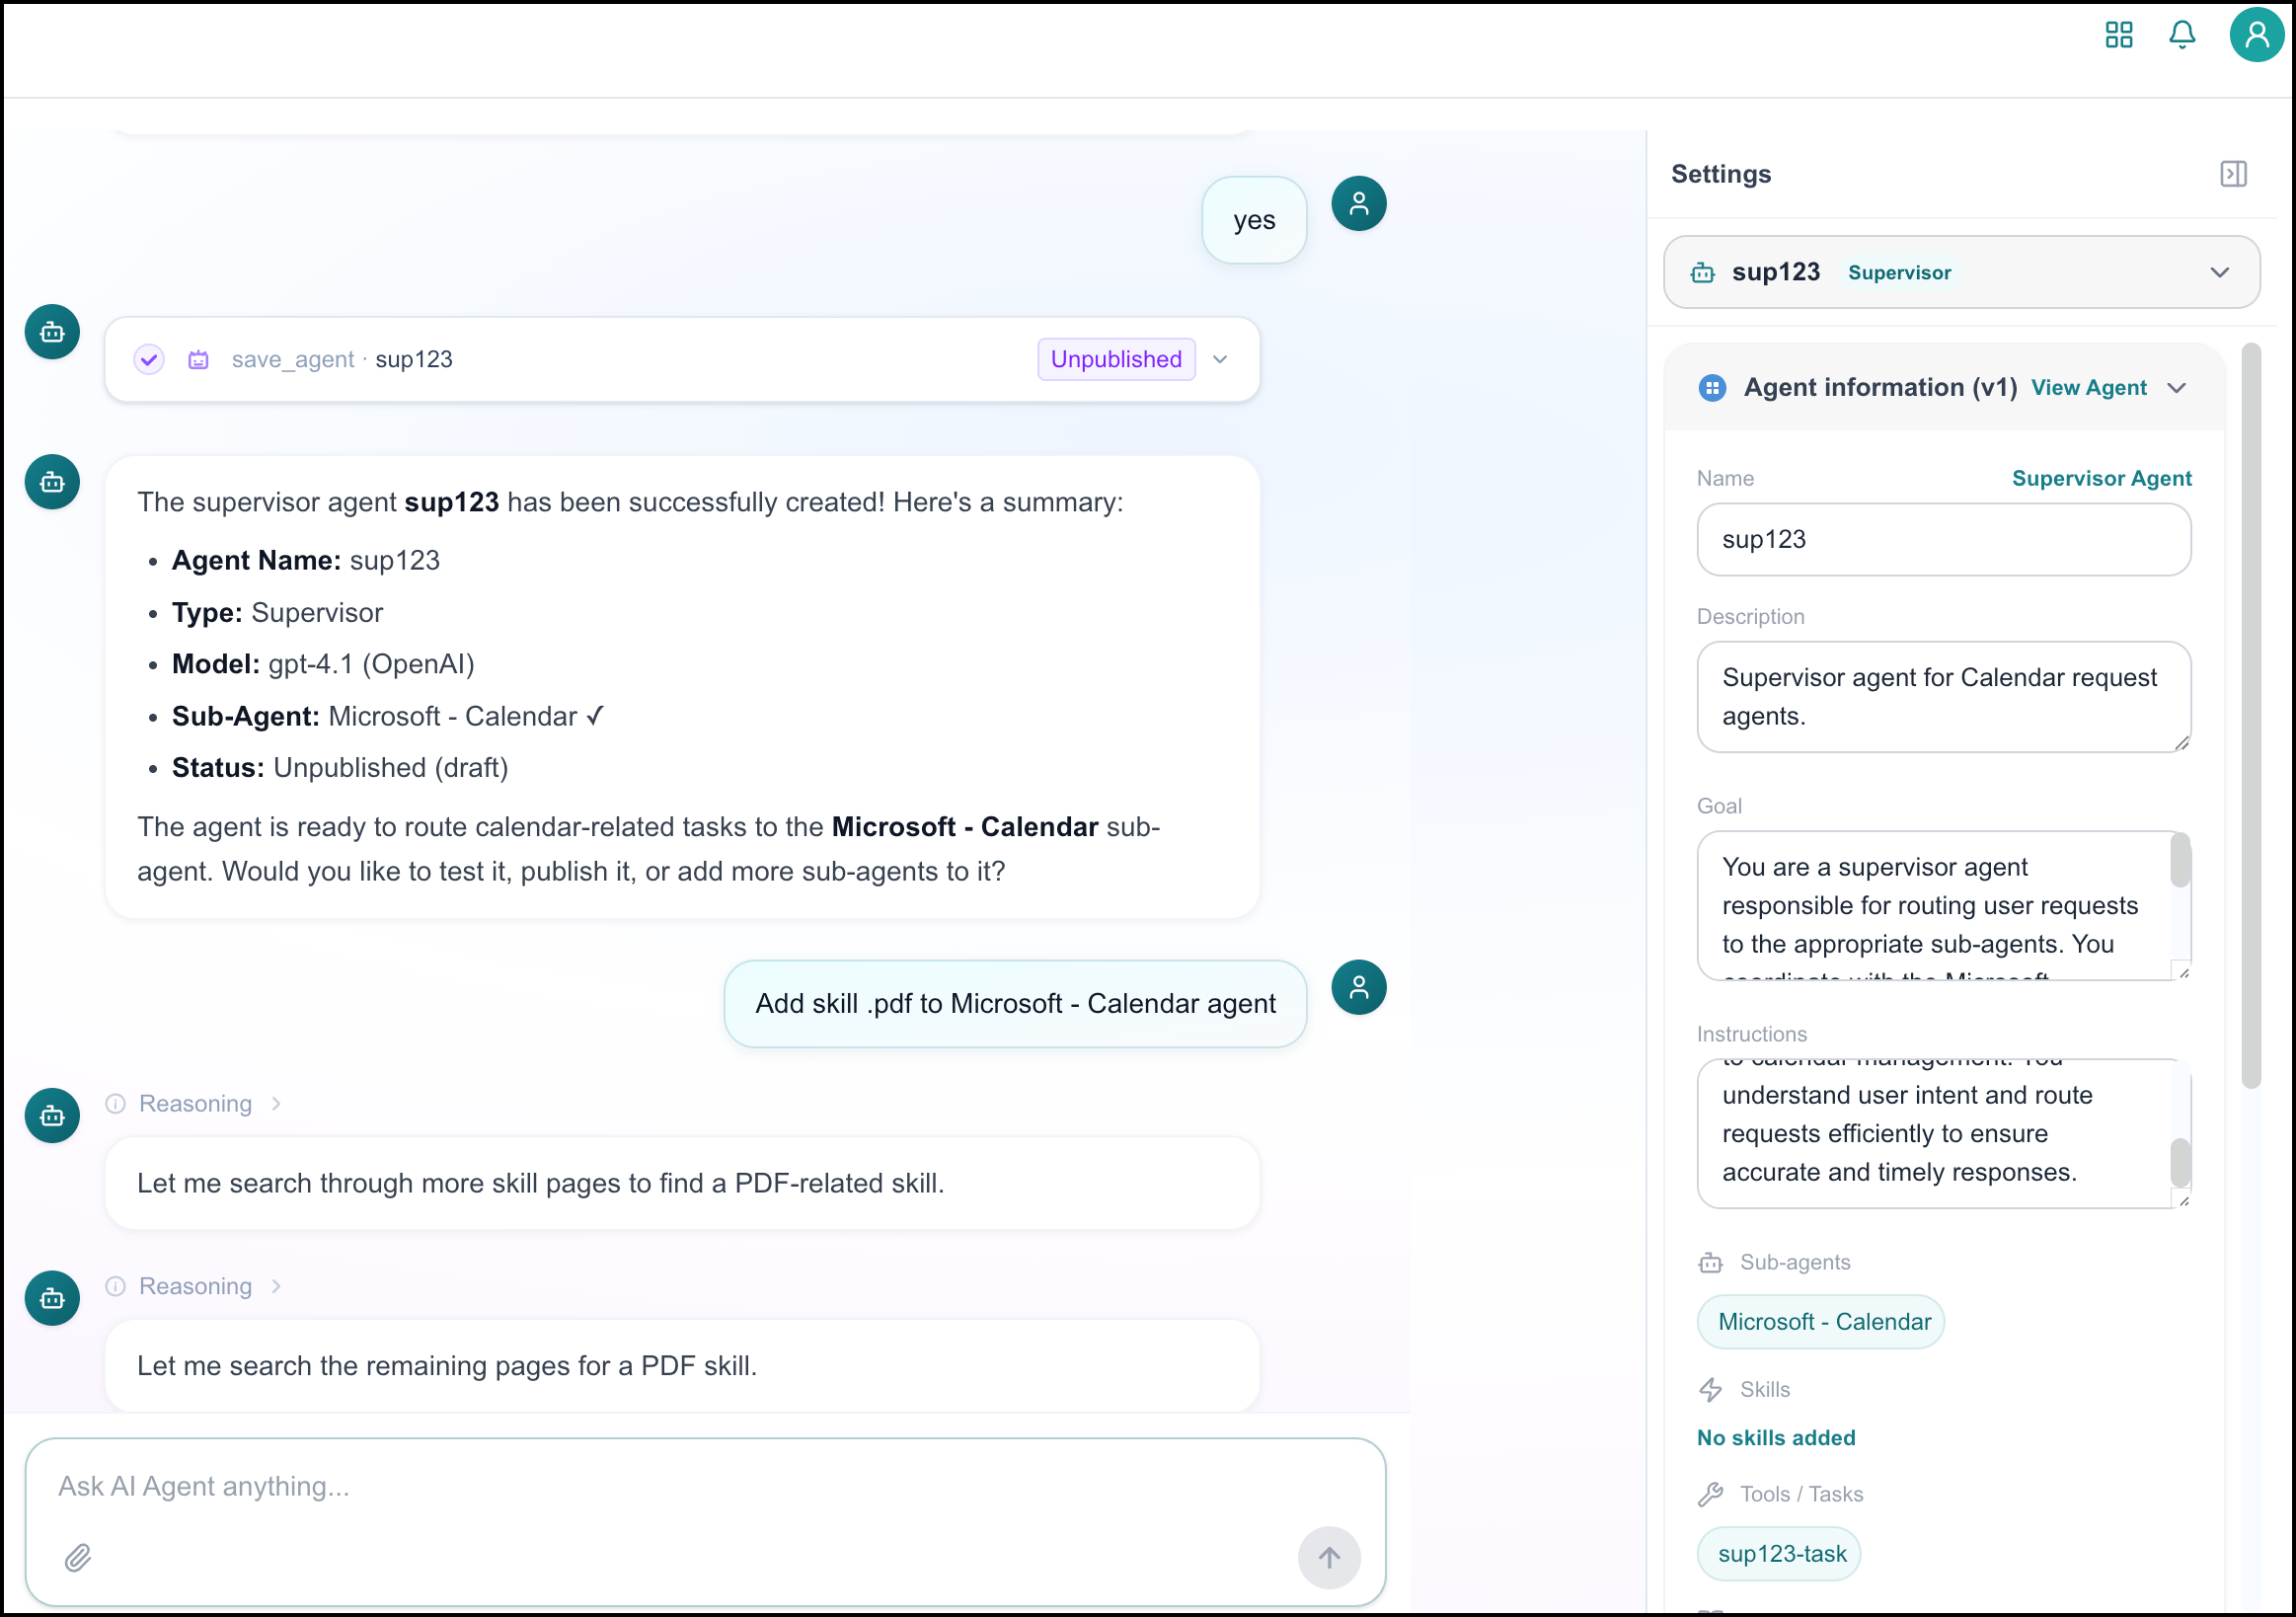
Via the agent's Settings panel, you can:
Switch between the Supervisor and any Sub-agents.
Update the agent information (Name, Description, Goal, Instructions).
Update the LLM configuration (Model/Provider, Token Limit, etc.).
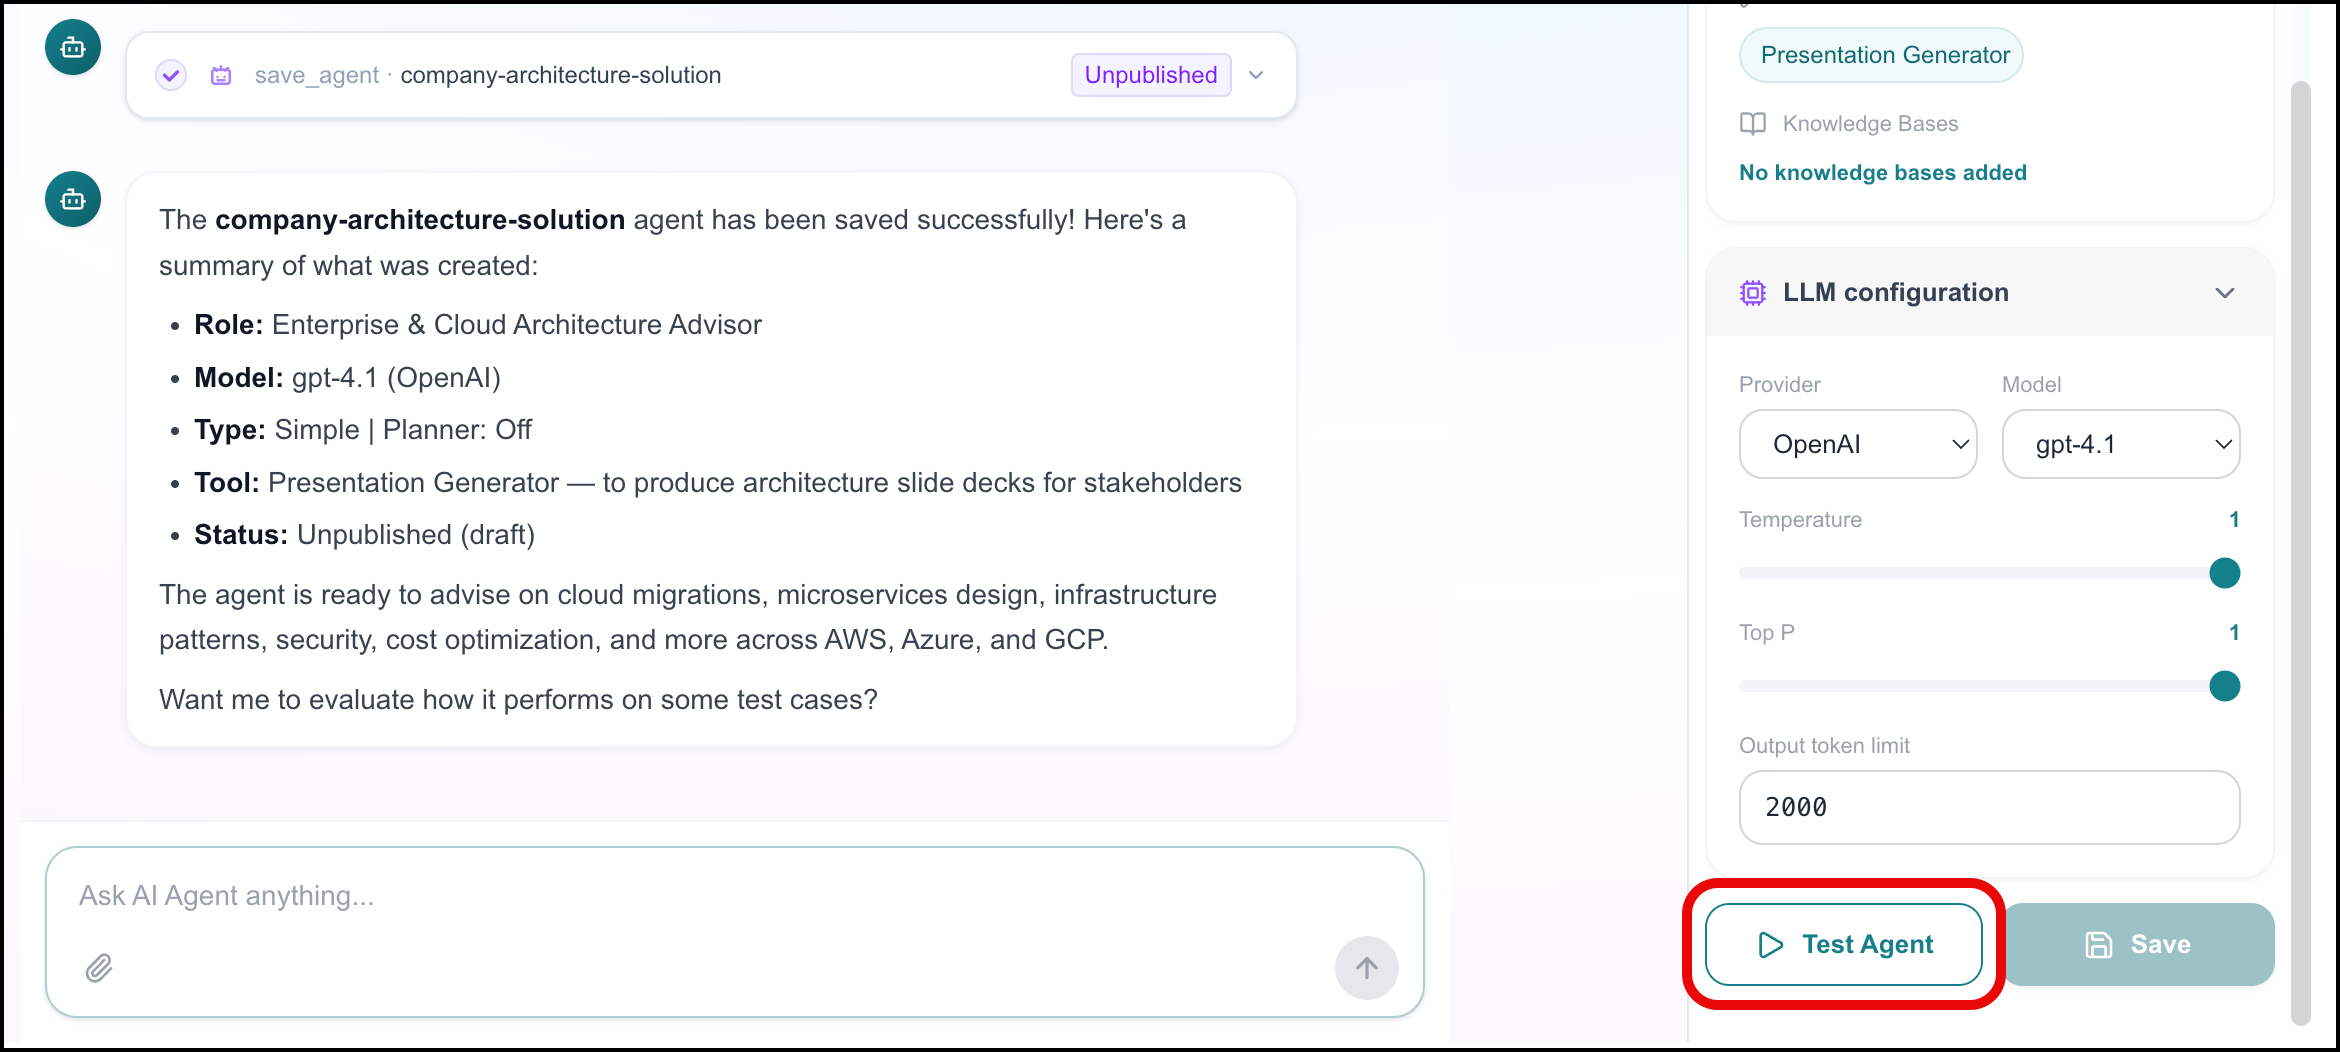
Click Test Agent to run an end-to-end test of the agent.
Click Save to save changes.
BAIC Copilot Settings
The BAIC Copilot Settings panel lets you control which elements of the Copilot task-execution interface are visible to viewers. You can choose a preset visibility profile or customize individual surfaces, such as reasoning steps, tool calls, and the task plan, so that you can view a simplified view while admins can view full execution detail.
To view and update the settings:
Open the copilot, then click the Settings
 icon to open the Settings panel.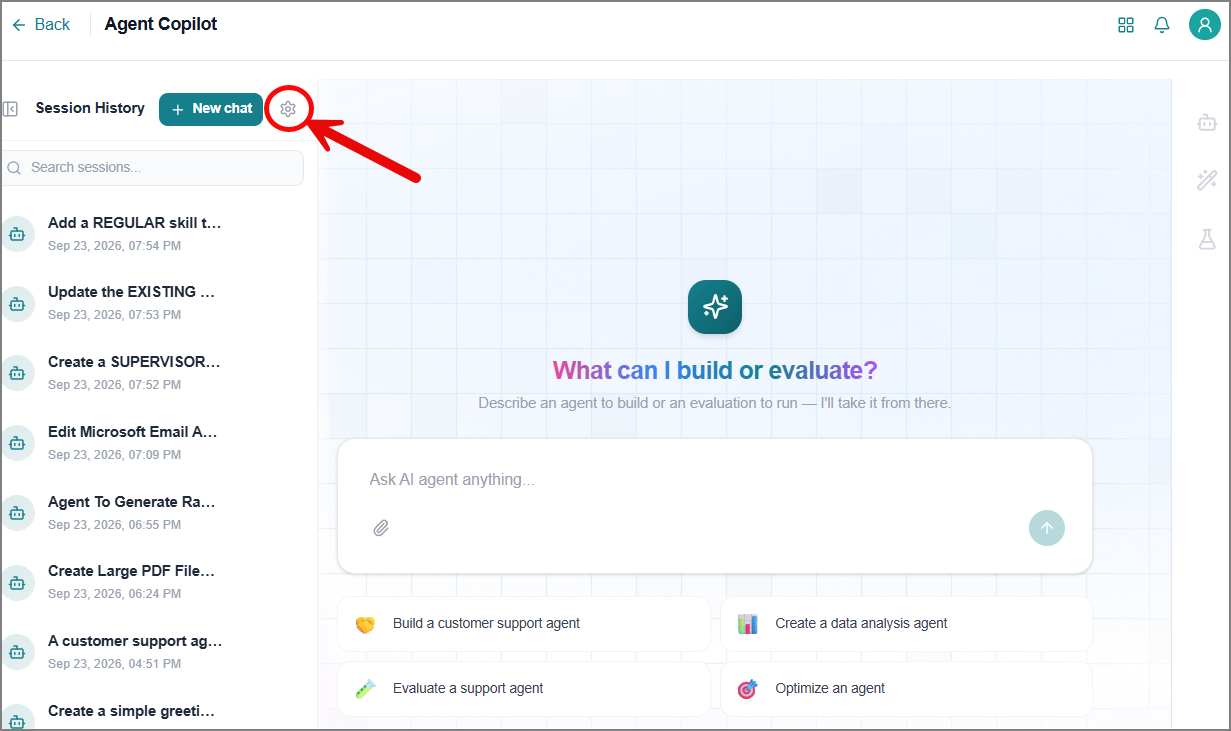
In the General tab, review or update the following fields:
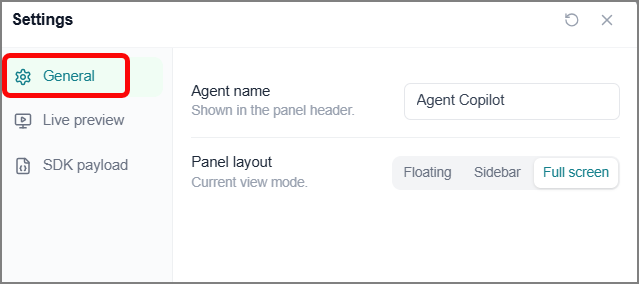
Agent Name - The name shown in the Copilot panel header.
Panel layout - The current view mode for the panel: Floating, Sidebar, or Full screen.
Switch to the Live Preview tab.
The panel displays a list of toggles on the left and a live, non-interactive preview of the Copilot panel on the right.
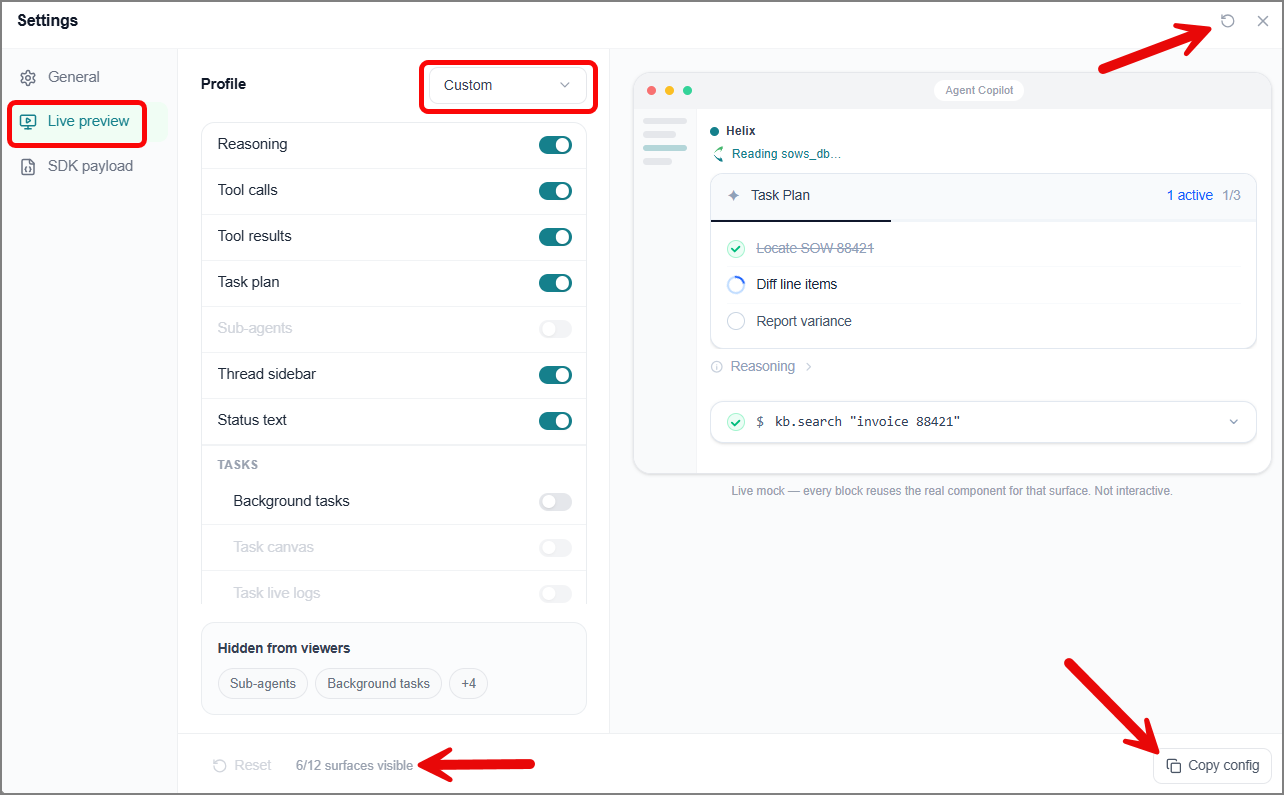
From the Profile dropdown, select a visibility profile:
Minimal - Display only Status text. All other surfaces are hidden. This is a preset, and its toggles are not editable.
Custom - Lets you turn individual surfaces on or off using the toggles below.
Developer - Display all available surfaces. This is a preset, and its toggles are not editable.
If you select Custom, use the toggles to show or hide each surface.
The live preview on the right updates immediately to reflect your changes, and the surface count at the bottom of the panel updates.
Tip
Review the Hidden from viewers list at the bottom of the Live preview tab to confirm which surfaces are currently turned off.
Switch to the SDK payload tab to view the Resolved visibility config, which is a JSON representation of your current visibility settings.
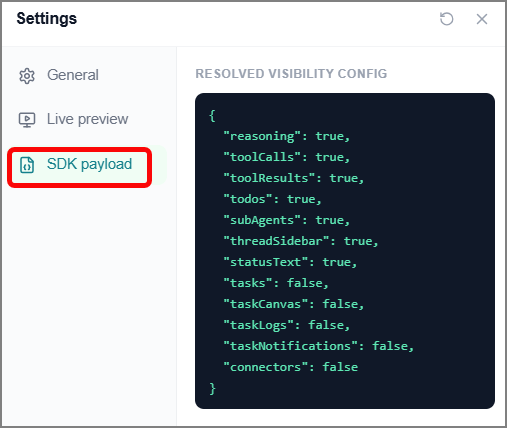
Click the Reset
 icon to restore the profile to its default configuration.
Click Copy config to copy the resolved configuration for use elsewhere (for example, in an SDK integration).
Testing Your Agent
Once you have created an agent via the Copilot builder, you can run an end-to-end test right in the builder.
Click Test Agent at the bottom of the Settings panel:
A testing dialog opens. Enter your test prompt, and optionally, add a knowledge base and upload related files.
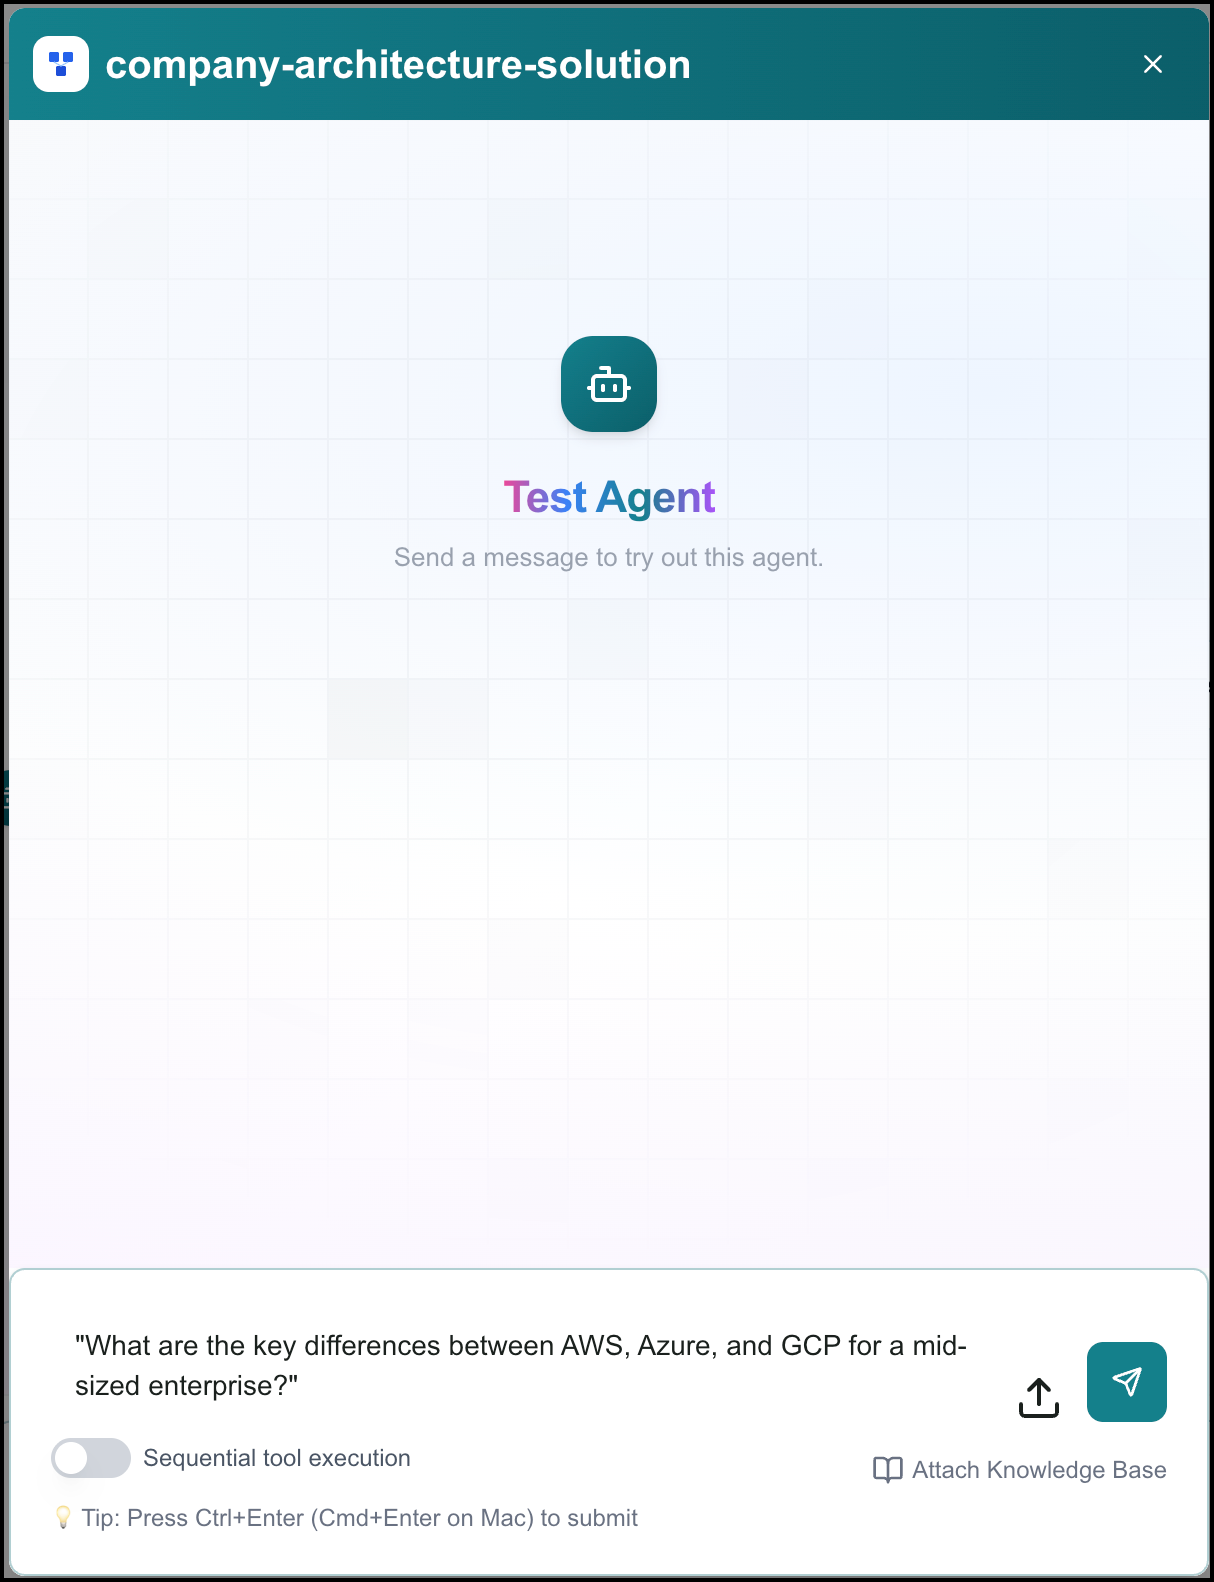
Click the Submit (
 ) icon or press Ctrl+Enter on Windows / Cmd+Enter on Mac to submit the test prompt.
Instruct the builder to make any necessary changes based on the output.
Prompt Gallery
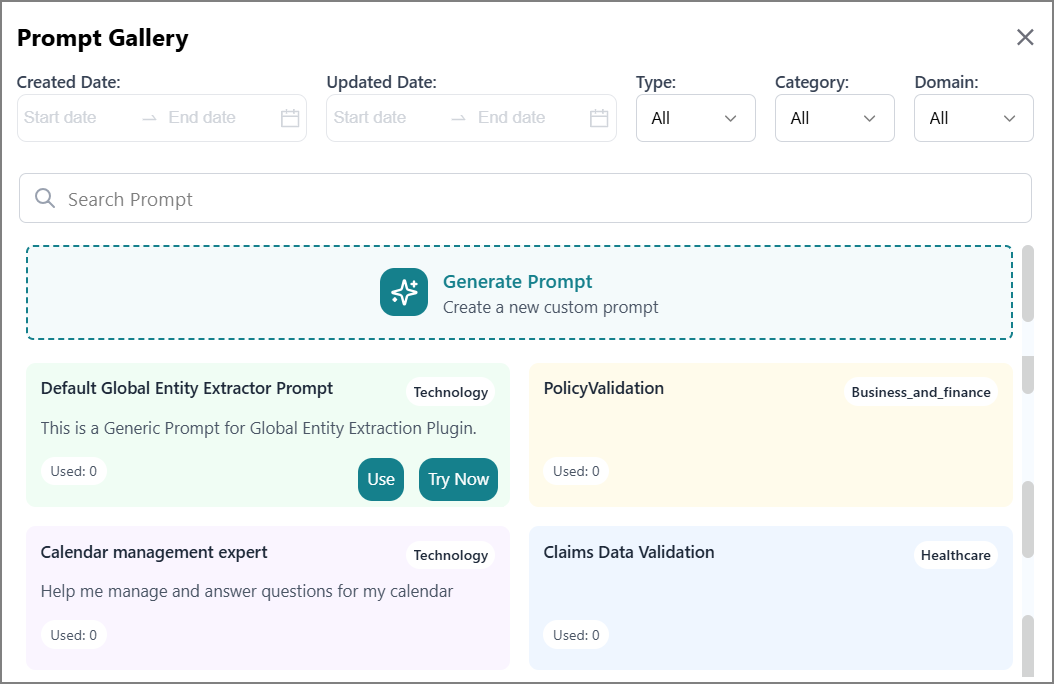
For optimal results, choose or generate prompts that closely align with the required task. You can filter prompts by name, creation date, last updated date, type, category, or domain.
Importing a Prompt
Click the Prompt
icon.The Prompt Gallery panel opens on the right, displaying all existing prompts in a card view.
Note
For more information about prompts, refer to Prompt Engineering.
Hover over the prompt card to view more actions.
Click Use to import the prompt into the agent.
Alternatively, click Generate Prompt to generate a new prompt. For more information, refer to Creating a Prompt.
Validating a Prompt
All prompts are available in the Prompt Gallery, where you can review, validate, and apply them as needed.
To preview and validate a prompt:
Click Try Now on the desired prompt.
The Prompt Detail panel opens for preview.
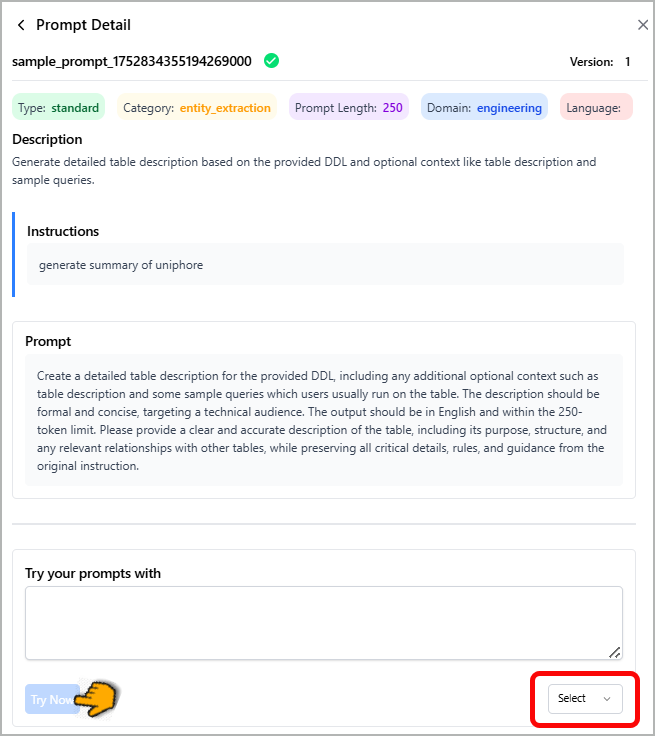
Enter a user query in the Try your prompts with field that is relevant to the selected prompt.
This allows you to simulate how the prompt will respond to real user input.
Choose an LLM from the dropdown list at the bottom right.
Click Try Now.
You can view the result based on your query, the selected prompt, and the configured LLM model.
Adding Tasks/Tools
You can add one or more tasks/tools that the agent must execute to complete user queries.
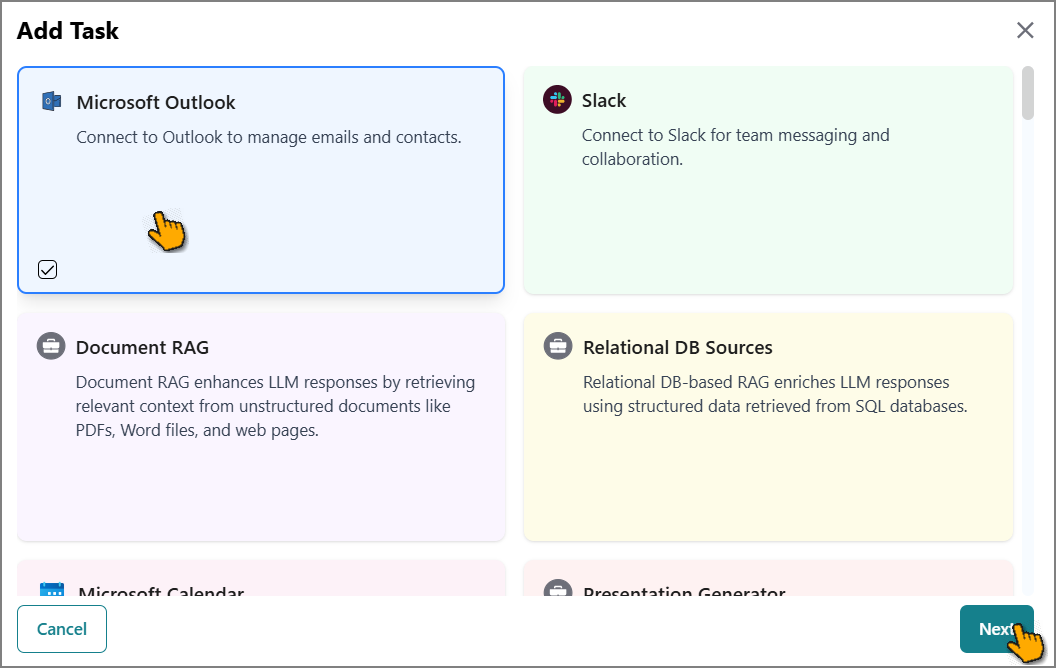
Click Add Tasks in the Tasks & Tools section.
The Add Tools panel opens on the right and displays a list of tools configured before.
Tip
If no tools appear, or the tool you need is not on the list, you must add it to the Agent Action Library page first.
Select one or more required tools.
Click Next.
The Actions panel opens.
Select one or more specific tasks from the tool's action list that this agent needs to execute its job.
Important
Select at least one action for each tool to move forward.
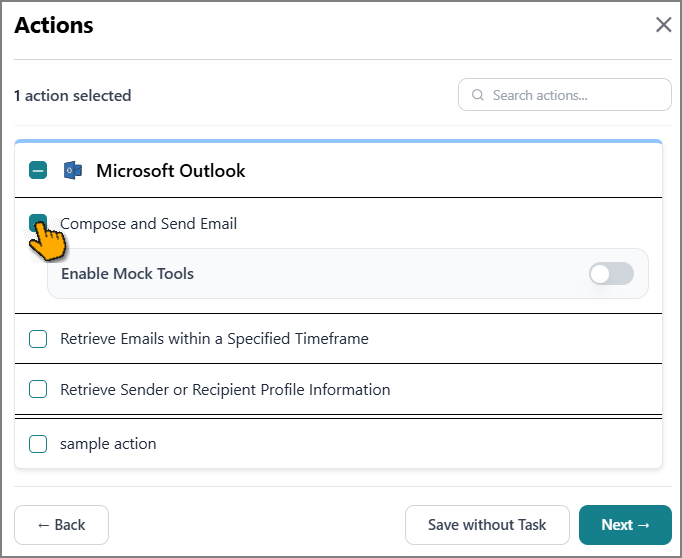
For each action you enable, you can enable Mock Tools.
Click Save without Task to save the tool and action without creating a task.
To create a task, click Next.
The Add Task panel opens.
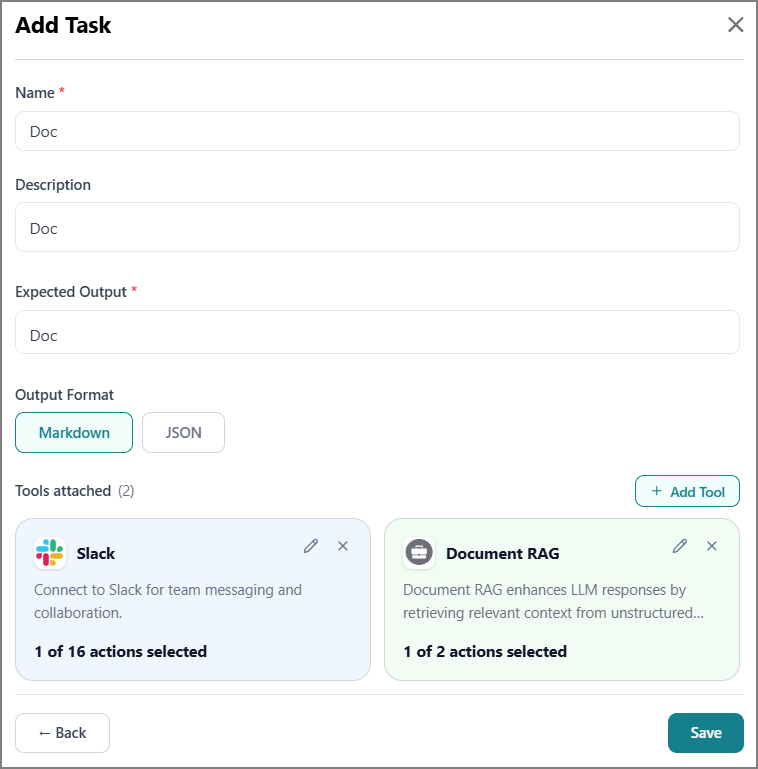
Enter a name for this task configuration.
Enter a detailed description of this configuration.
Enter the expected output that the tool should return when triggered by the agent.
Choose the required output format. Refer to Create Output Schema for more information.
The attached tools are displayed in a card view for review.
To add more tools, click Add Tool and follow the process from the beginning.
To remove the tool, click the Delete icon on the tool card.
To edit the tool actions, click the Ddit icon on the tool card.
Click Save to store the configuration.
Mock Tools
Use Mock Tools to configure simulated responses for the tools attached to an agent in Agent SDK, so those tools return mock data instead of calling live APIs when you run experiments in Agent Evaluation. You can enable mocking for each tool individually, choose whether the response is static or generated dynamically by an LLM, and turn mock tools on or off per experiment run.
Key Capabilities:
Per-Tool Mocking - Enable mock behavior individually for each tool attached to an agent, so only the tools you choose return simulated data.
Static Response Mocking - Provide a fixed JSON response that's returned as-is whenever the tool is called.
LLM Mock Generation - Provide a schema example (and optional context) so the LLM generates a dynamic, realistic response for each call.
Evaluation-Scoped Usage - Turn mock tools on or off per experiment run in Agent Evaluation, so you can compare an agent's behavior with and without live tool calls.
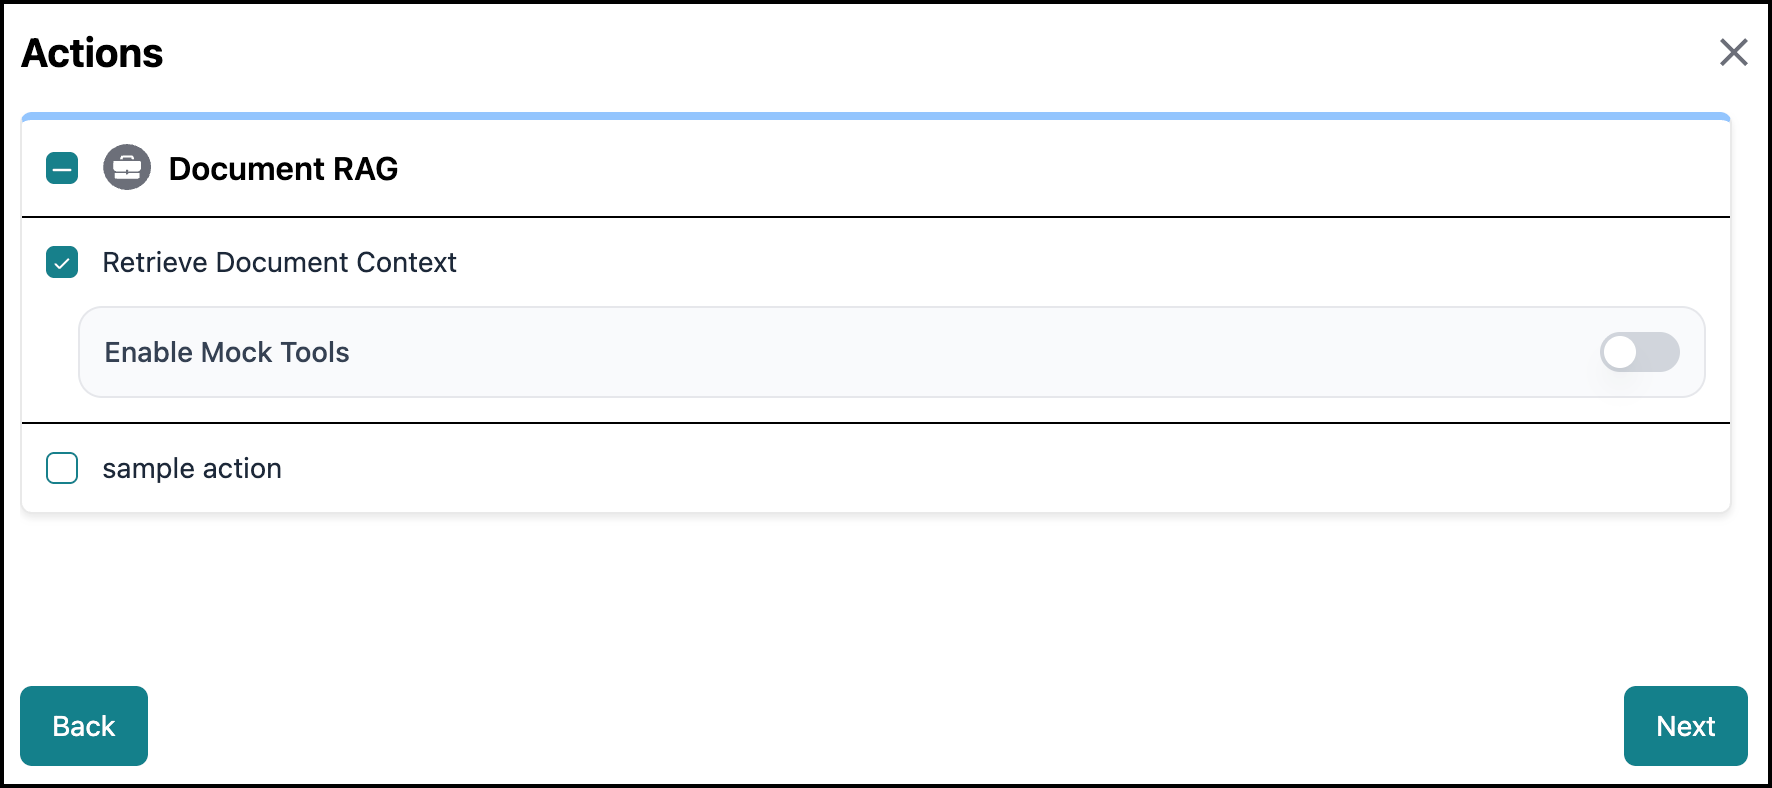
To access this feature, go to the home page > Agents > Agent SDK, then open an existing agent or create a new one and add a tool.
The tool's Action panel opens. Select a tool to access the Enable Mock Tools toggle along with the tool's standard settings.
 |
Enabling Mock Tools on an Agent
To enable mock tools for an agent:
Go to the home page > Agents > Agent SDK. Open an existing agent or create a new one.
Add a tool, or select an existing tool attached to the agent.
Toggle on Enable Mock Tools.
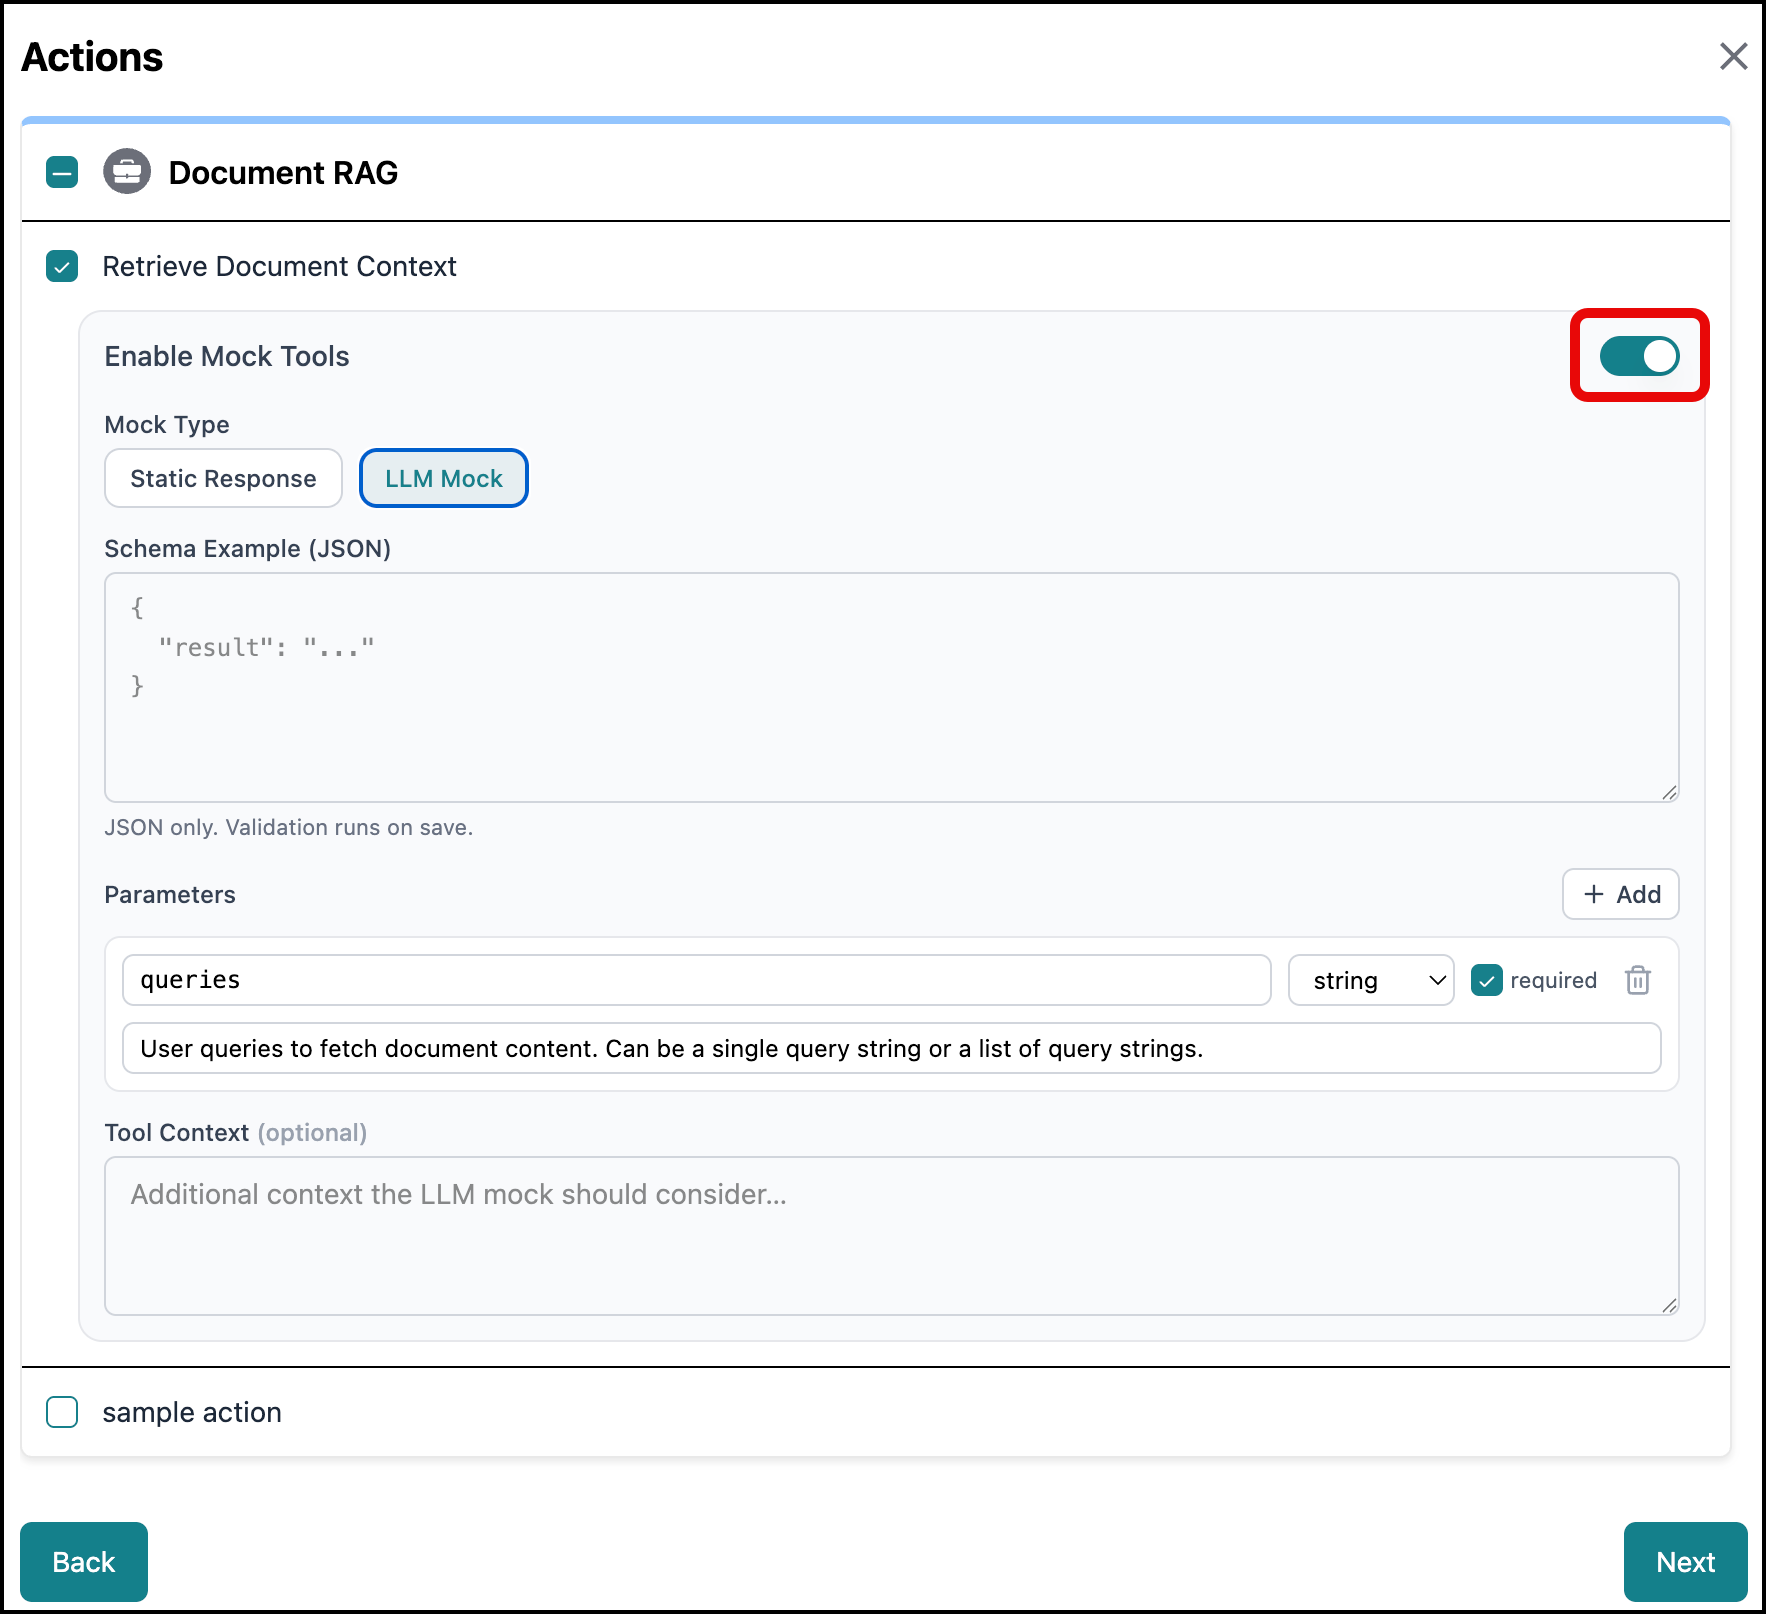
Choose a Mock Type:
Static Response - Returns the exact JSON you enter in the Schema Example field, unchanged, every time the tool is called.
LLM Mock - Uses your Schema Example as a template and generates a varied, realistic response for each call. You can optionally add guidance in the Tool Context field to steer what the LLM returns; this field is not available for Static Response.
Enter a Schema Example (JSON) for the tool's mocked response.
Optionally, define Parameters (name, type, and whether required) that the mock should account for.
Click Next to continue with the agent flow and then click Save.
The tool now returns mock data instead of calling its live API whenever mock tools are used in an experiment run.
Running an Experiment with Mock Tools
Once mock tools are enabled on an agent's tools, you can choose whether to use them each time you run an experiment.
To run an experiment with mock tools:
Go to the home page > Agents > Agent SDK and click Agent Evaluation.
On the Experiments tab, click the Ellipsis (
 ) icon on the experiment you want to run and select Run.
In the Run Experiment dialog, toggle on Use mock tools.
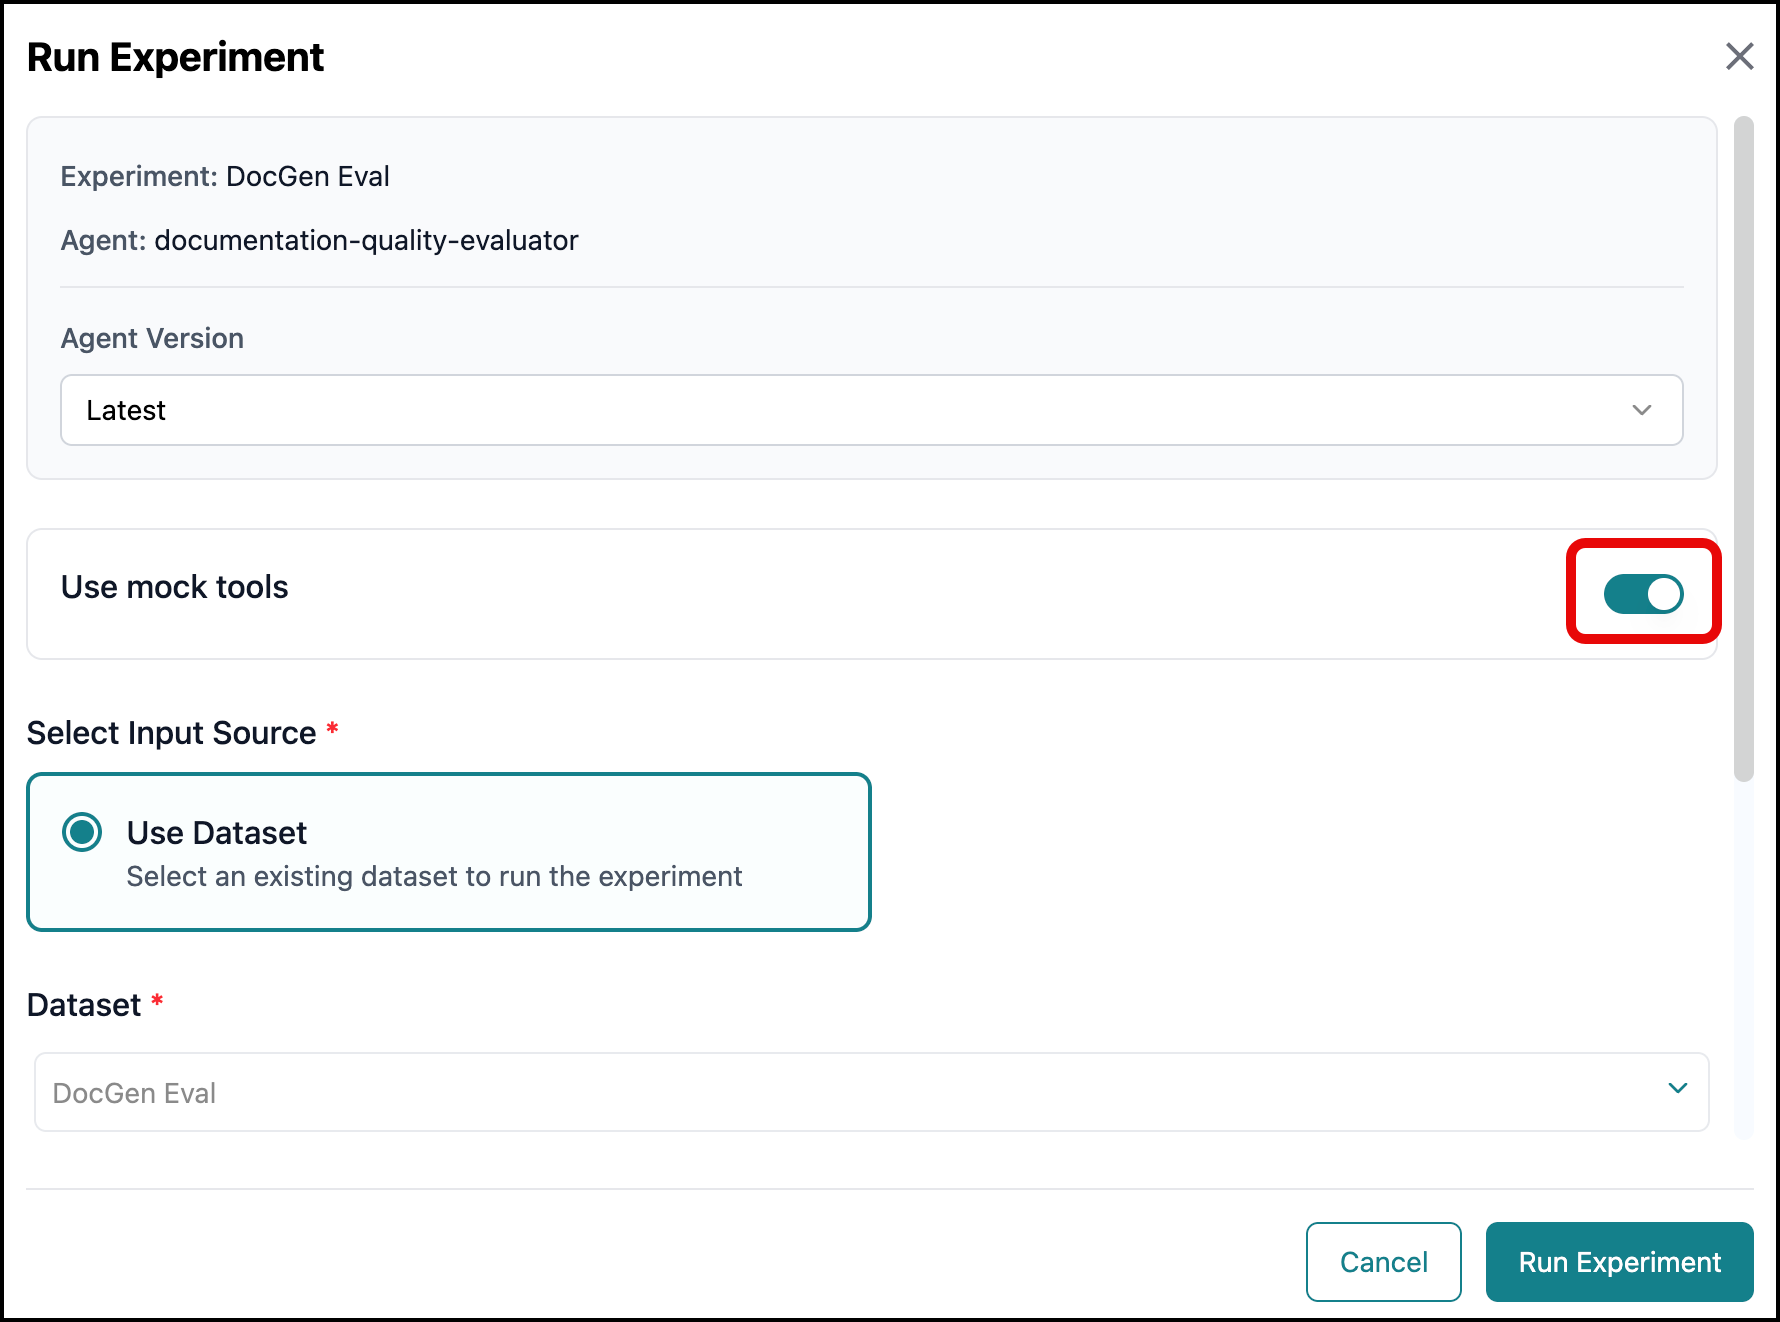
Click Run Experiment.
The experiment runs using mock data for any tools with mock tools enabled, rather than calling their live APIs.
Note
Use mock tools applies only to tools that have Enable Mock Tools turned on. Any tool without mocking enabled still uses its live API during the run, even if Use mock tools is toggled on for the experiment.
To confirm mock tools were used and review the results:
Select View Run History from the experiment's Ellipsis (
) menu to open the Experiment Runs page.Check the Mock Tools column to confirm that the run used mocked data.

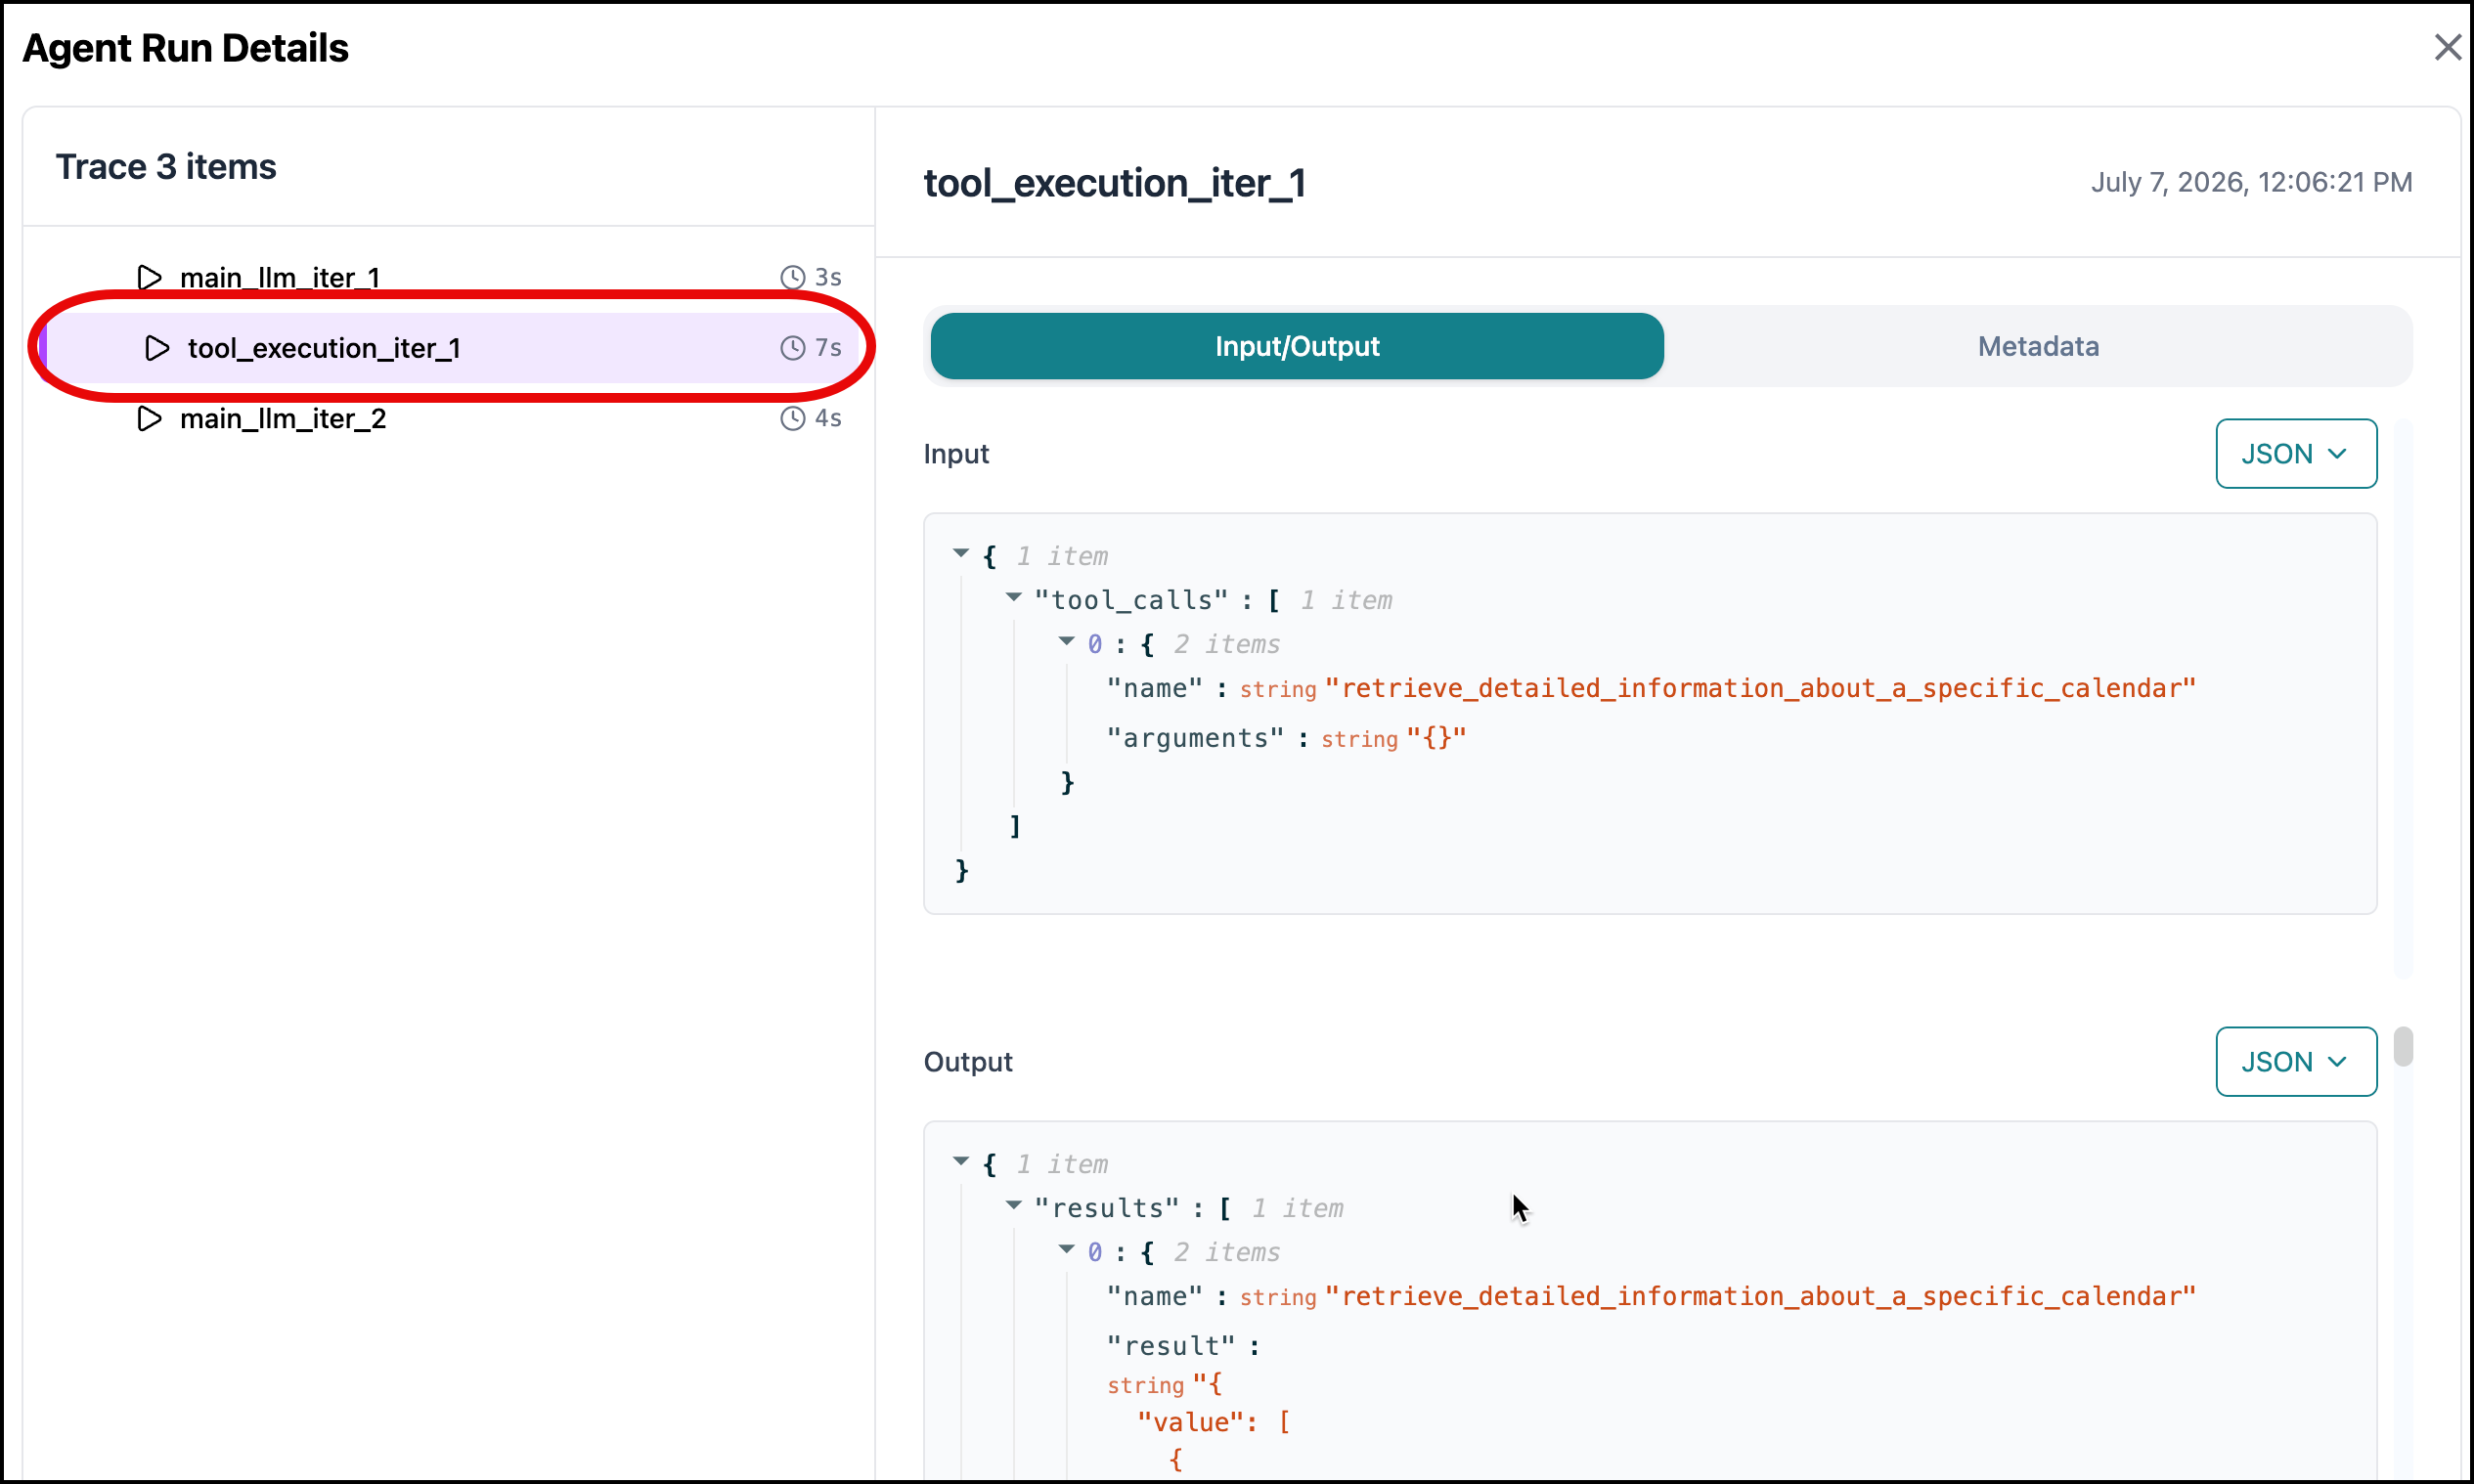
Click the run to view its trace in the Agent Run Details screen, then click a mocked tool to see its mocked input and output.
Managing Tasks and Tools
You can update the tools and tasks attached to an agent.
To update tasks and tools:
Click Edit in the Tasks & Tools section.
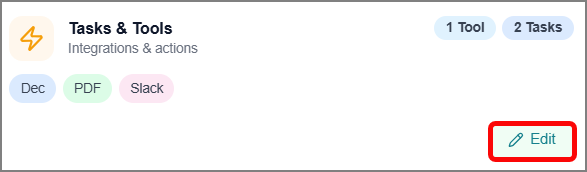
The Manage Tools & Tasks panel opens.
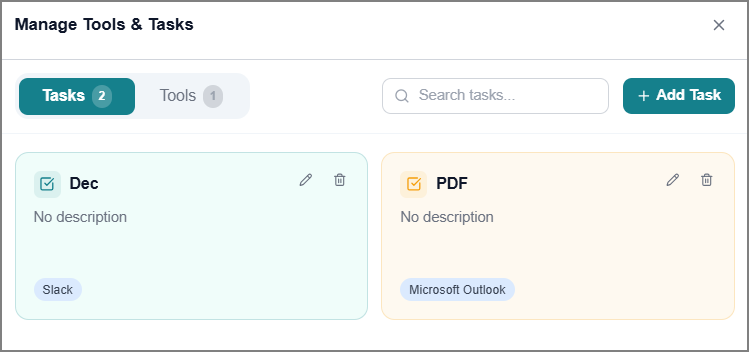
On the Tasks tab, view the list of previously created tasks. Click Add Task to add a new task.
On the Tools tab, view the list of previously created tools. Click Add Tool to add a new tool.
Use the following icons to manage existing items on either tab:
Edit
icon: Update an existing item.Delete
icon: Remove the item from the agent.
Adding Skills
Agent Skills are reusable instruction packages that define how an agent thinks and responds for a specific task. Skills allow you to add runtime instructions to an agent in a selected format. Skills can be shared across multiple agents, updated from a single location, and versioned for safe iteration.
Click Add Skill in the Skills section.
The Add Skills panel opens and displays a list of skills in predefined categories in the Catalog tab. The skills present in this list are created via the Agent Skills page.
Select one or more skills from the list.
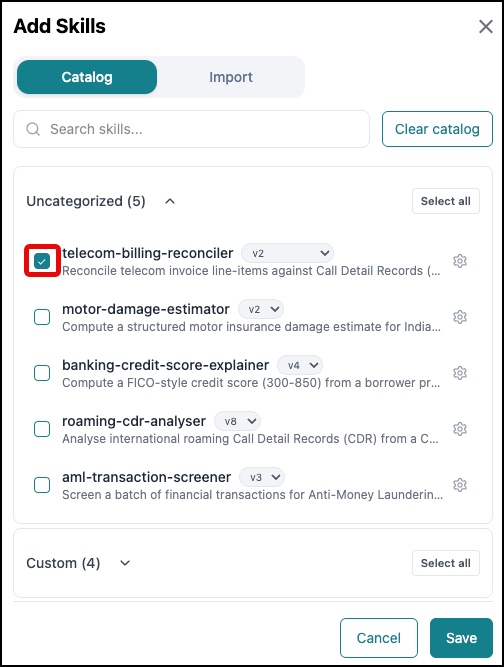
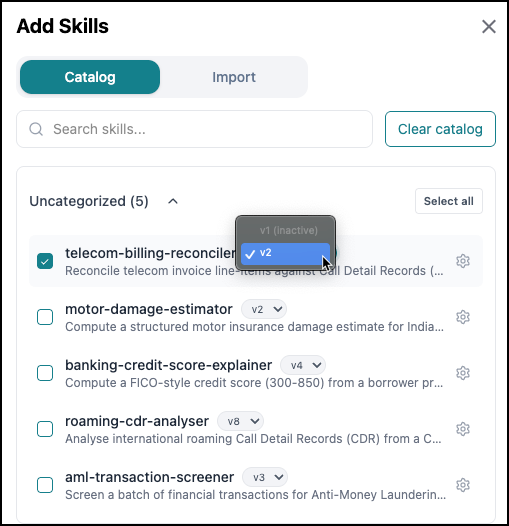
You can specify a version of the skill to use. By default, the most recent version is selected. Inactive versions are not selectable.
To include skills not listed, first import the skills and select them from their respective categories.
To import a new skill:
Switch to the Import tab.
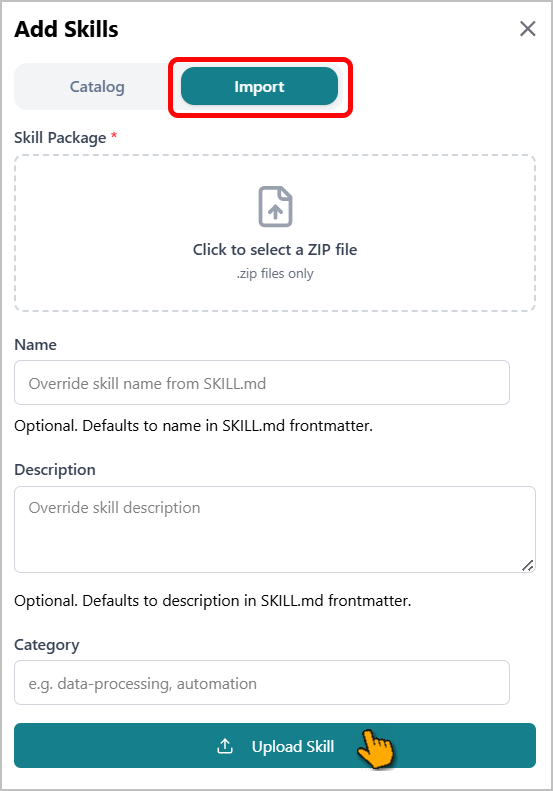
Select the required ZIP file from your local system.
Note
The ZIP file must contain a Skill.MD file and be under 50 MB.
Enter a Name, Description, and Category for the skill.
Click Upload Skill.
Upon upload, Business AI Cloud scans the skill for security issues, provides a grade, and shows any warnings or errors that are generated. If the imported skill receives a passing grade, it is added to the Catalog tab and becomes available for selection.
Click the Settings
icon on a skill tile to review its details.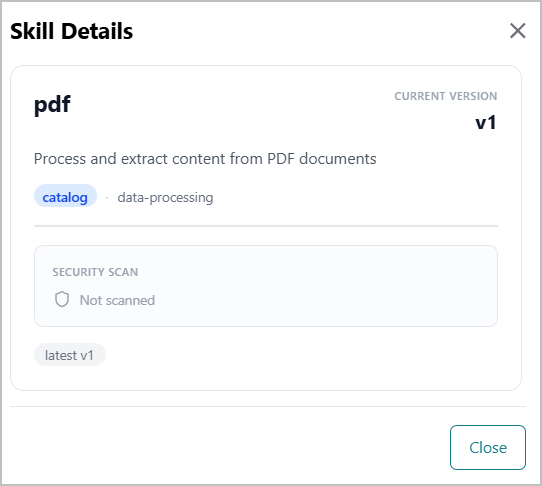
Click Save to store the configuration.
Managing Skills in Agents
You can update the tools and tasks attached to an agent.
To update a Skill:
Click Edit on the Skills section.
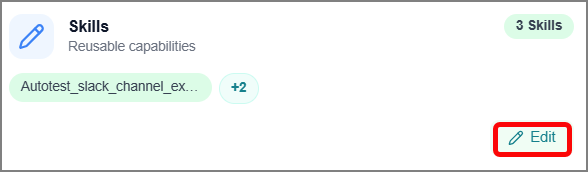
The Manage Skills panel opens.
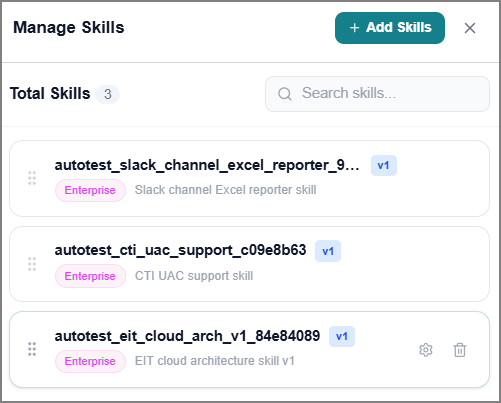
To add a new skill, click Add Skills.
To rearrange the skill sequence, select the drag
 icon next to a skill and drag it to the required position.
To remove the skill from the agent:
Hover over the skill.
Click the Delete
icon.
Adding Knowledge Bases
You can add one or more KBs for the agent to use to complete user queries.
Click Add KB in the Knowledge Base section.
The Knowledge Base panel opens on the right.
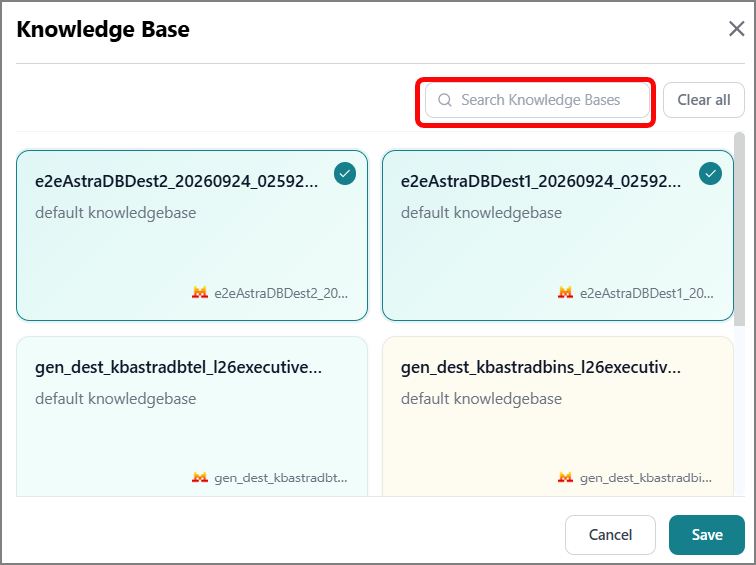
Enter the knowledge base name in the search box to filter and locate the desired knowledge base.
Select one or more knowledge bases from the list.
Click Save to apply and save the configuration.
Managing Knowledge Bases in Agents
You can update the KBs attached to an agent.
To update a KB:
Click Edit on the Knowledge Base section.
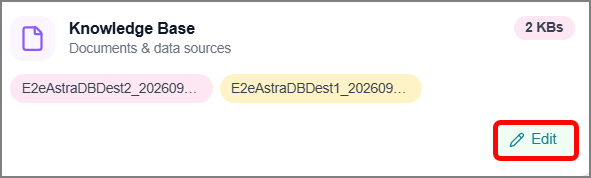
The Knowledge Base panel opens.
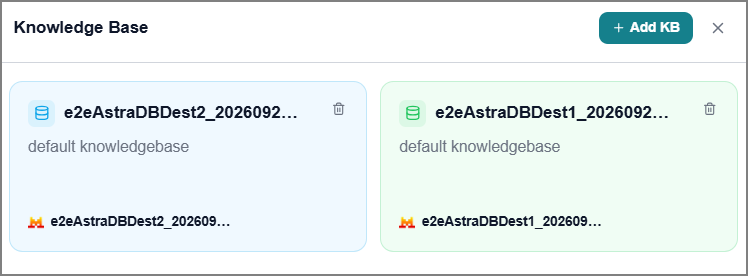
To add a new KB, click Add KB.
To remove the KB from the agent:
Hover over the KB.
Click the Delete
icon.
Adding Hooks
Hooks let you extend an agent's behavior by executing actions or invoking other agents automatically at specific points in the agent's lifecycle. Use hooks to inject context before the agent responds, enrich the conversation with data from external systems, trigger side effects after tool calls, or orchestrate multi-agent workflows.
Each hook is tied to a single lifecycle event and executes every time that event occurs during a session.
Lifecycle Events and Hook Types
When you add a hook, you select the lifecycle event at which it should fire, the type of action to perform, and how the result should be handled.
Lifecycle events determine when the hook executes:
At the start of a session
Before each agent response
After each agent's response
Before each tool is invoked
After each tool is invoked
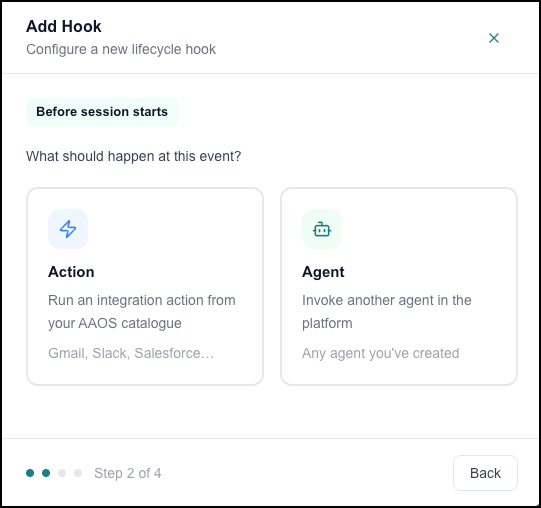
Hook types determine what happens when the event fires:
Action - Run an integration action from your AAOS catalog (for example, Gmail, Slack, or Salesforce).
Agent - Invoke another agent you have created in the platform.
Result behavior determines how the hook's output is used:
Inject result into the conversation - The hook's output is added to the agent's context as a message before it responds. Use this when the agent needs the hook's result to inform its reply.
Run in the background - The hook fires asynchronously, and its result is discarded. The agent's response is not blocked or delayed. Use this for side effects where the result does not need to influence the agent.
Adding a Hook
To add a hook to an agent:
Click + Add Hook in the Hooks section.
The Add Hook panel opens.
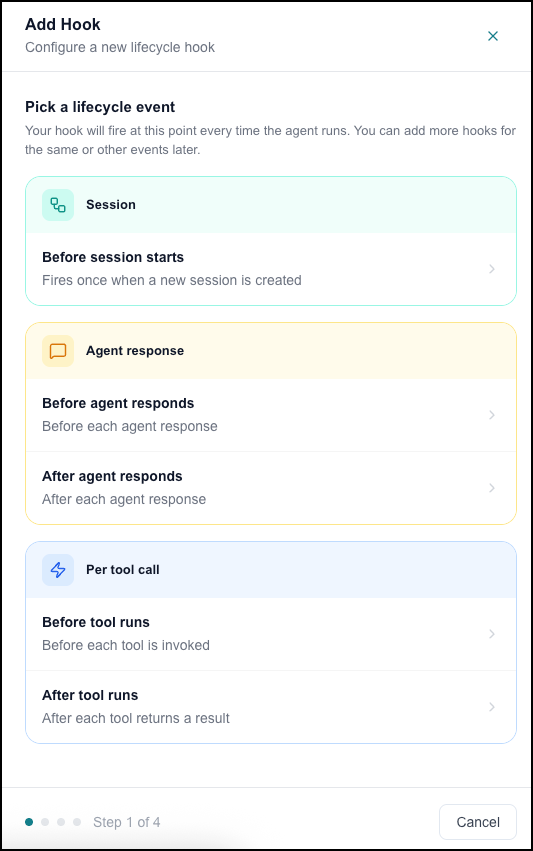
Select a lifecycle event and click the arrow to proceed.
Select Action or Agent as the hook type and click the arrow to proceed.
Choose how the result should behave:
Enable Inject result into the conversation to pass the hook's output into the agent's context.
Enable Run in the background to fire the hook asynchronously without affecting the agent's response.
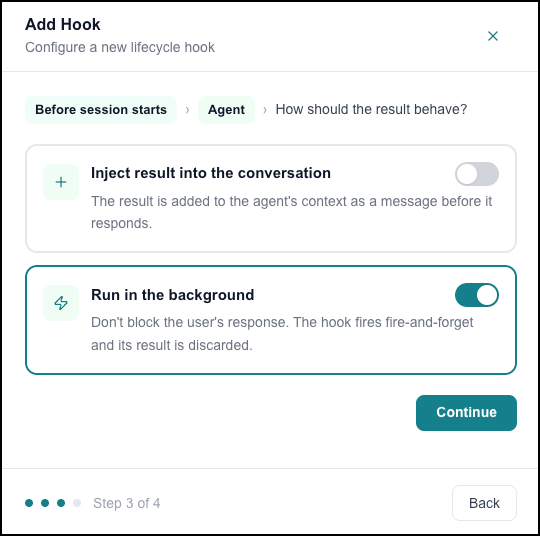
Click Continue.
Configure the hook details.
If you selected Agent in step 2:
Agent - Select the agent to invoke from the dropdown.
Query - Enter the instruction or question to send to the invoked agent (for example, Summarize this user's past interactions and preferred communication style).
Context - Select the conversation context to pass to the invoked agent:
Option
Description
None
No conversation context is passed
Current turn
The current user message and agent response
Last message
The most recent message in the conversation
Full transcript
The complete conversation history for the session
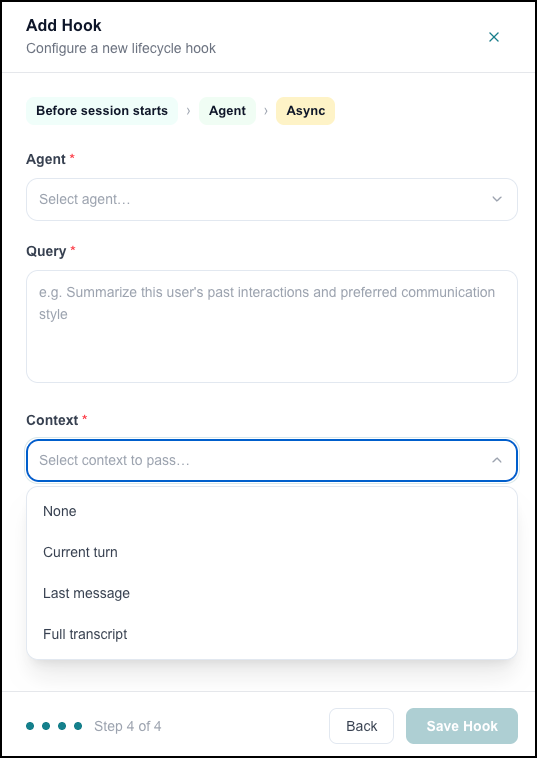
If you selected Action in step 2:
Integration - Select an integration from the dropdown.
Action - The list of available actions changes depending on the integration you select.
Based on the selected action, fill out the required details below.
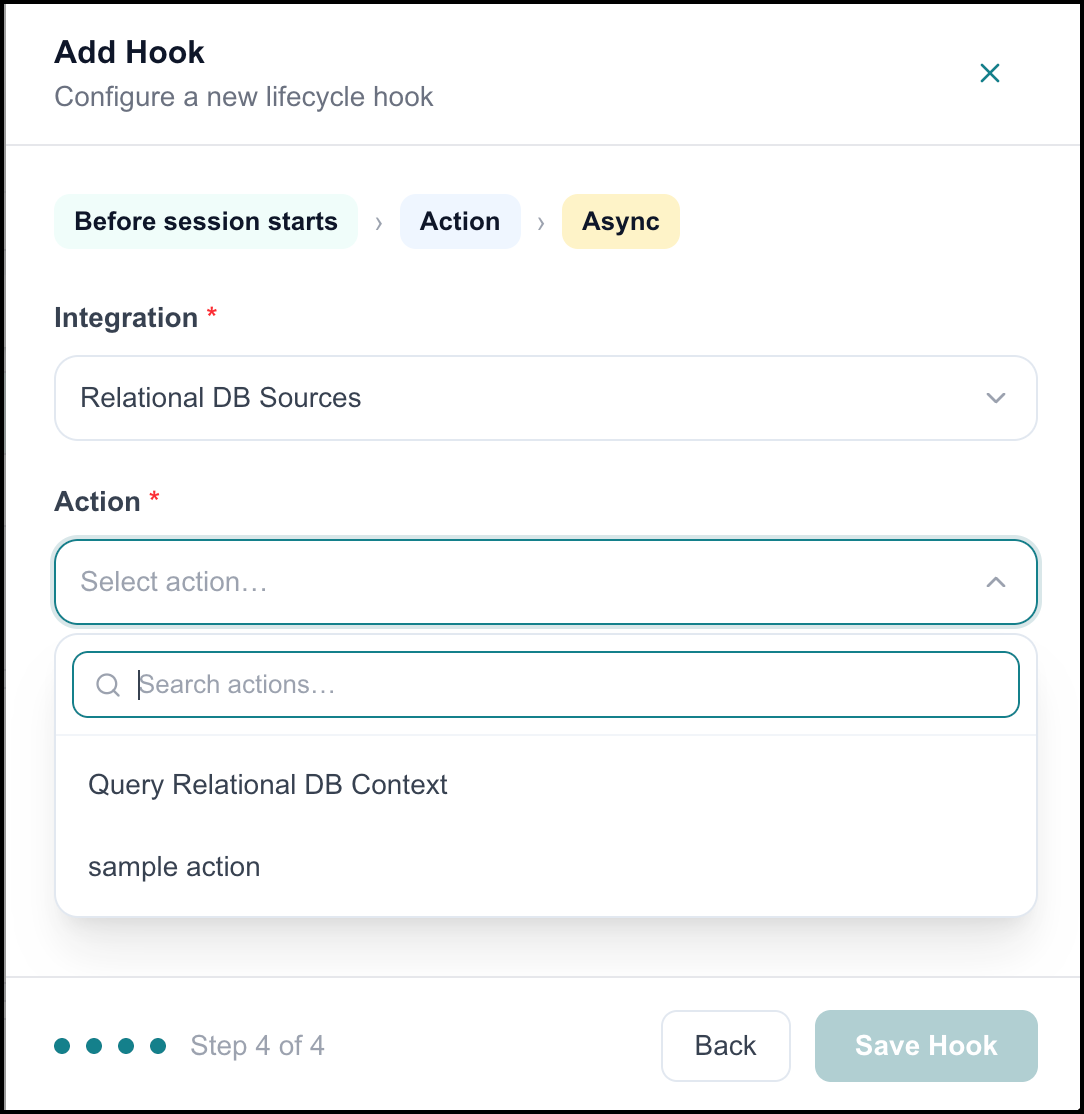
Click Save Hook.
The hook is saved and listed in the Hooks section of the agent configuration page.
Note
You can add multiple hooks to a single agent, including multiple hooks for the same lifecycle event.
Managing Hooks in Agents
You can update the Hooks attached to an agent.
To update a Hook:
Click Edit on the Hooks section.
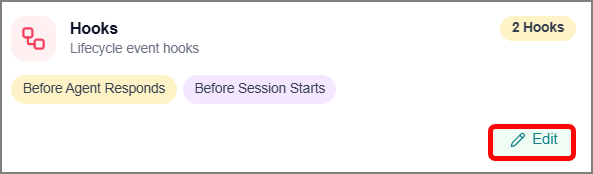
The Hooks panel opens and displays existing hooks.
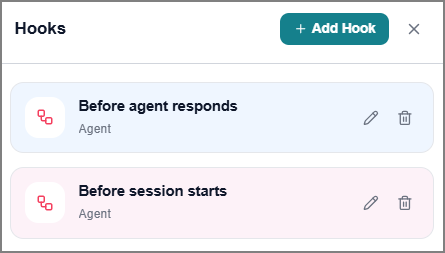
To add a new skill, click Add Hooks.
To update a hook, click the Edit
icon.To remove a hook from the list, click the Delete
icon.
Adding Sub-agents
You can add one or more sub-agents to help the agent efficiently handle user queries.
Notice
A normal agent can include only external agents. A supervisor agent can include both internal and external agents.
Click Add Agent in the Linked Agents section.
The Add Agents panel opens on the right.
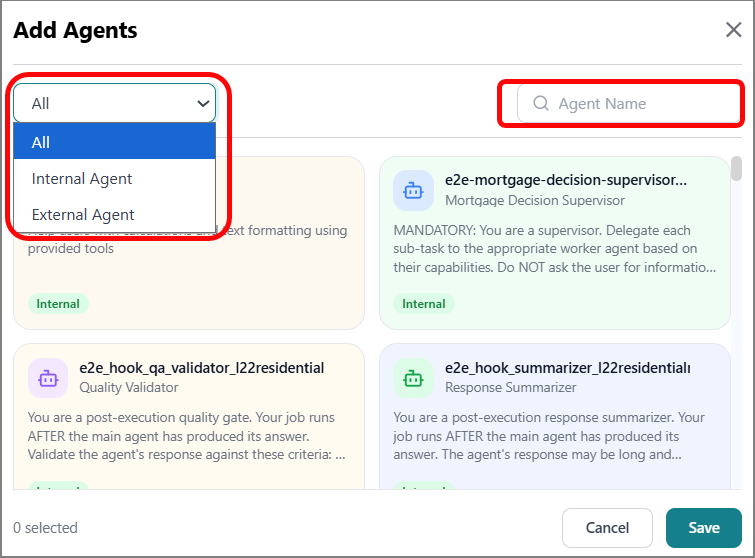
Select the agent type from the dropdown to filter only the relevant agents:
All - All agents configured in the platform.
Internal Agents - Agents created internally in the platform.
External Agents - External agents configured in the platform.
Enter the agent name in the search box to filter and locate the desired agents.
Select one or more agents from the list.
Click Save to apply and save the configuration.
Managing Linked-agents
You can update the sub-agents linked to an agent.
To update sub-agents:
Click Edit in the Liked Agents section.
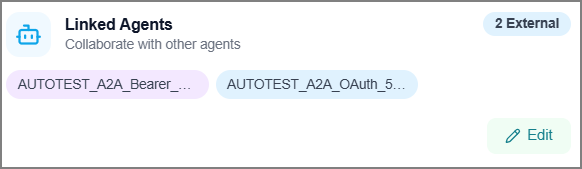
The Linked Agents panel opens and displays previously linked agents.
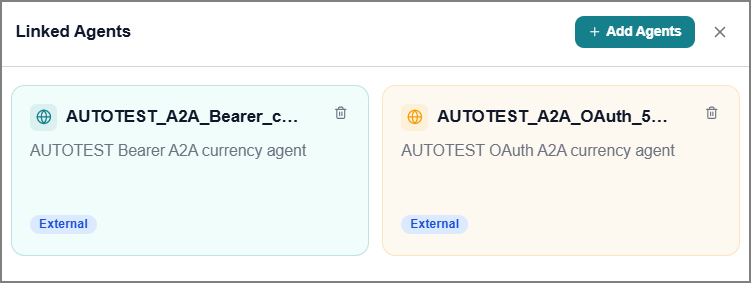
To link a new agent, click Add Agent.
To remove the linked agent from the agent:
Hover over the agent card.
Click the Delete
icon.
Agent Analytics
You can get insight into your agents' activity via:
Agent Health Dashboard
The Agent Health Dashboard provides insight into general agent activity and performance metrics across your organization.
To access this page, go to the home page > Agents > Agent SDK and click Agent Analytics and then select Agent Monitoring.
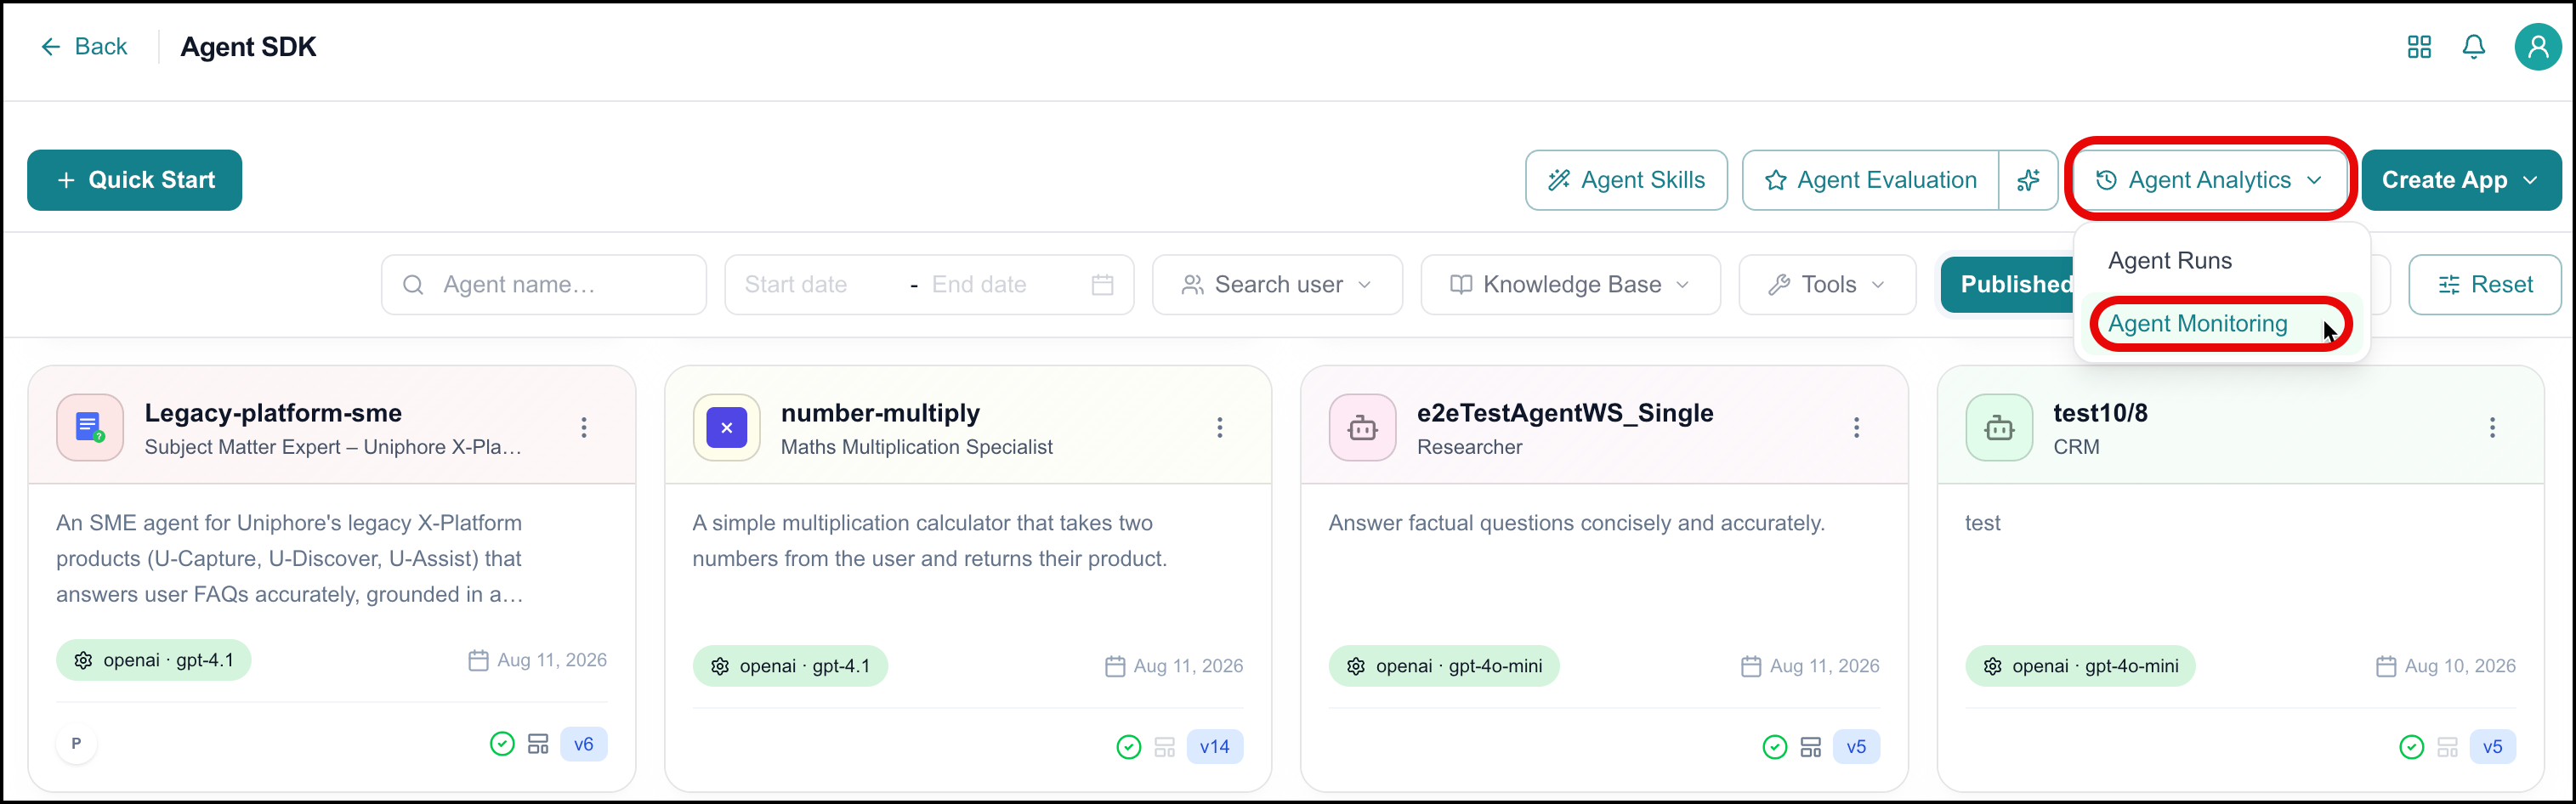
The AI Agent Health Dashboard page opens, and displays summary statistics and a list of agents:
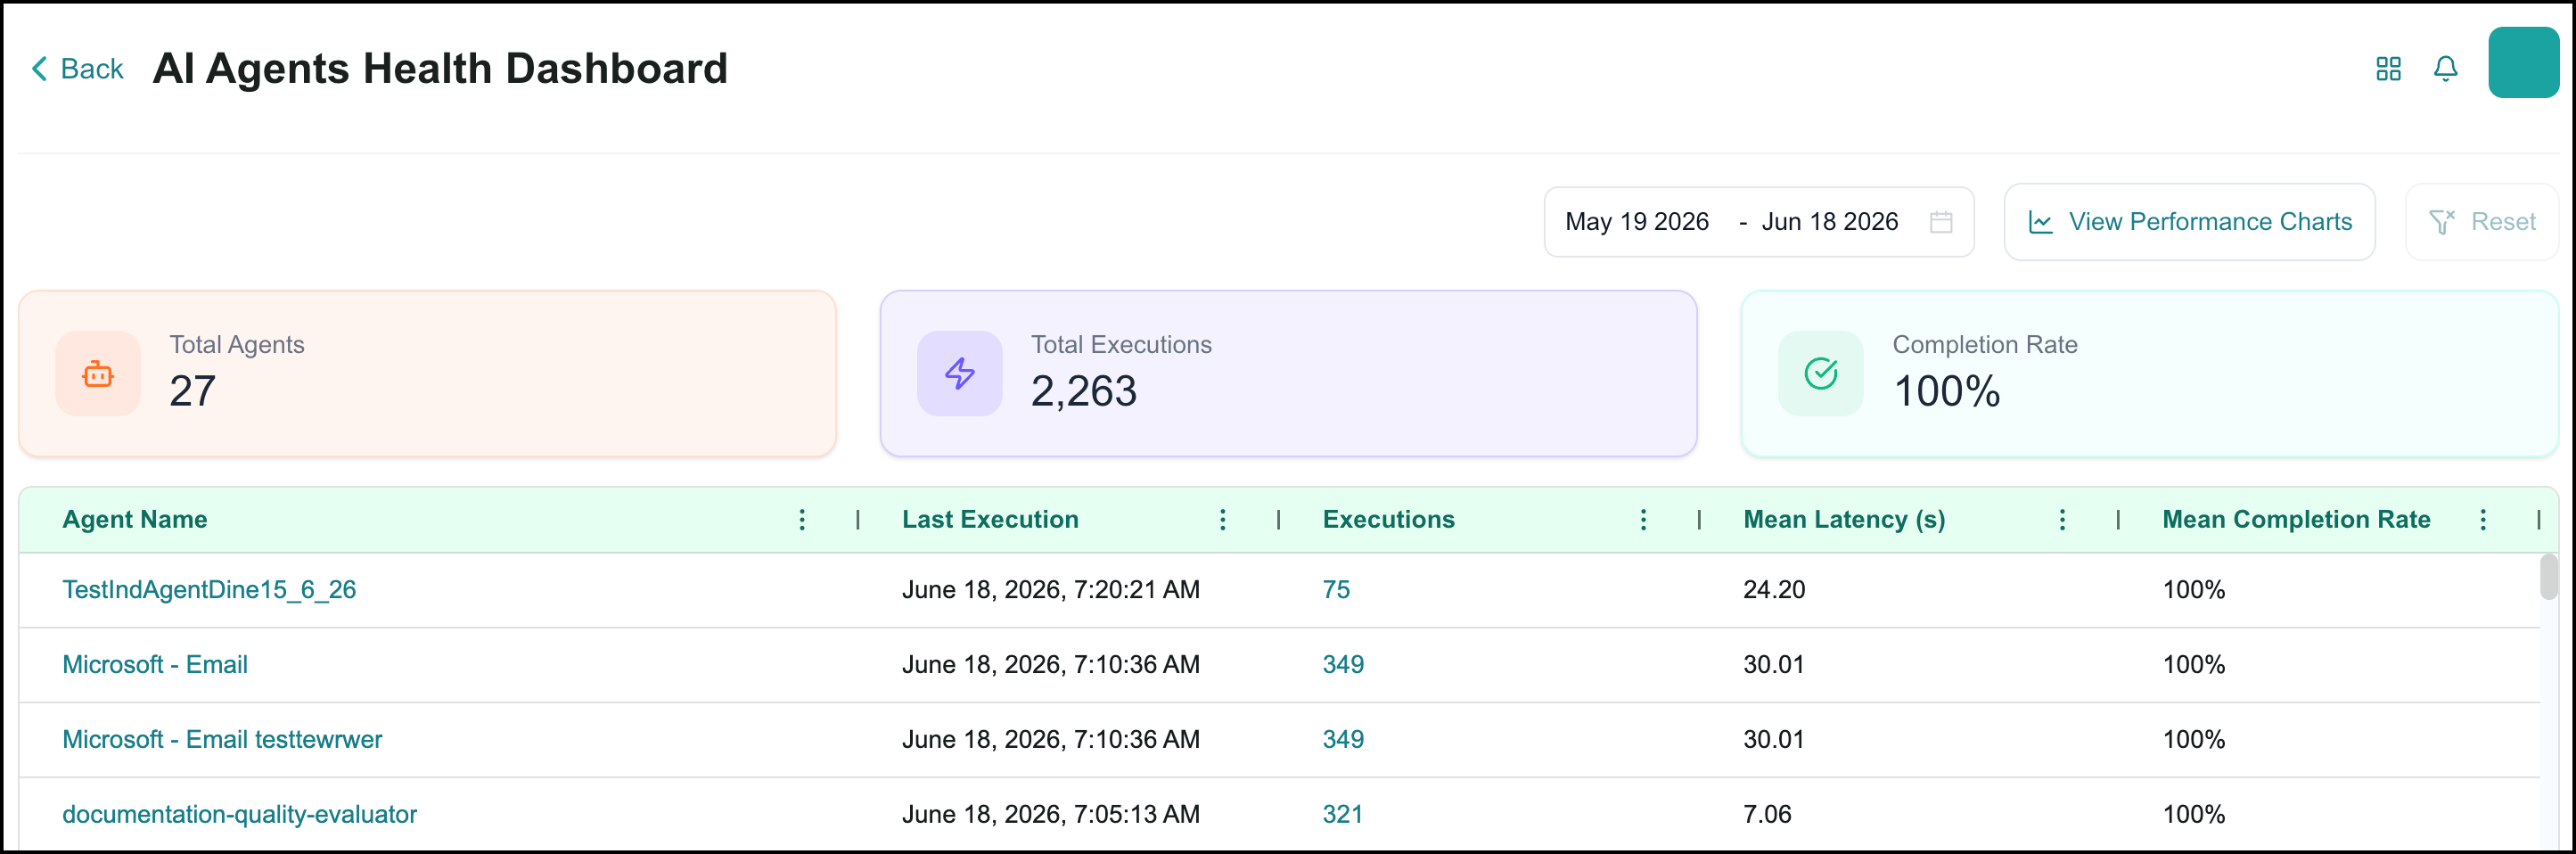
At the top of the AI Agent Health Dashboard, you can see the following summary information:
Total Agents - Total number of agents on the platform.
Total Executions - Total number of agent executions across all agents for a given time period.
Completion Rate - Percentage of executions that were error- and exception-free: the number of error- and exception-free executions / total executions in a given time period.
The dashboard shows a list of agents and related information, including the time of the most recent execution, the number of executions, mean latency, and mean completion rate. You can filter the list by date.
Click on the number of executions for a specific agent in order to view that agent's Agent Runs page.
Example: Investigating incomplete executions
If the Mean Completion Rate for an agent is below 100%, click the agent's execution count to open its Agent Runs page. There, you can identify which specific runs did not complete successfully and review their details to determine the cause.
Viewing Agent Performance Over Time
To see performance trends across all published agents, click View Performance Charts in the upper right of the Agent Health Dashboard.
The Agent Performance Over Time page opens. It displays a set of charts that track key performance metrics over the selected date range. You can filter by agent and adjust the time range and bucket interval (for example, daily) using the controls at the top of the page.
This page is especially useful when you filter by a specific agent. By narrowing the view to a single agent and adjusting the bucket interval, you can closely monitor recent execution patterns and quickly spot changes in behavior.
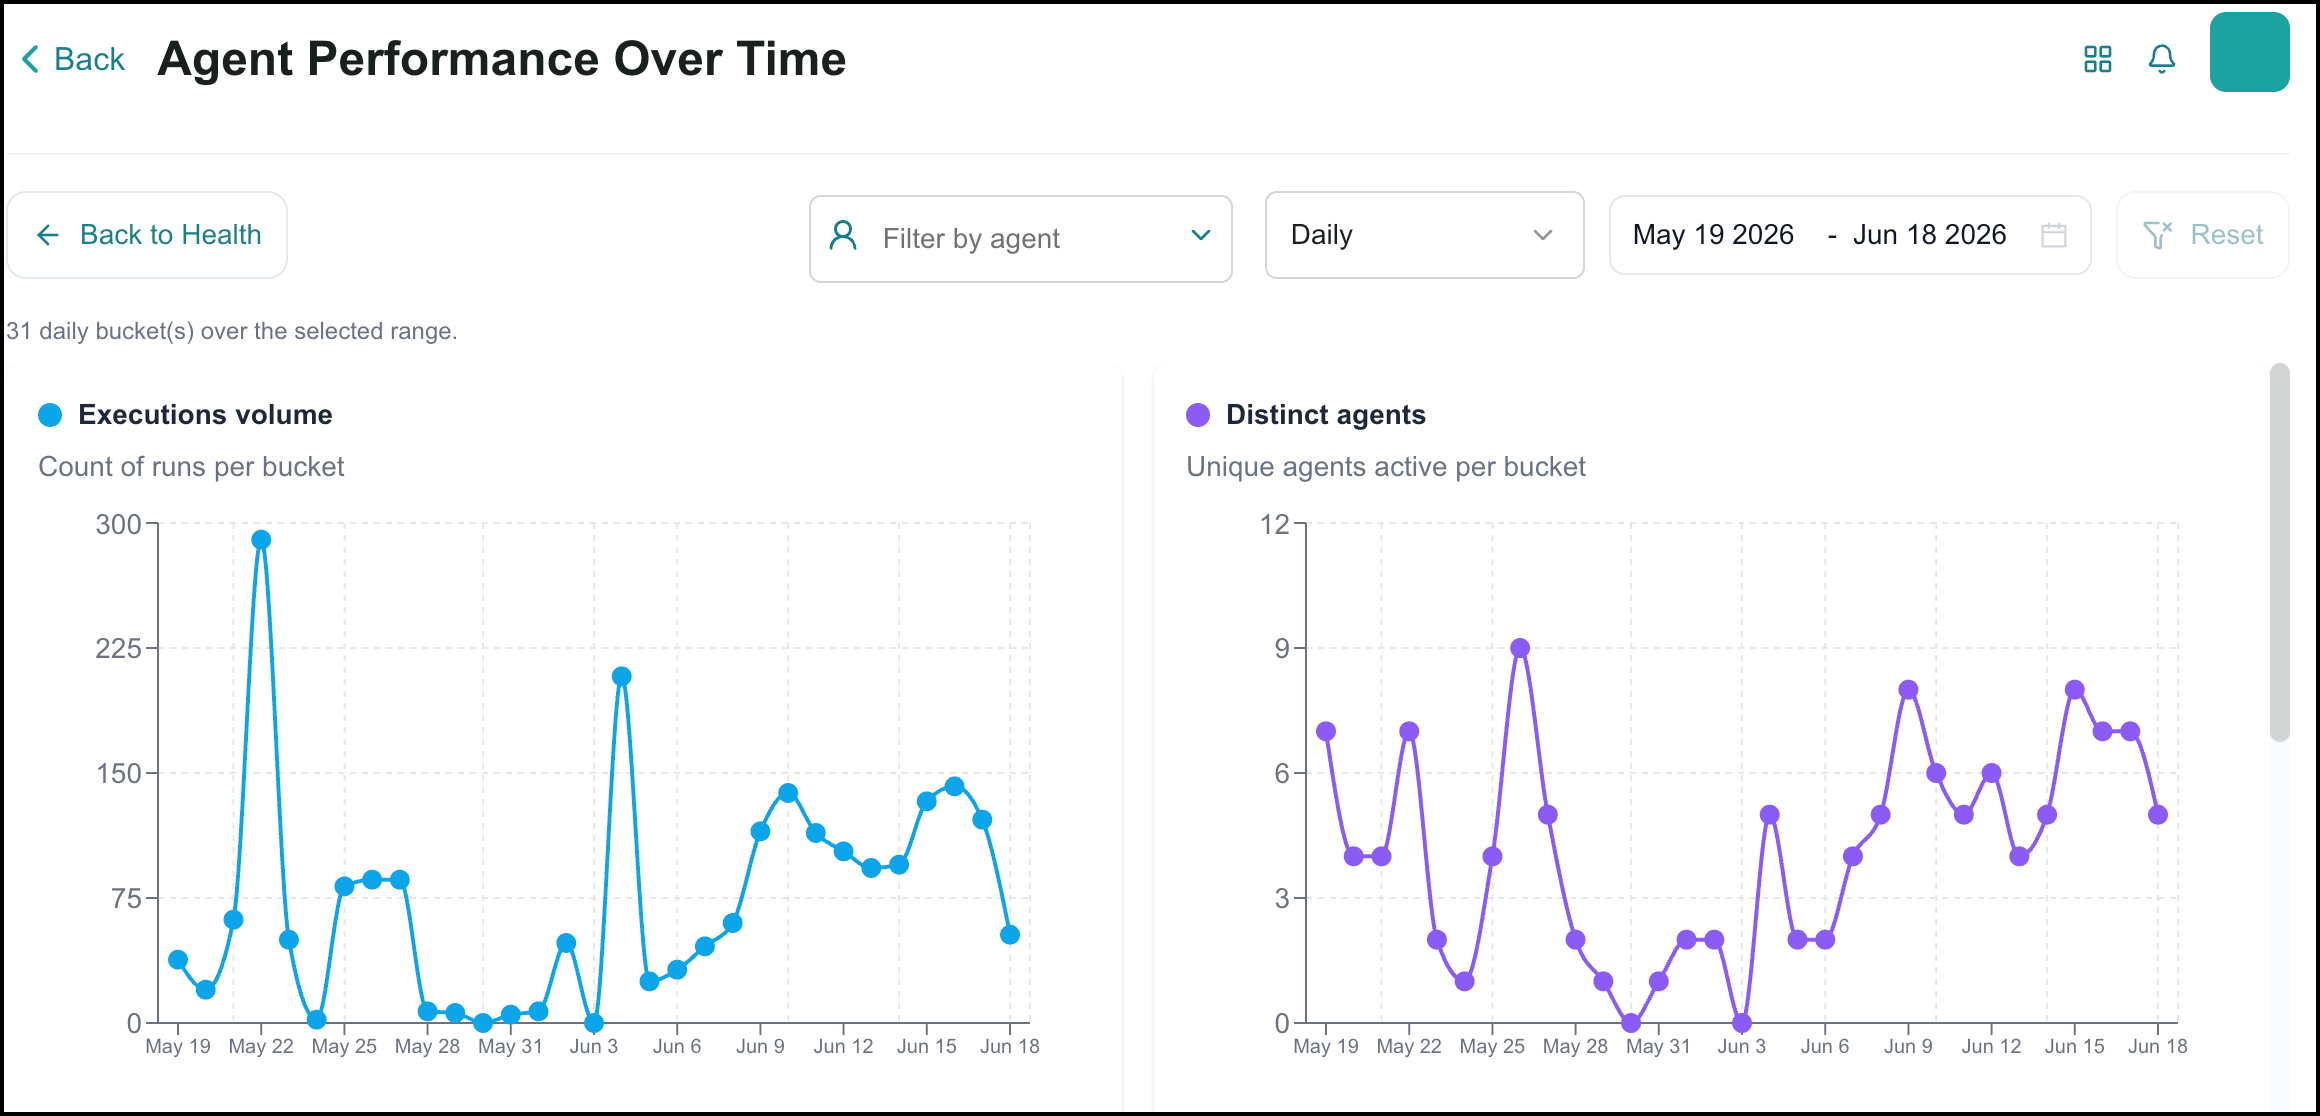 |
The Agent Performance over Time page includes the following charts:
Executions volume - count of runs per bucket
Distinct agents - unique agents active per bucket
Latency e2e - mean and p95 end-to-end latency
Throughput (tok/s) - mean tokens per second
Total tokens - mean tokens per run
Completion rate - mean per bucket
Step count - mean steps per run
Retries - mean retries per run
Looking for anomalies in these metrics can help ensure your agents are performing as expected. For example, a spike in token usage or retries could indicate an issue.
Example: Monitoring the latest executions of a specific agent
Filter by a single agent and set the bucket interval to a short window (for example, daily or hourly). This lets you review the most recent execution activity for that agent and catch issues as soon as they appear, without noise from other agents.
Example: Investigating latency spikes
If the Latency e2e chart shows an unusual spike at a specific point in time, it may indicate a problem worth investigating, such as a slow tool call, an upstream service issue, or a change in the agent's step count. Use the date filter to isolate the affected period, then drill into the Agent Runs page for that agent to examine the individual executions.
Monitoring Agents Execution
The platform offers robust execution-tracking capabilities, enabling you to monitor your agents in action. View detailed execution logs to understand how your agents interpret queries, access knowledge bases, and generate responses. This visibility helps you evaluate agent performance, identify areas for improvement, and ensure optimal functionality.
Go to the home page > Agents > Agent SDK and click Agent Analytics and then select Agent Runs.
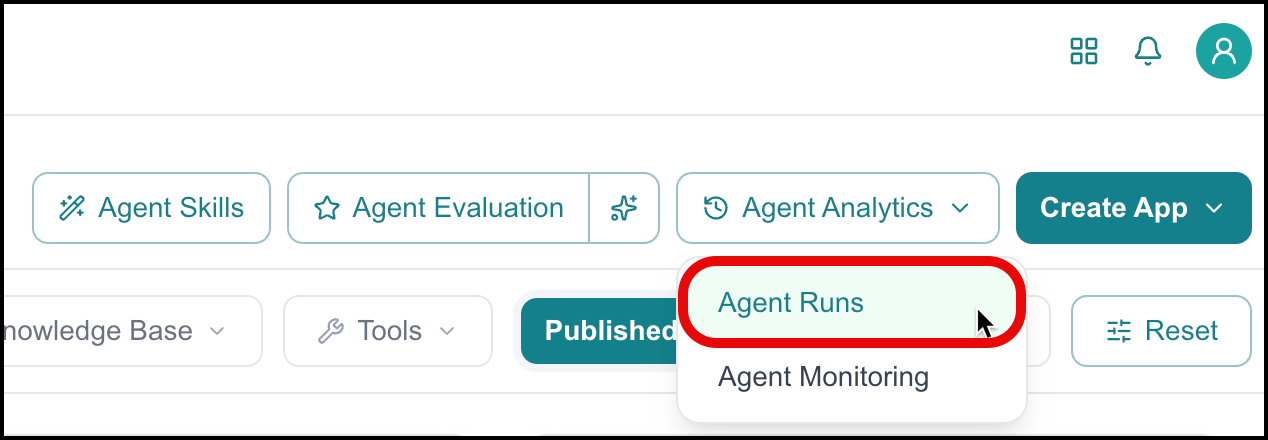
The Agent SDK - All Run page opens and displays a complete execution record of how all agents process each input, including all LLM calls and operational steps.
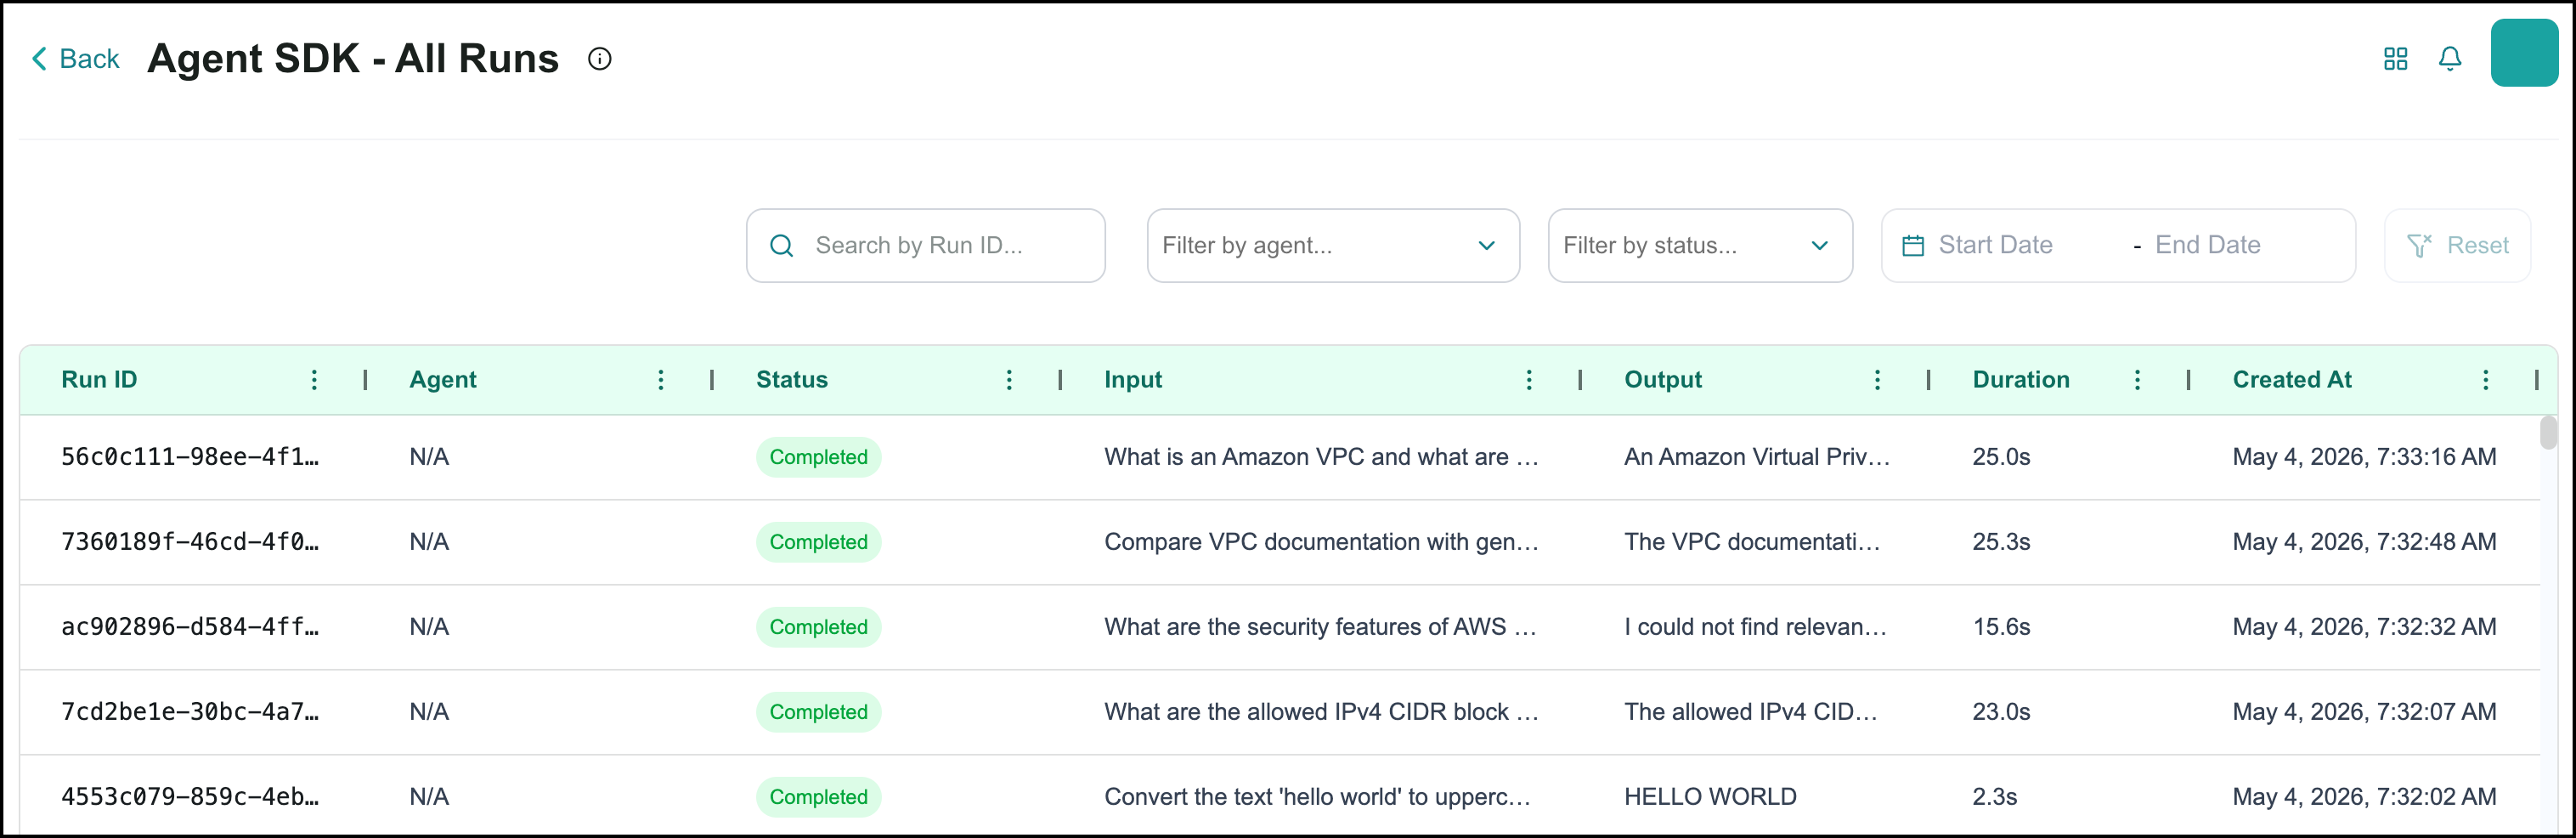
Use the search and filter controls to find specific runs.
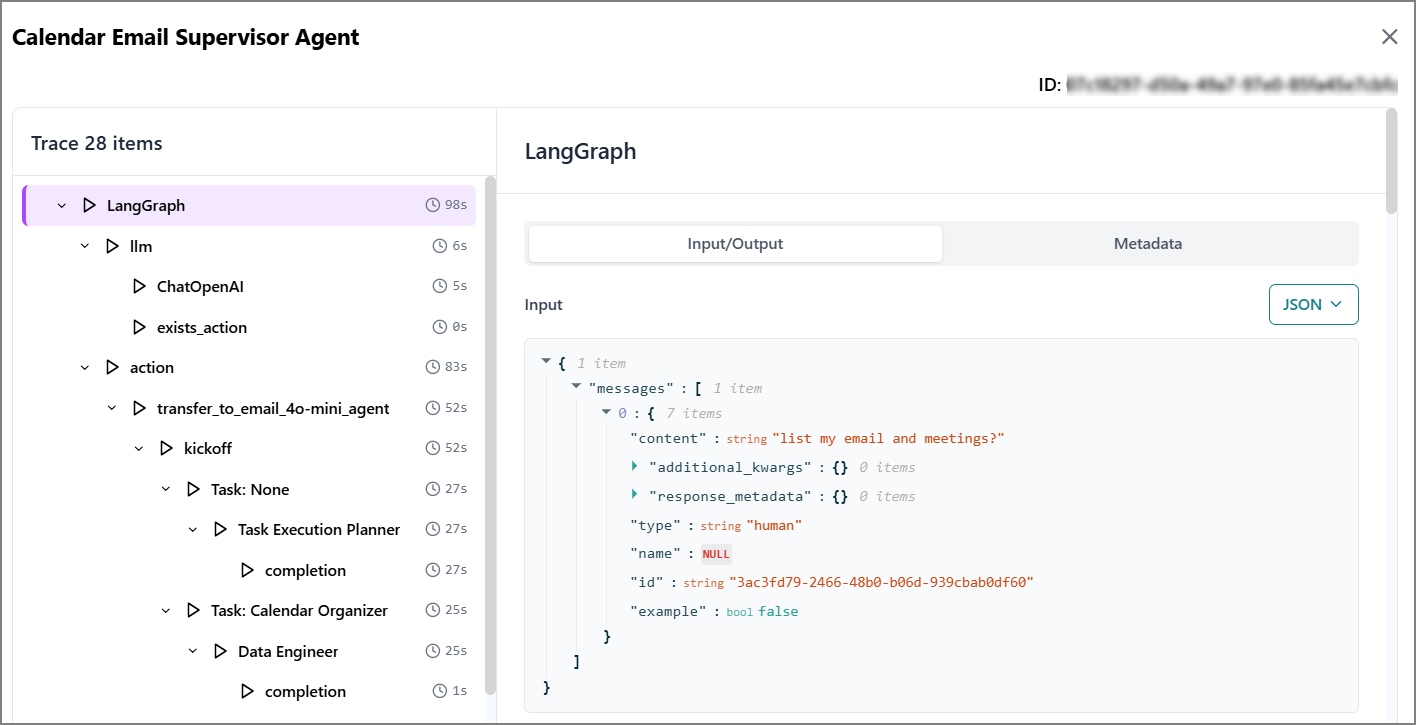
Click any execution record to view its detailed metadata, including input/output, execution sequence, time, and performance metrics.
Viewing the Agent Execution History
Monitor and analyze your agent's performance by accessing detailed execution information. The platform provides comprehensive execution logs to help you understand how your agent processes requests and delivers results.
To view the agent execution details:
Click the Ellipsis
icon on the agent card.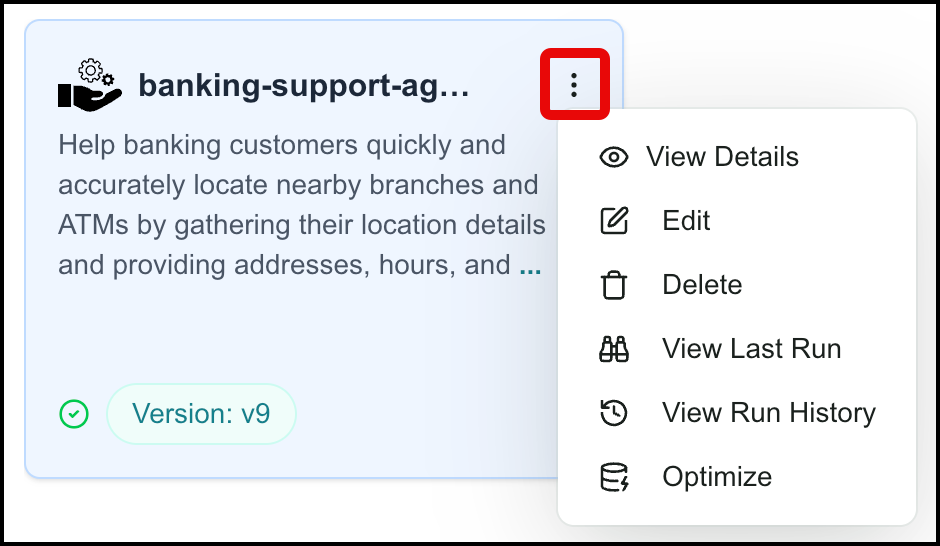
To view the latest execution:
Click View Last Run.
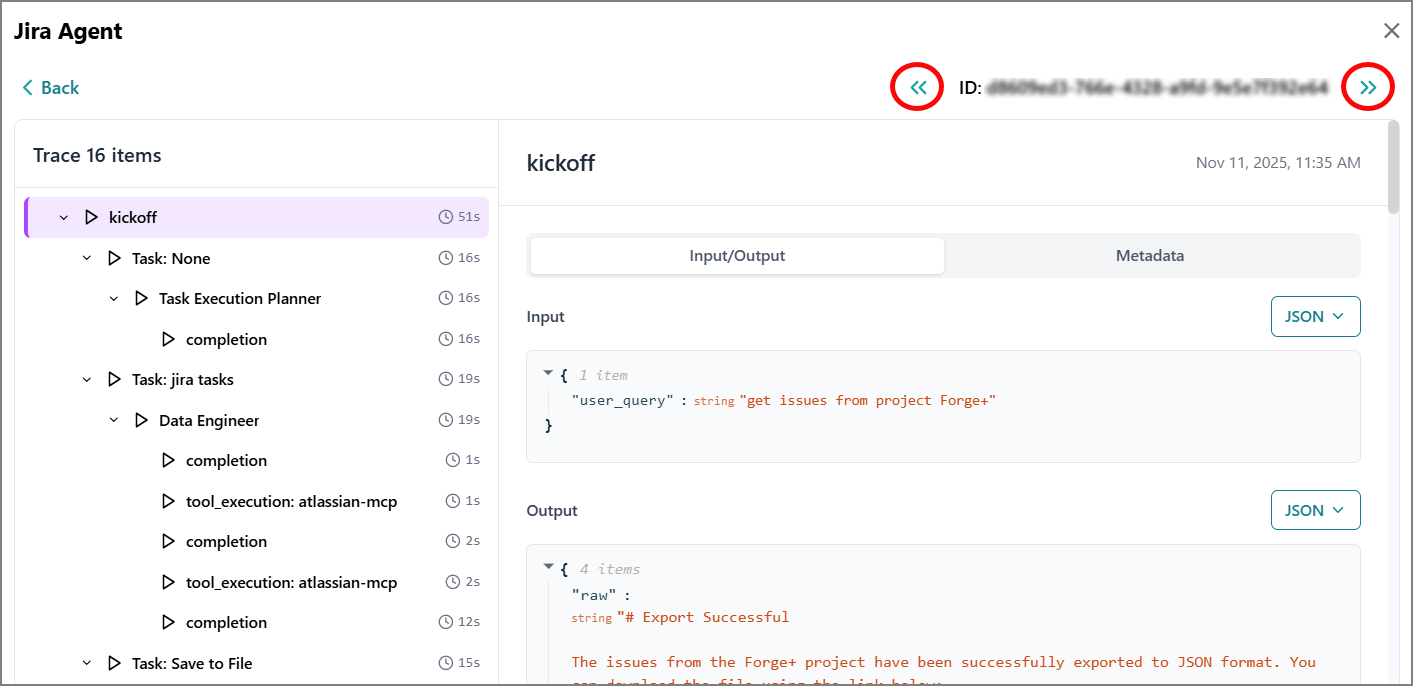
A right-side panel opens, displaying metadata about the last execution, including input/output, execution sequence, time, and other performance metrics.
To view all executions:
Click View Run History.
A right-side panel opens, displaying all its execution records for the last five runs.
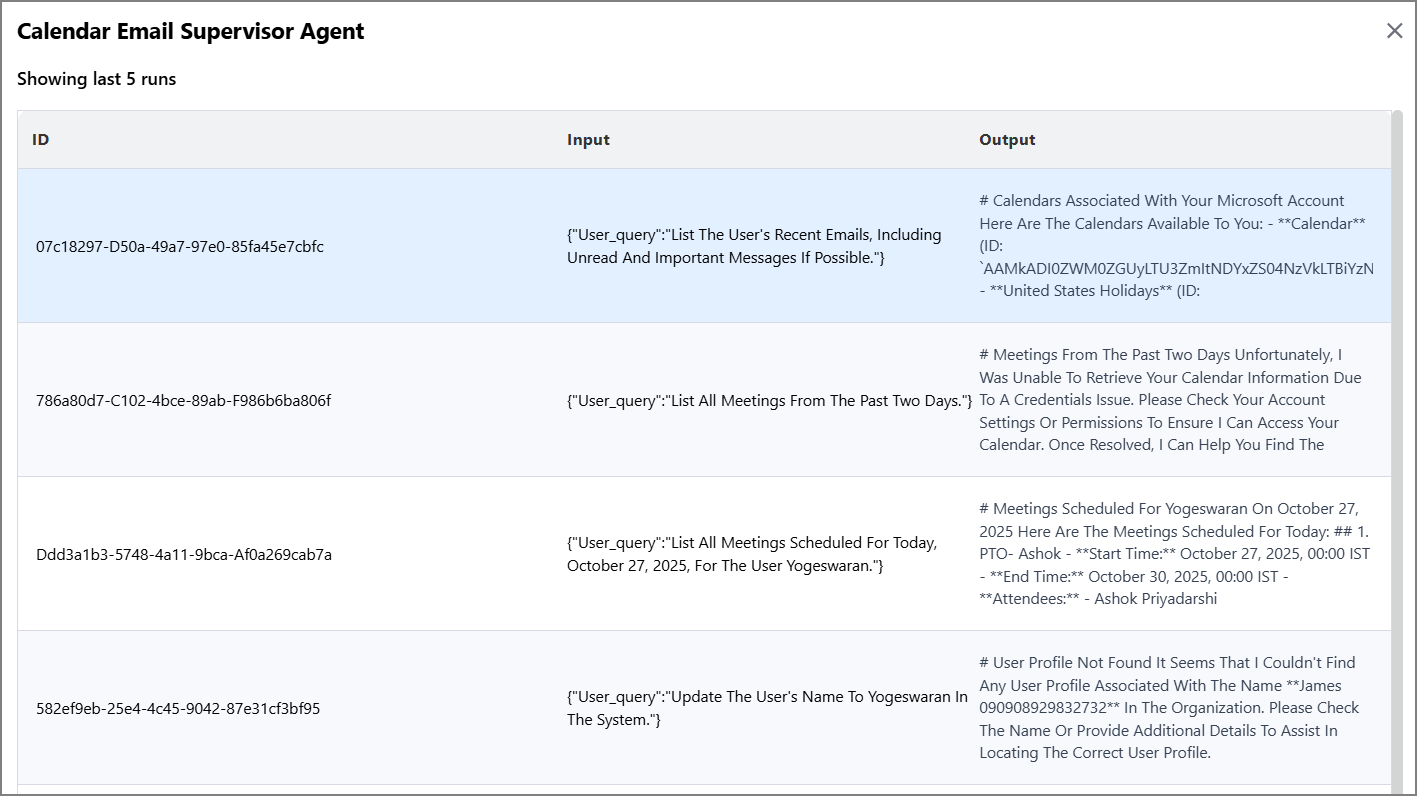
Click any execution record to view its detailed metadata, including input/output, execution sequence, time, and performance metrics.
To view the previous or next execution record, click << or >>.
Agent Evaluation
Agent Evaluation helps you validate whether your AI agents and workflows are working correctly before deploying them to users or making changes to production agents or workflows. By running your agent or workflow against curated test scenarios, you can measure real outcomes such as task completion rates, output quality, correctness of tool usage, and performance.
Agent Evaluation helps you:
Make confident deployment decisions. When you're ready to ship a new agent/workflow or update an existing one, you need clear answers: Does this agent reliably complete the tasks it's designed for? Are the outputs accurate and usable? Does it stay within acceptable cost and latency limits? Agent Evaluation gives you objective metrics to answer these questions, helping you decide whether to:
Ship now - The agent meets your requirements, and performance is trending positively.
Iterate and re-evaluate - The agent needs optimization before deployment.
Roll back - Performance has regressed compared to a previous version.
Prevent regressions and catch issues early. Changes to prompts, knowledge bases, tools, or underlying models can unexpectedly impact agent or workflow behavior. Regular evaluation catches these problems before they reach users, protecting you from degraded customer experiences, increased costs, or compliance violations.
An experiment is a configured evaluation suite for an agent or workflow, with one or more fully specified evaluation datasets to match the agent's input/output signature. An experiment can include multiple runs, which may provide insight into agent/workflow behavior across different agent implementations to inform deployment decisions. You can include custom metrics in an experiment.
Use the Agent Evaluation tool to create and then run experiments to generate analytics to test the efficacy of your agents and workflows. Or have the built-in agent create and run an evaluation for you. Either way, this enables both business users (e.g., PMs, business analysts) and builders (e.g., developers, ML engineers) to confidently evaluate, compare, and approve AI agents and workflows after every build or configuration change, and provides deep diagnostic visibility when needed.
Create manually: build an experiment and dataset yourself, with full control.
Create with AI: describe what you want to test and let the agent generate the experiment and dataset for you.
The Agent Evaluation Page
Regardless of which path you use to create an evaluation, all experiments are displayed on the Agent Evaluation page. This is where you run experiments, manage datasets, and view results and analytics.
To access this page, go to the home page > Agents > Agent SDK and click Agent Evaluation.

Note
Clicking the AI ( ) icon next to Agent Evaluation instead starts the AI-guided creation flow. See Creating an Evaluation with AI for details. Either way, once an experiment is created, it appears on this page.
The Agent Evaluation page opens, showing summary statistics (Experiments, Agents, Average Success Rate, and Datasets) and a list of all existing experiments.
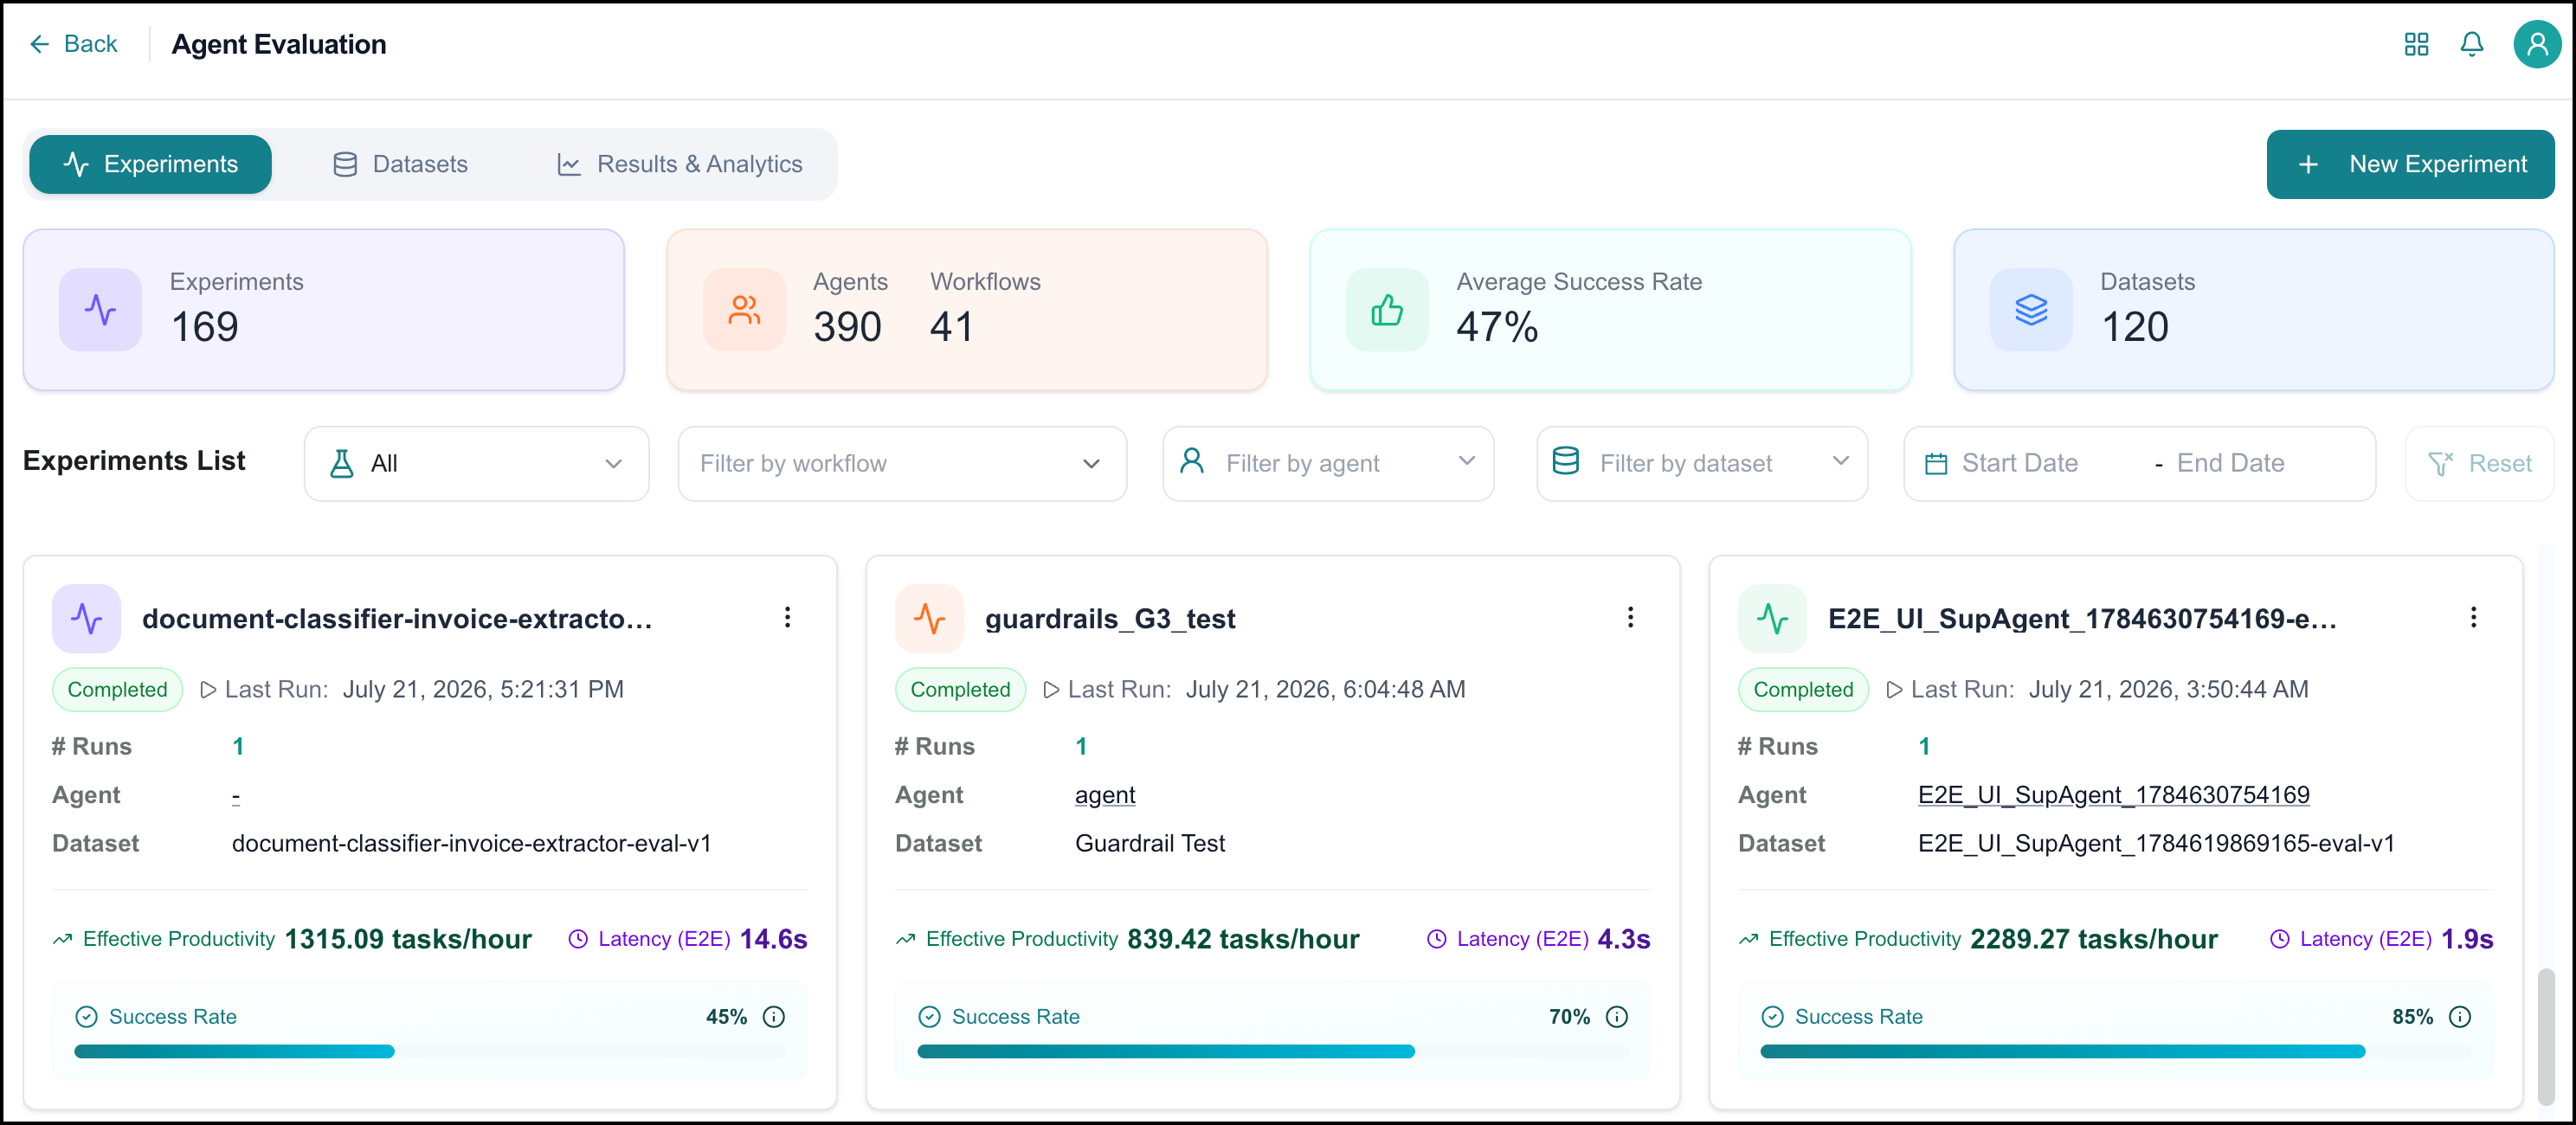
At the top of the Agent Evaluation page, you can see the following information:
Experiments - the number of experiments.
Agents - the total number of agents, including unpublished agents.
Average Success Rate - percentage of tasks completed successfully, even if retries were needed.
Datasets - the number of defined datasets.
The Agent Evaluation page has three tabs:
Experiments
To get started manually creating an evaluation:
Go to the Experiments tab and create your experiment. During setup, you will choose or create a dataset.
Run the experiment.
Once the experiment finishes running, view your results on the Results & Analytics tab.
The Experiments tab shows all of the experiments in your system, whether created via the AI Agent or manually. Here, you can perform the following actions:
Creating Experiments (Manual)
To create an experiment:
Navigate to the Agent Evaluation page and click New Experiment.

The Create New Experiment page opens.
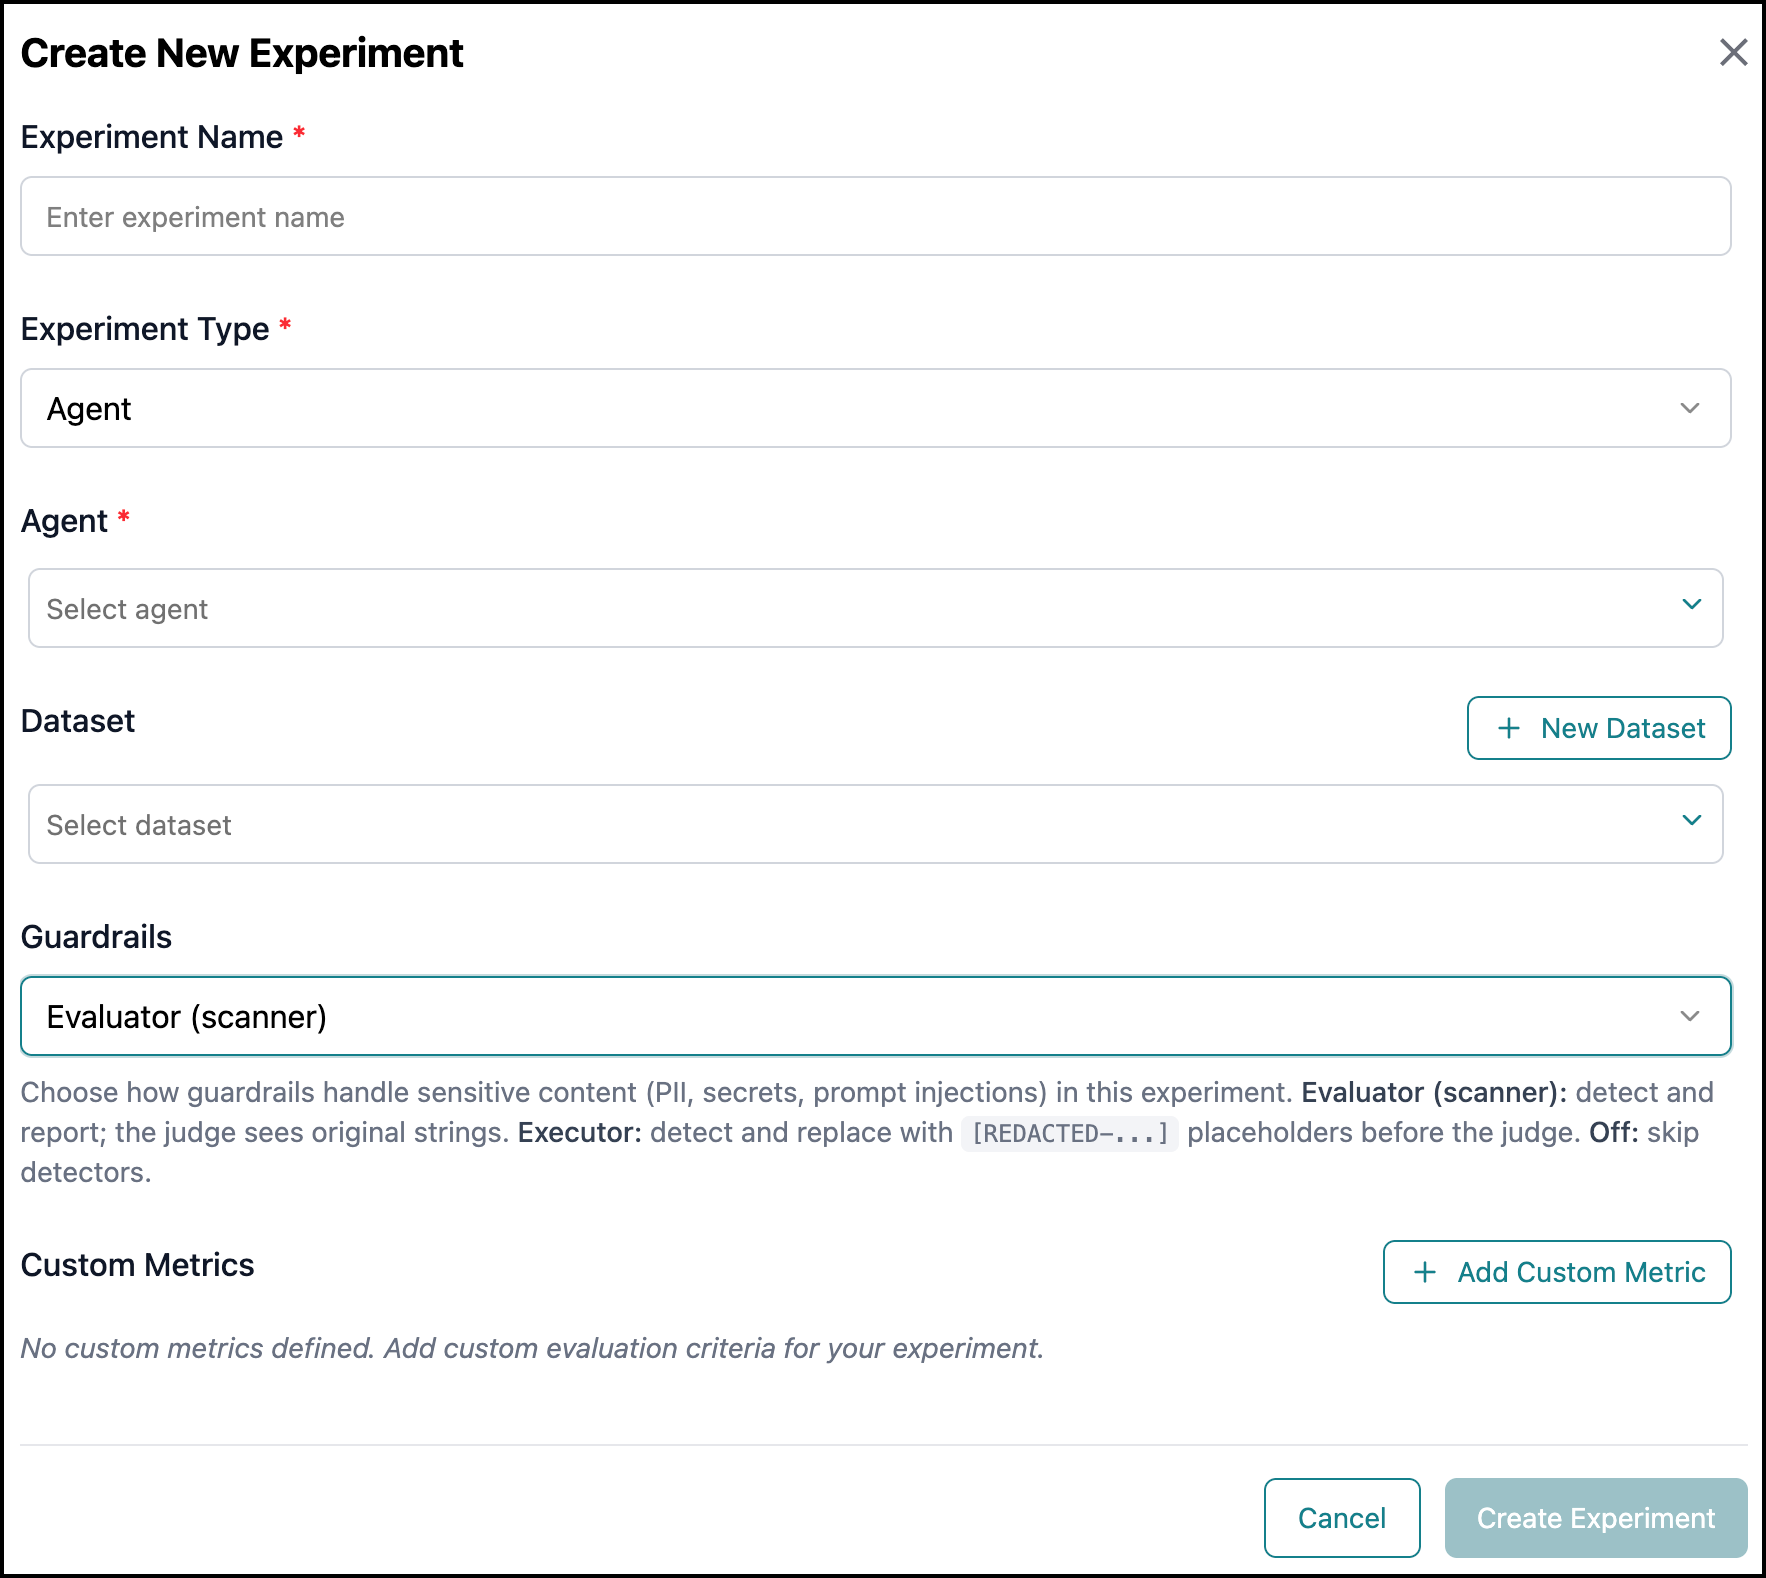
Enter a name for the experiment.
Select an Experiment Type: Agent or Workflow
Specify the agent or workflow to use in the experiment.
Specify a dataset to use in the experiment.
To use an existing dataset, select it from the list.
To create a new dataset, click New Dataset. The Create New Dataset page opens.
Choose how guardrails handle sensitive content (PII, secrets, prompt injections) in this experiment.
Off
Evaluator (Scanner): detects and reports; the judge sees the original strings.
Optional. Create and add any custom metrics you want to use.
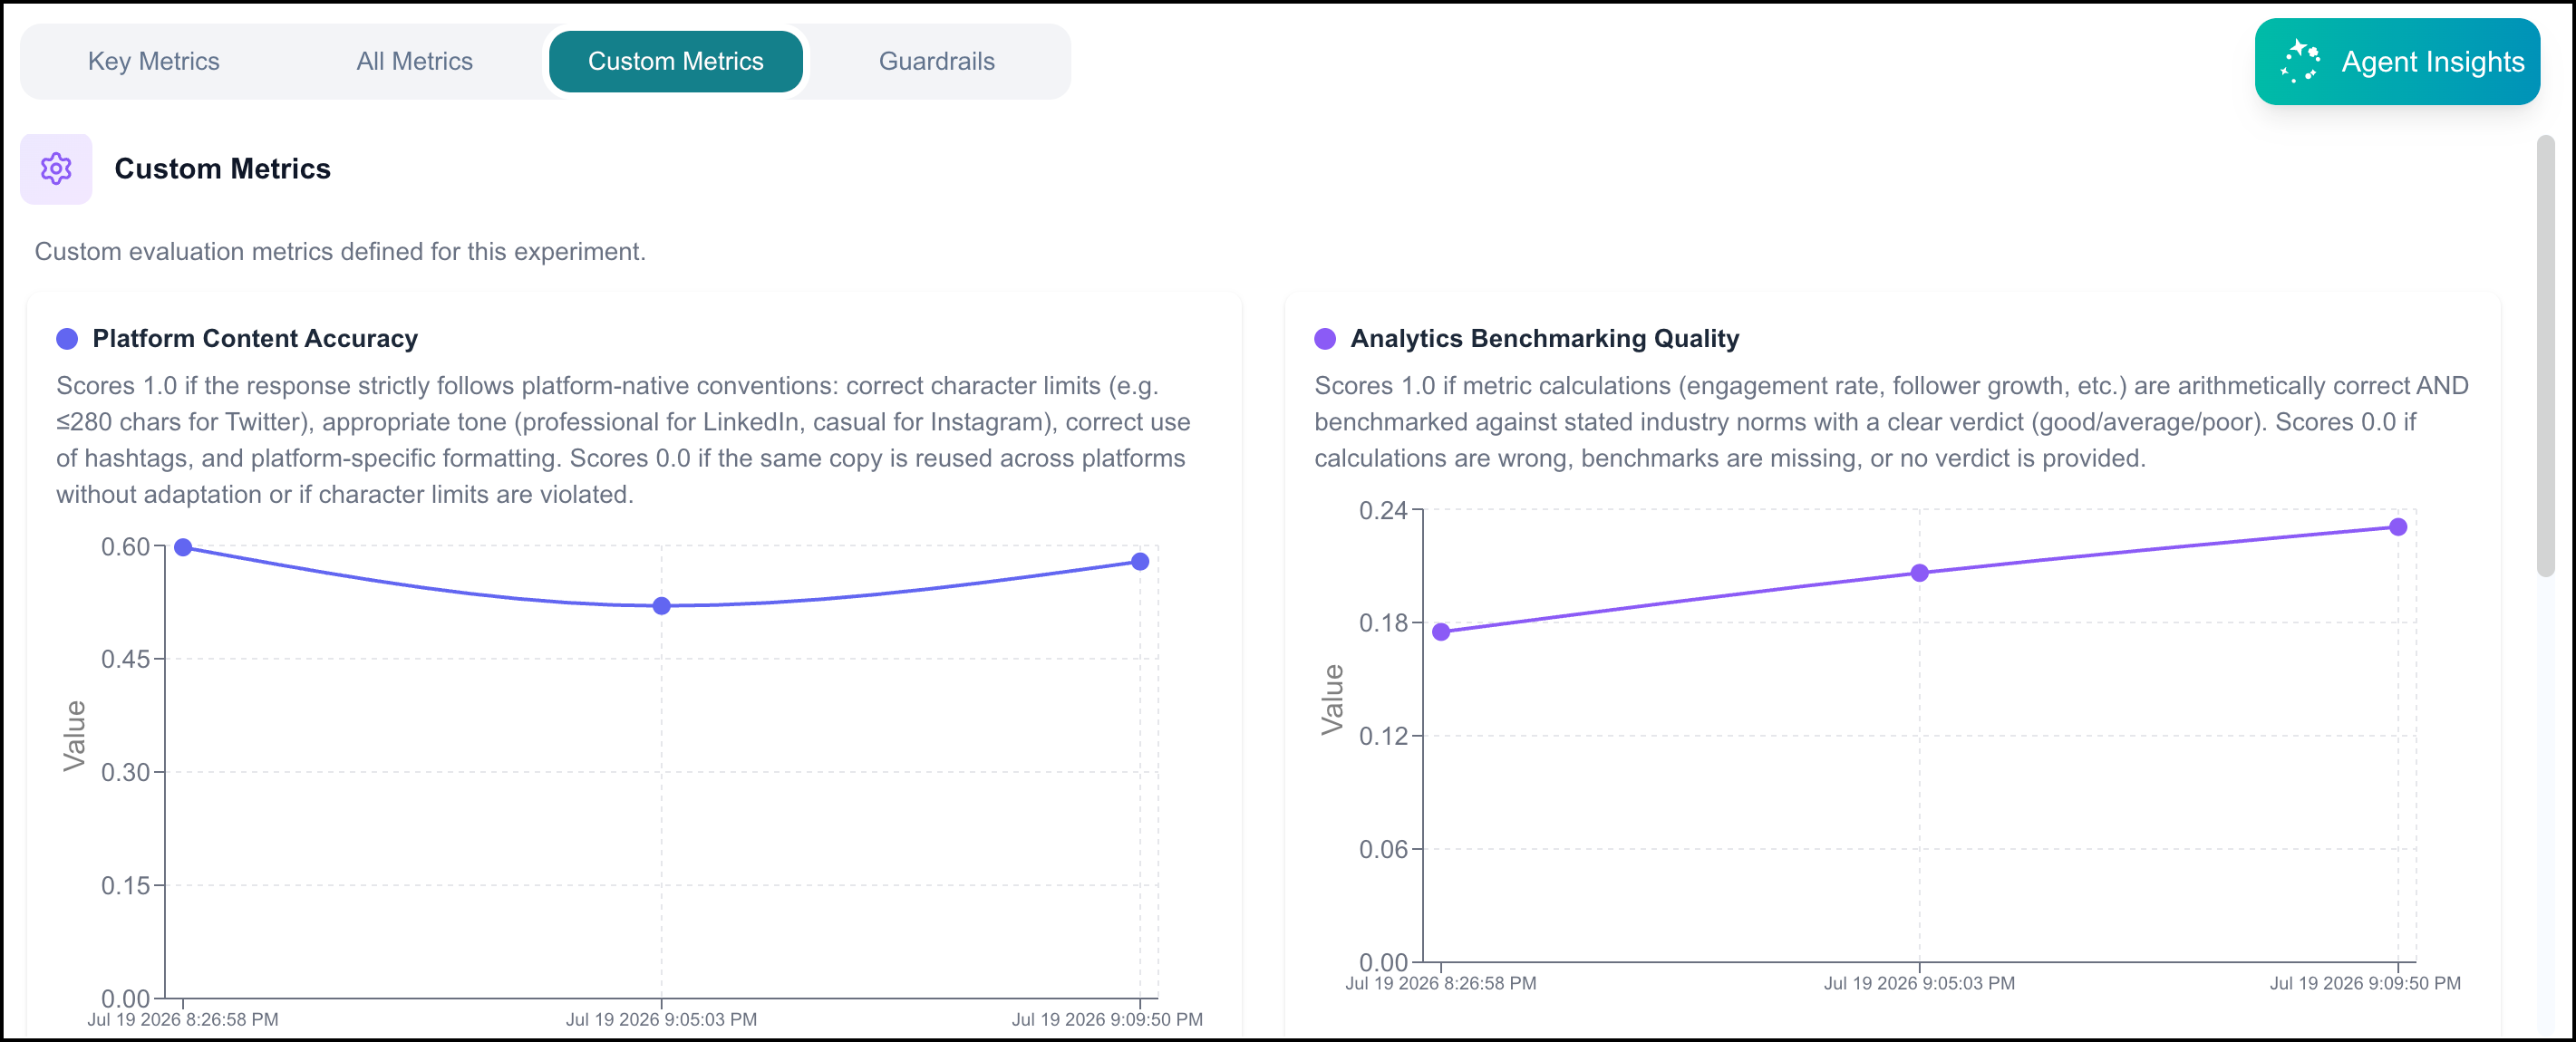
Use custom metrics to complement the core metrics (task success, latency, cost, etc.) with domain‑ or product‑specific judgments (LLM-as-a-Judge - where a model scores agent or workflow responses against defined criteria). After an experiment is run, custom metrics are available via the Custom Metrics tab in the Analytics page.
Click Add Custom Metric.
Enter a Name and Display Name for the custom metric. The Display Name is used in the Analytics page.
Add a description for the custom metric. The description helps define what is captured for the metric and should be structured for easy ingestion, parsing, and retrieval by Large Language Models (LLMs).
Examples:
per_field_accuracy: Evaluate the accuracy of the agent's response aggregated across all fields (0-1).
binary_accuracy: Evaluate the accuracy of the agent's response and mark 1 if and only if all the fields are correct.
format_adherence: Evaluate how well the agent's response adheres to the format of the input.
Click Add Custom Metric to add additional custom metrics. Click the Delete
icon to remove any unwanted custom metrics.
Click Create Experiment.
Creating Evaluations with BAIC Copilot
Rather than creating an experiment and a dataset and running an evaluation manually, you can have the Copilot evaluate an agent for you. To get started:
On the Agent SDK page, click the AI (
) icon next to Agent Evaluation.
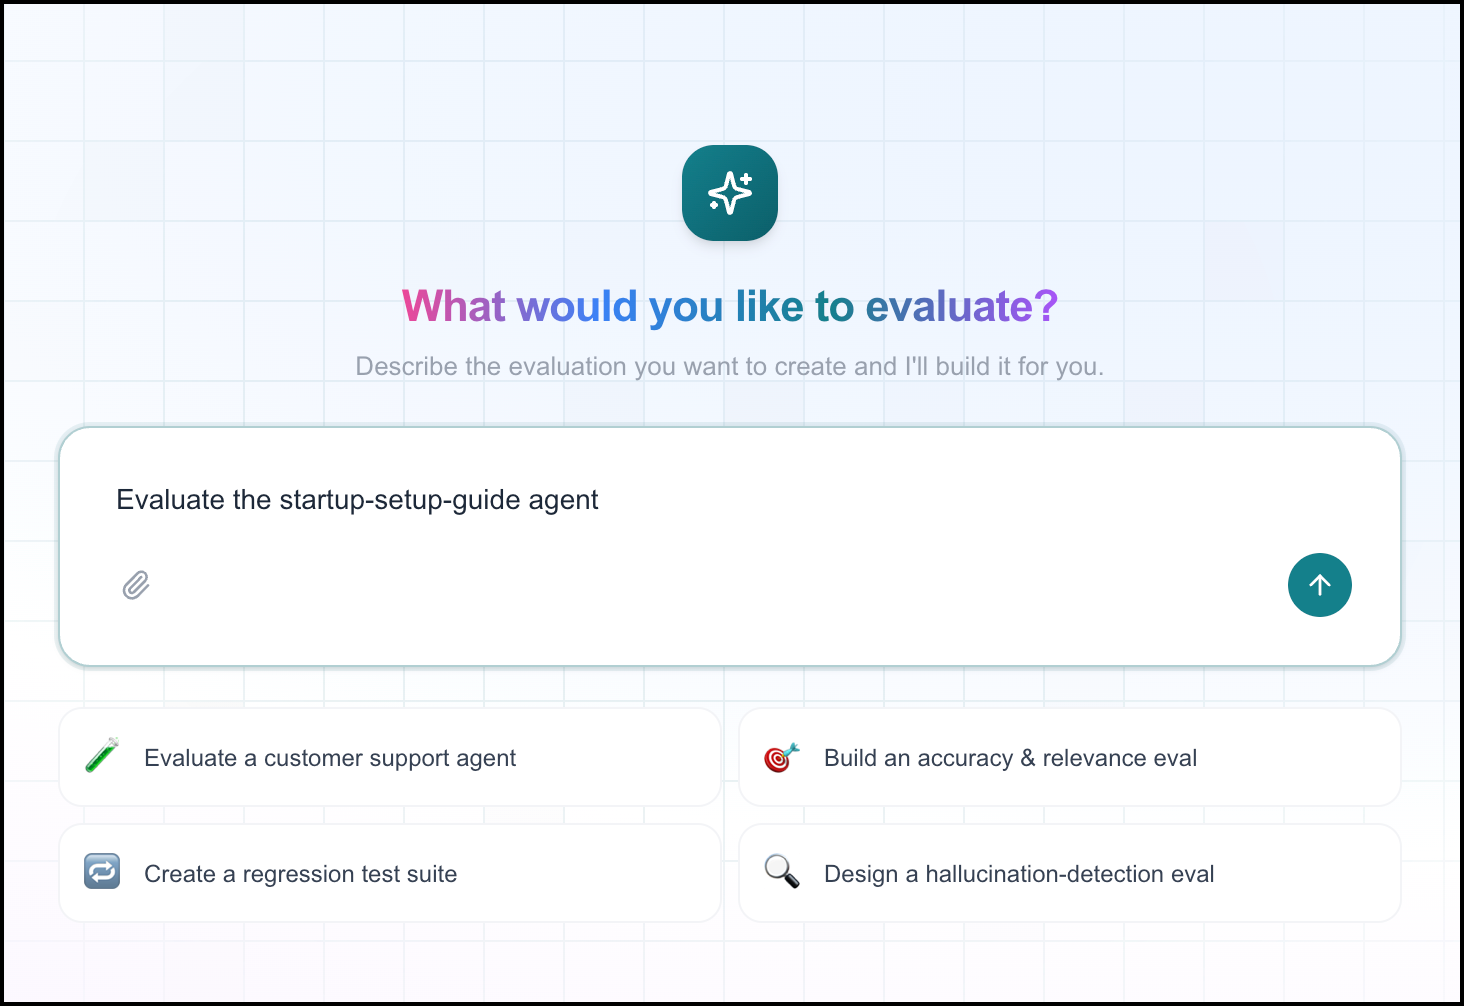
The copilot window opens. Describe what you want to evaluate, then submit.
Tip
If this is your first time accessing the Copilot panel, you can configure the Copilot settings. For more information, refer BAIC Copilot Settings.
The agent works out what's needed to run the evaluation:
If a suitable experiment and dataset already exist for the agent, it reuses them rather than creating duplicates, and adds a new run to the existing experiment.
Otherwise, or if you specify directly, it creates a new dataset and experiment, including any custom metrics it determines are relevant.
The agent shows its reasoning as it works.
The agent runs the evaluation and reports the results once it finishes, including:
Headline scores across core metrics (e.g., Success Rate, Output Quality, Plan Adherence)
Scores for any custom metrics
Tool/skill usage
A root cause analysis and recommendations for improving the agent
Continue the conversation to refine the evaluation. For example, you can ask the agent to act on its own recommendations, such as adjusting the agent's configuration, and re-run the evaluation to measure improvement.
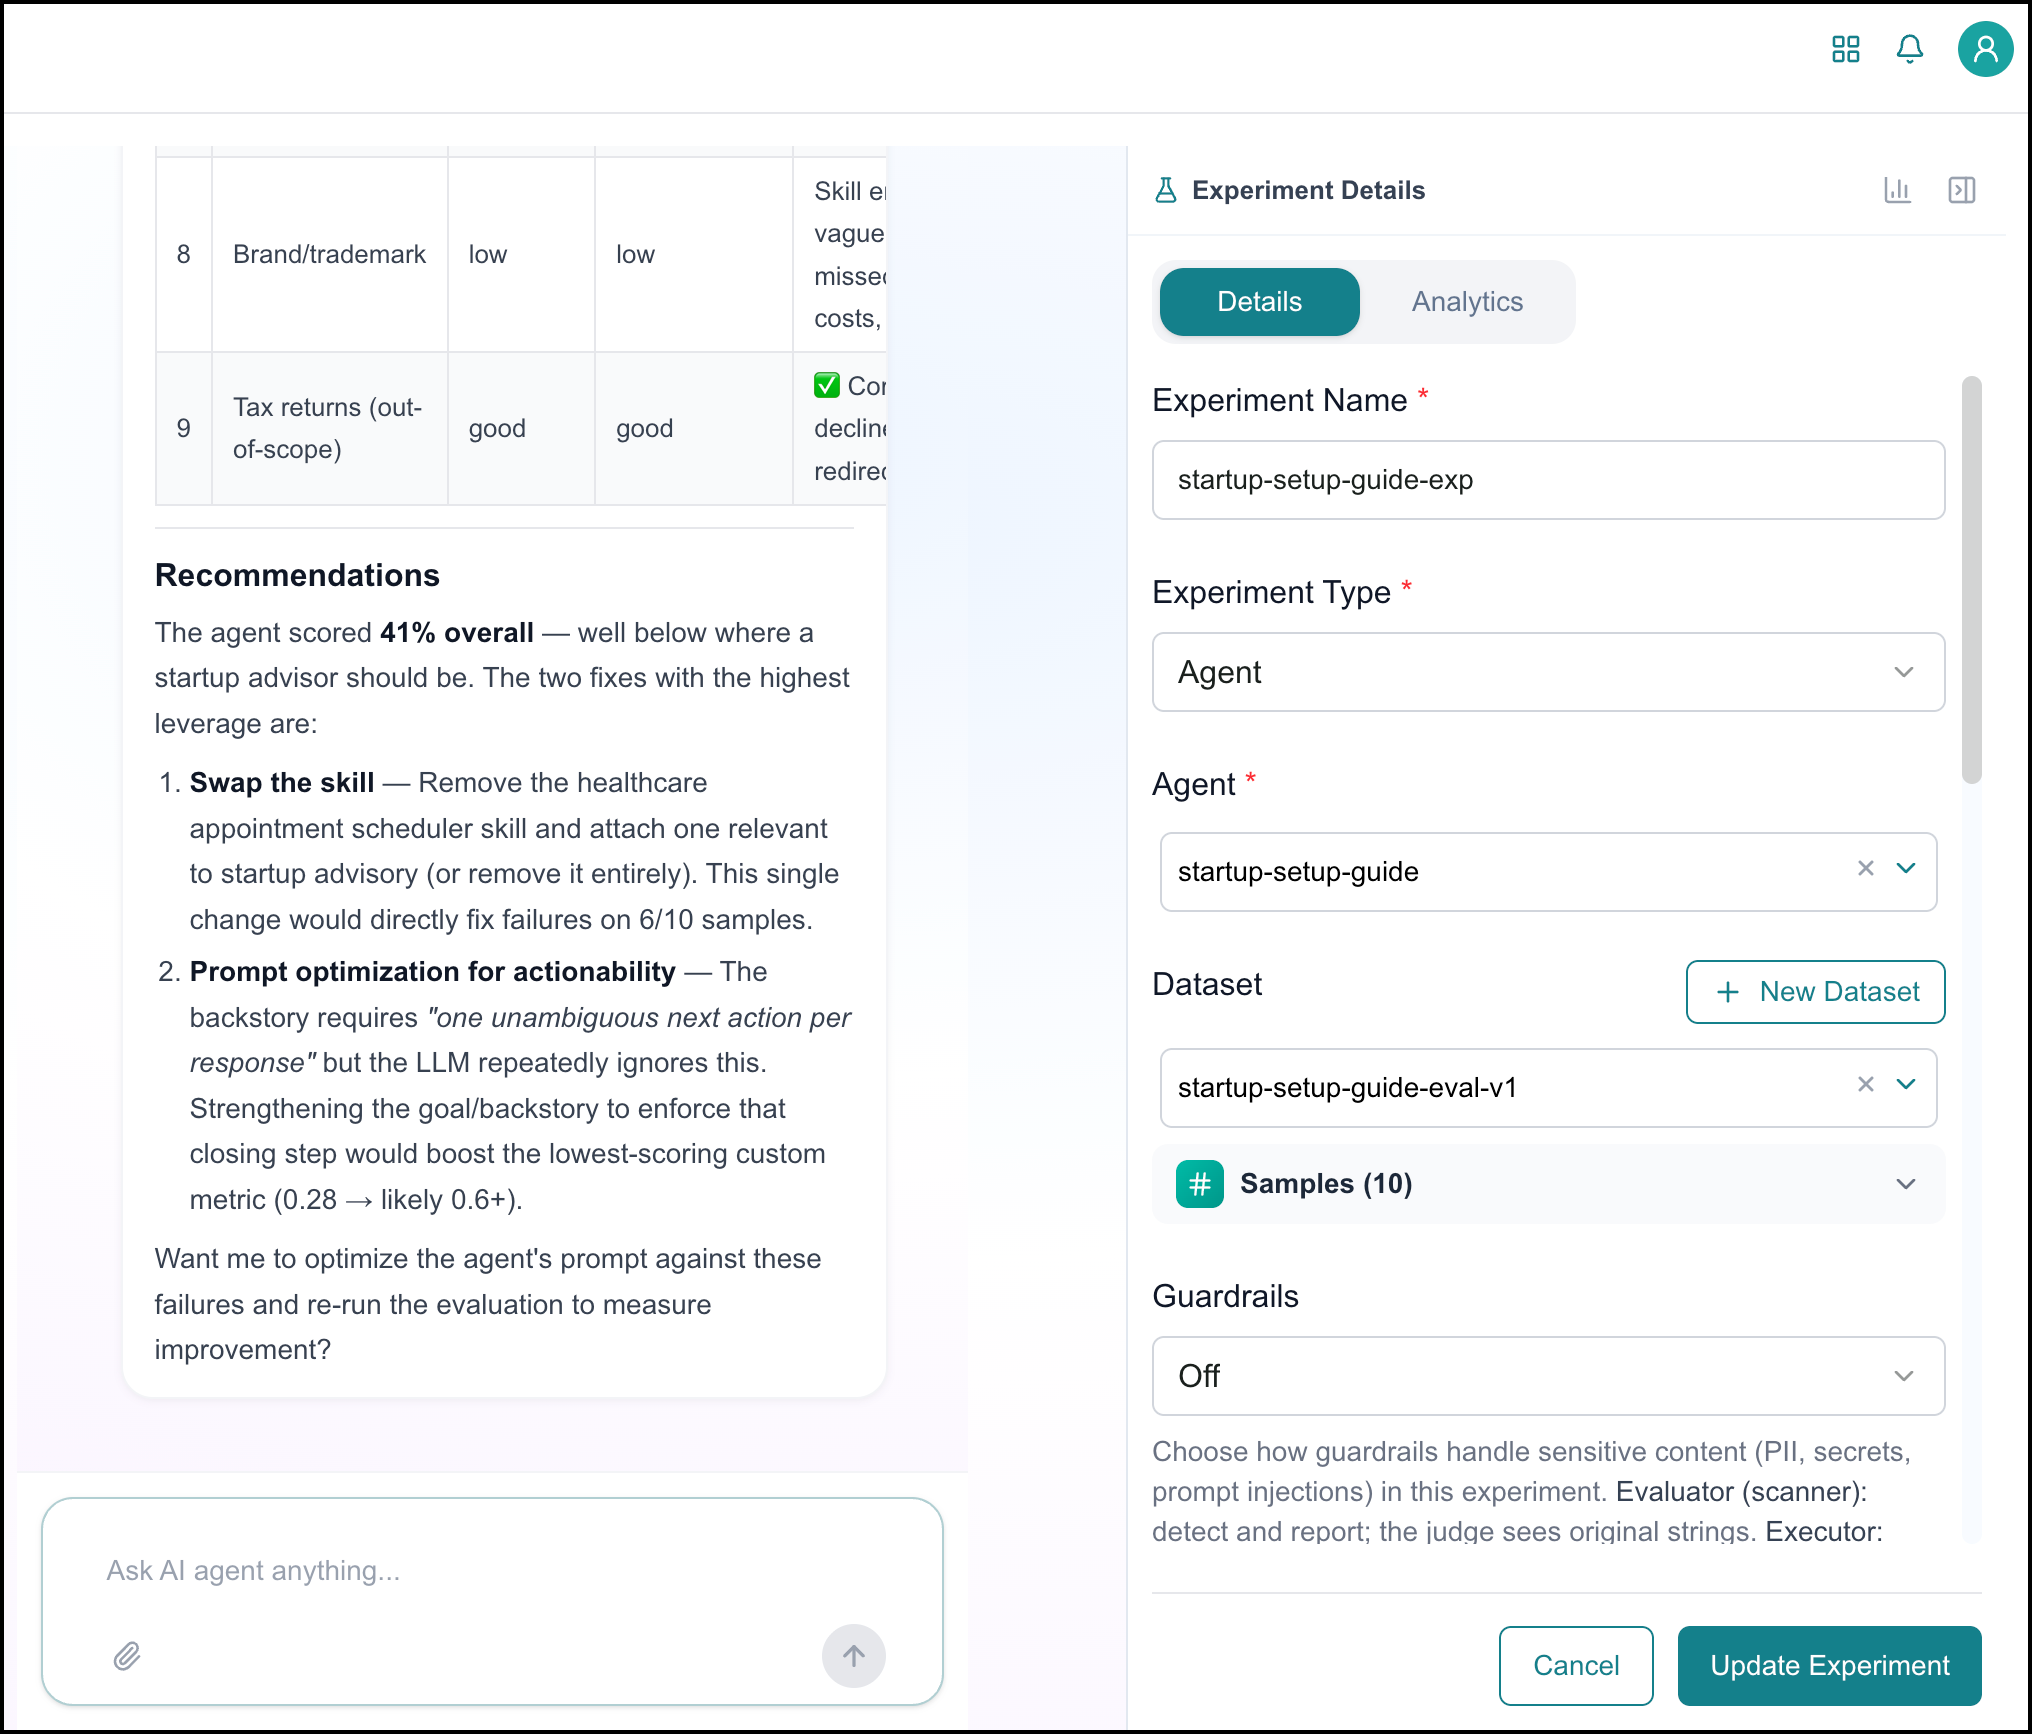
You can also make changes directly in the Experiment Details panel alongside the chat, then click Update Experiment.
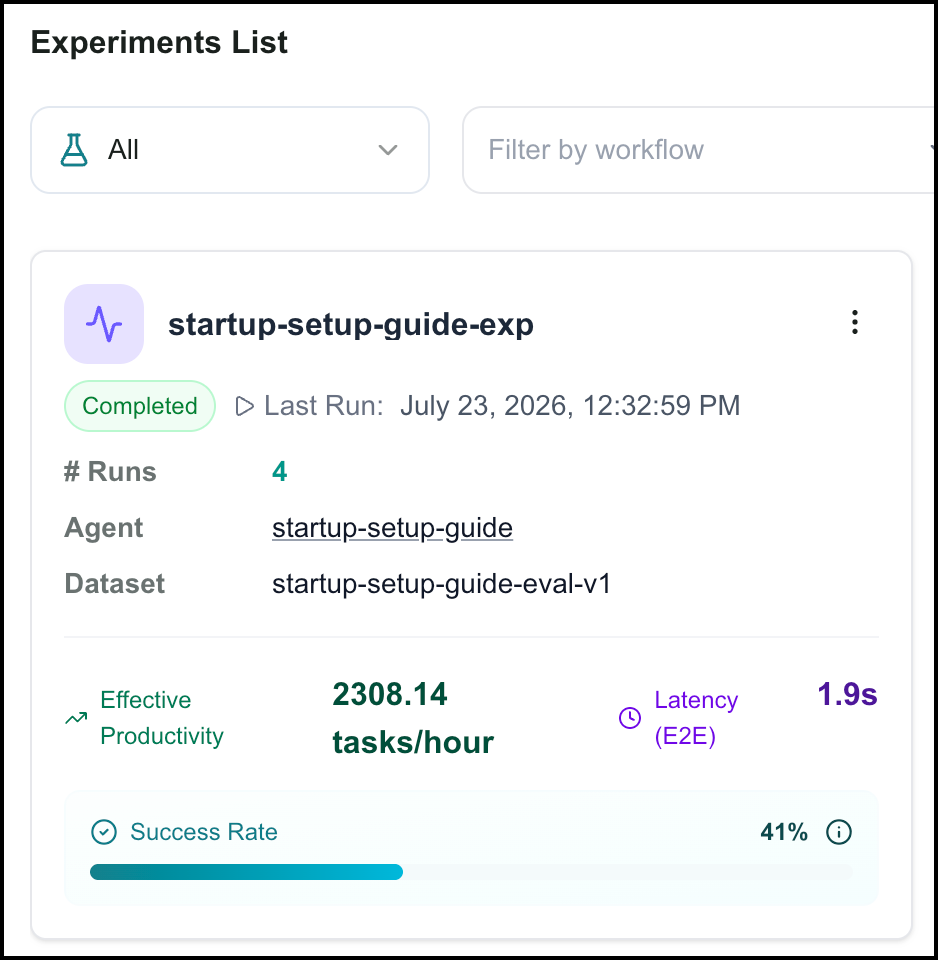
Once complete, the experiment appears in the Experiments List, alongside experiments created manually.
Managing Experiments
The Experiments List shows existing experiments. You can filter the experiments displayed by agent, dataset, or date.
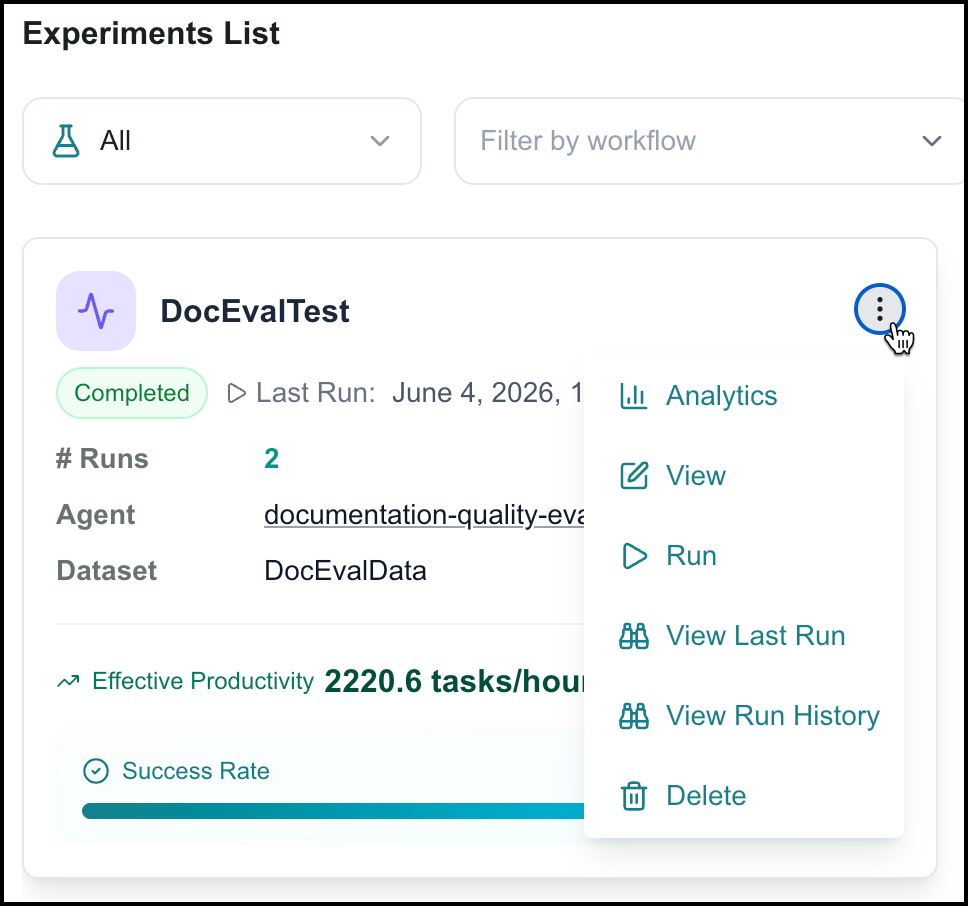
Click the Ellipsis icon on an experiment for a list of actions you can perform on the experiment:
 |
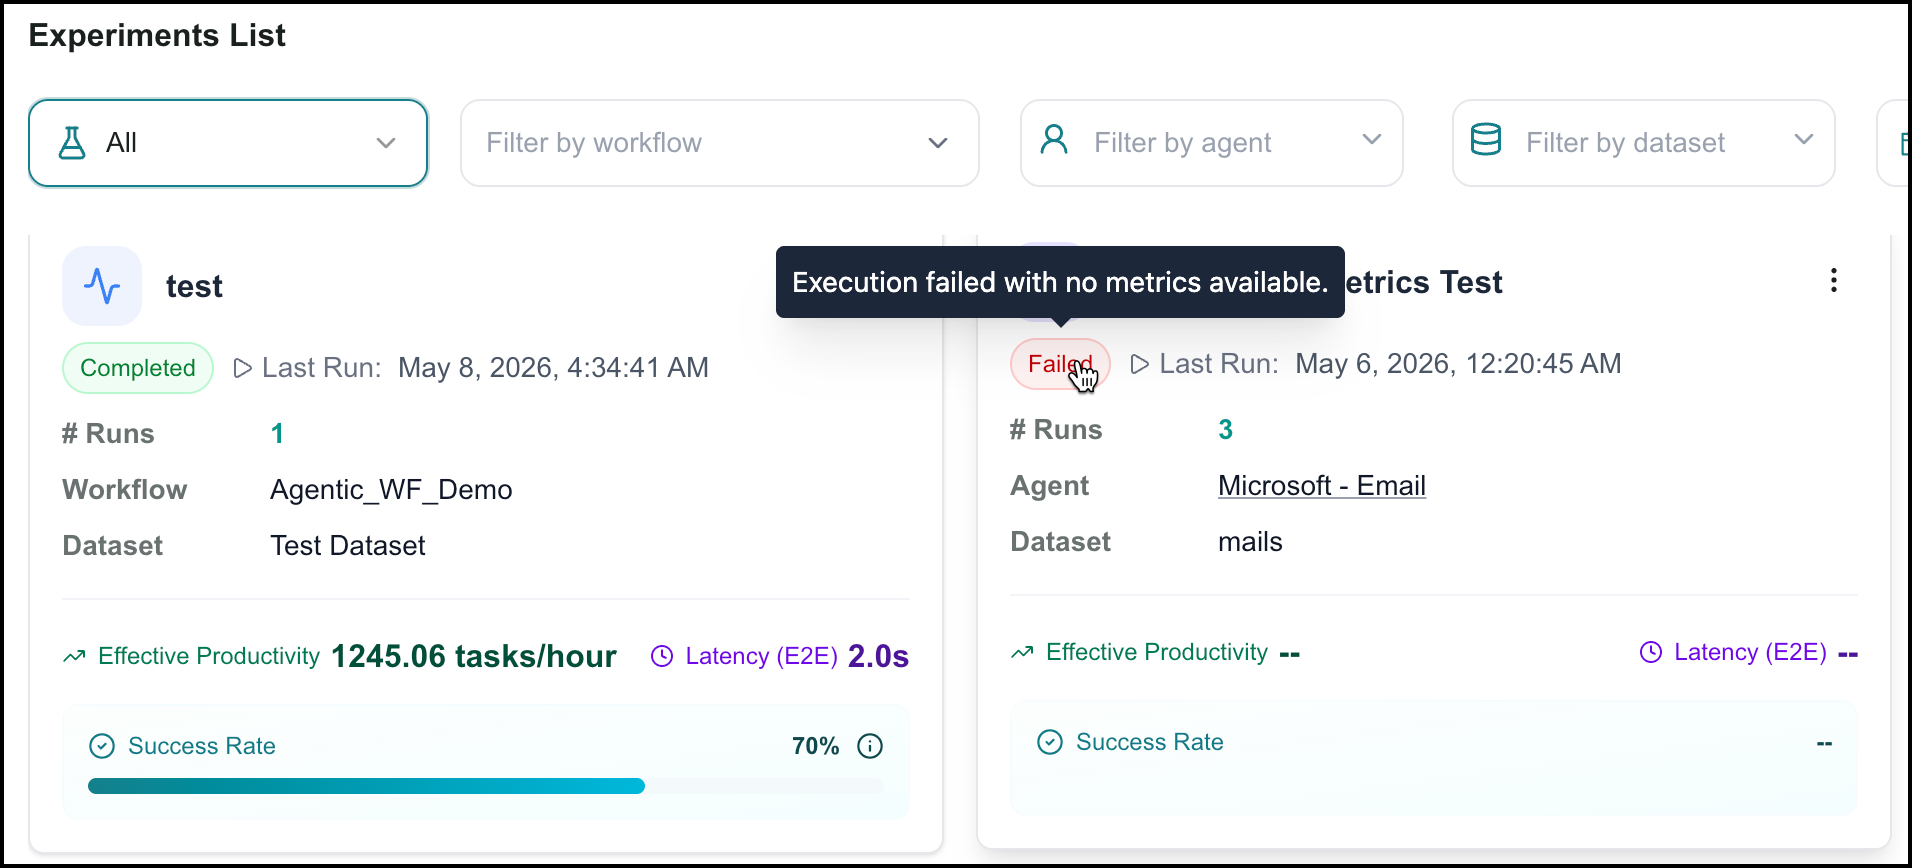
The experiment status is shown just below the name. Hover your cursor over the status bubble for more information:
 |
Analytics
Opens the Experiment Analytics page, which displays detailed analytics for the selected experiment, including key metrics, all metrics, and custom metrics.
See Results & Analytics for definitions of the dimensions and associated metrics.
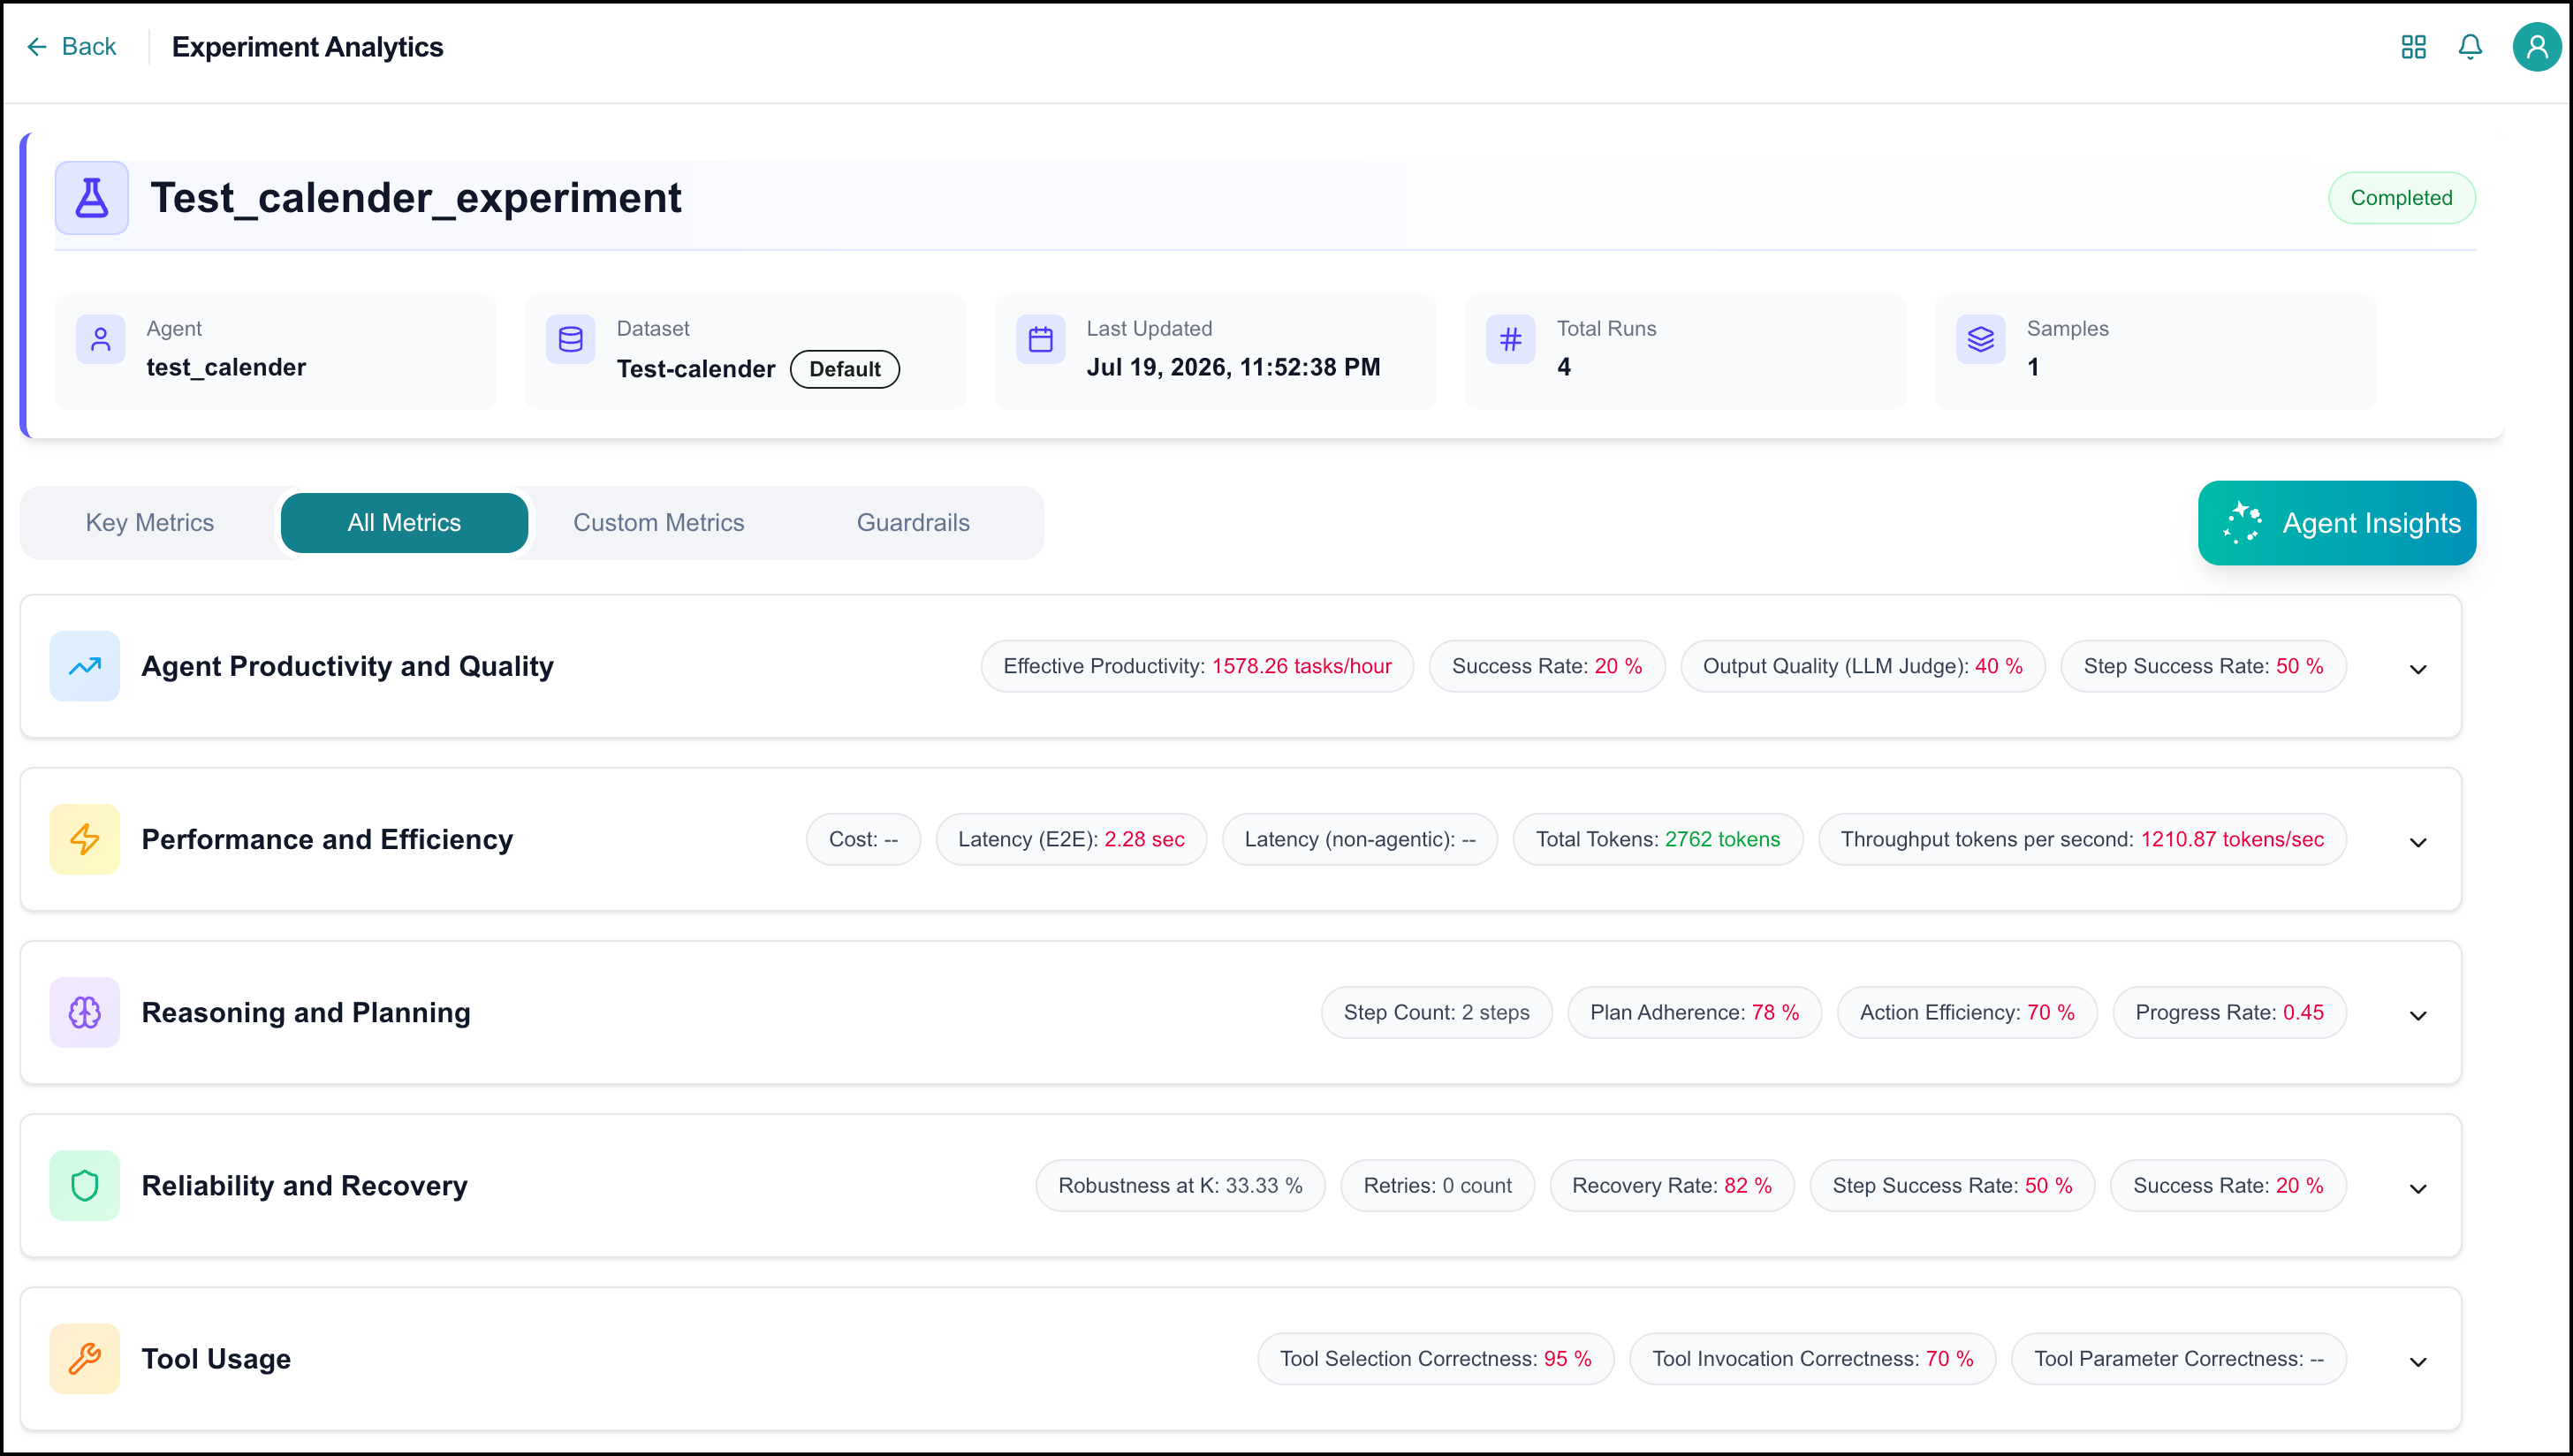
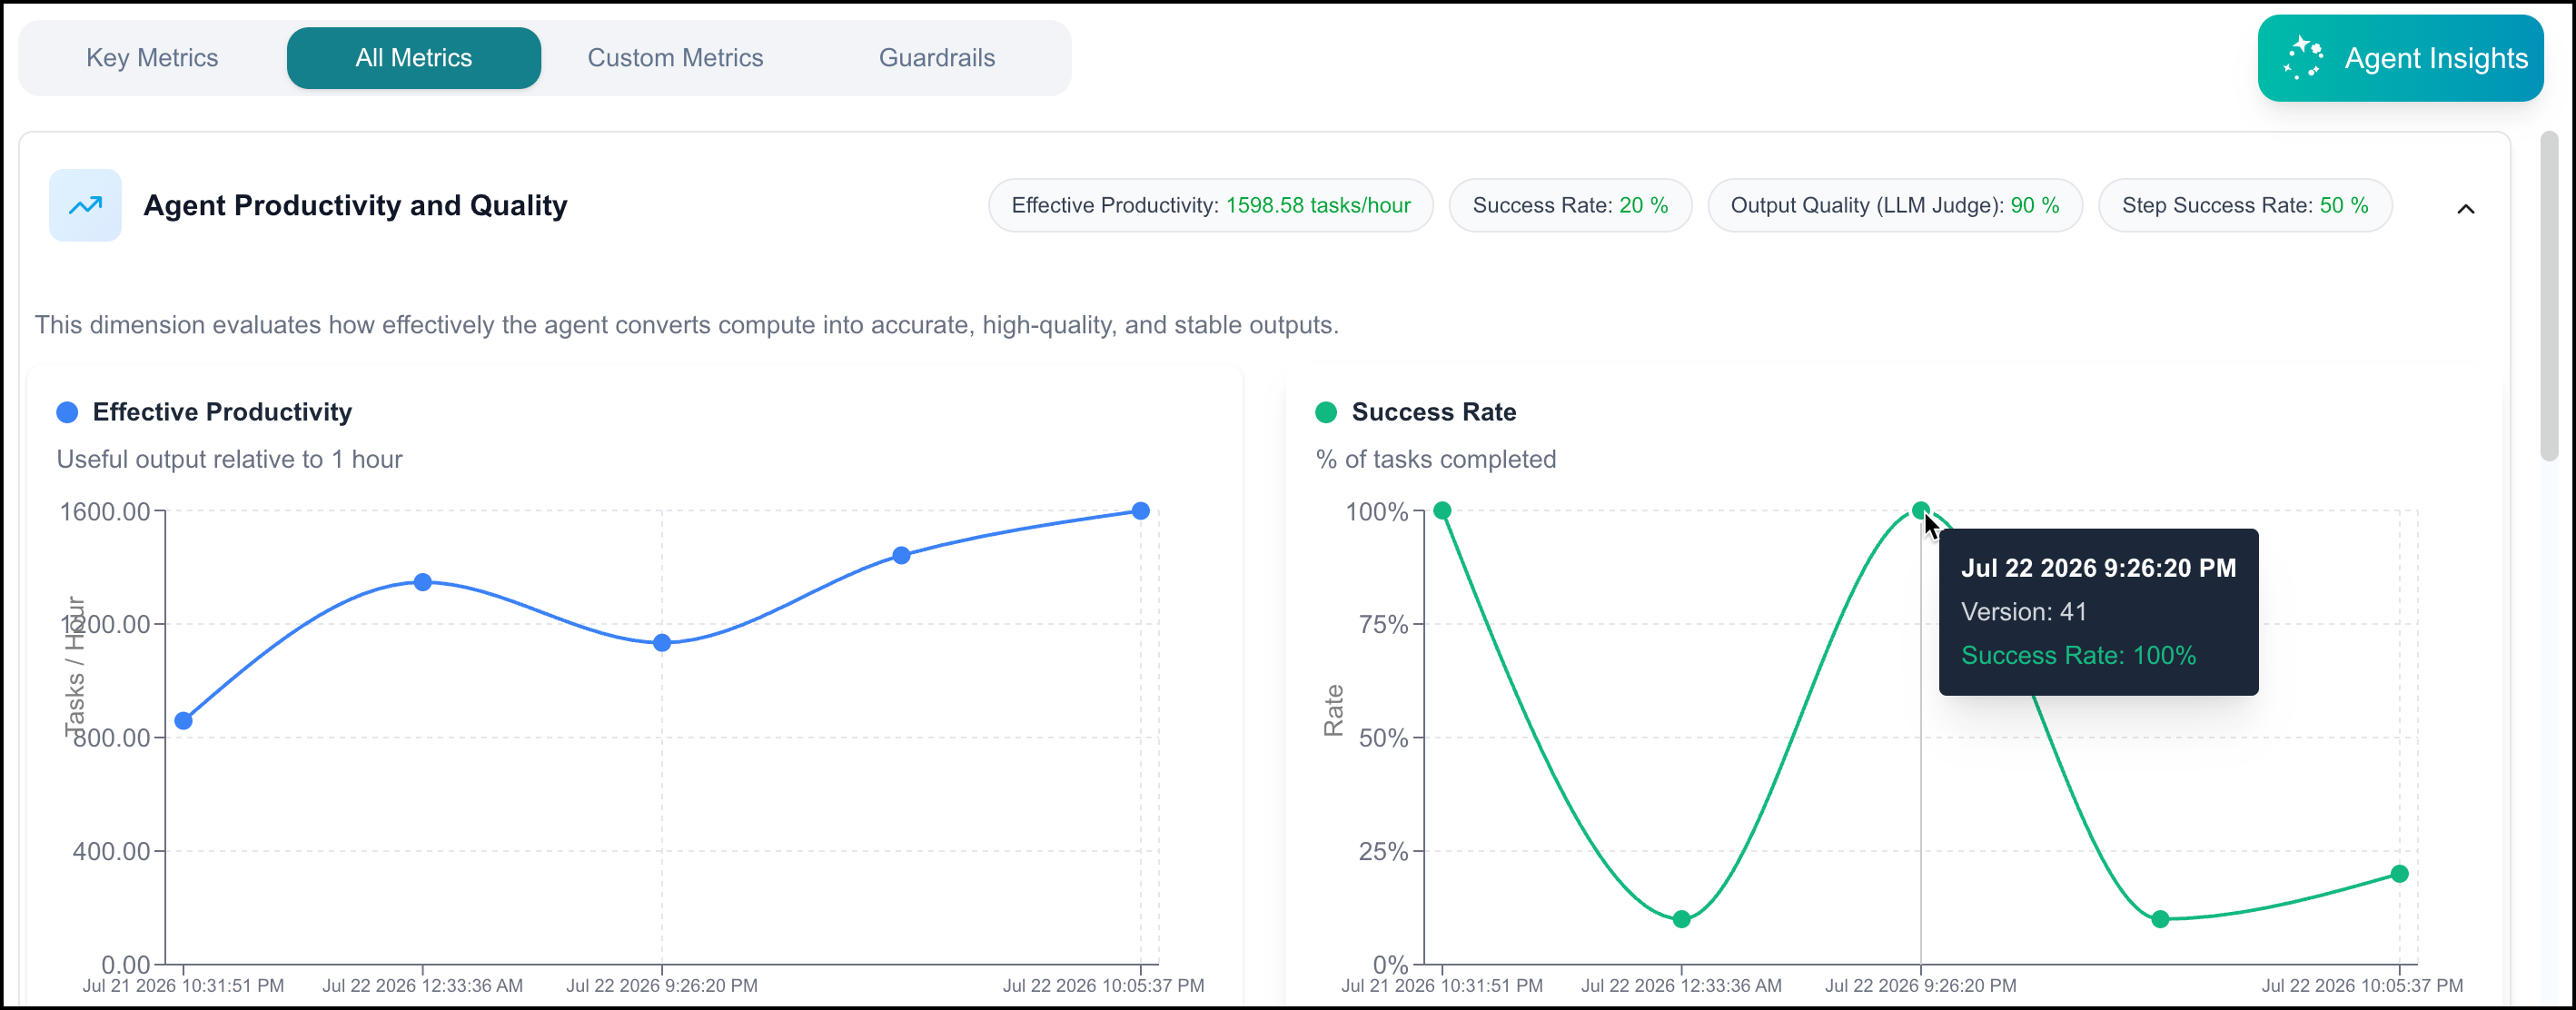
Each dimension shows a summary of the included metrics. Click on a dimension to view more details about the dimension.
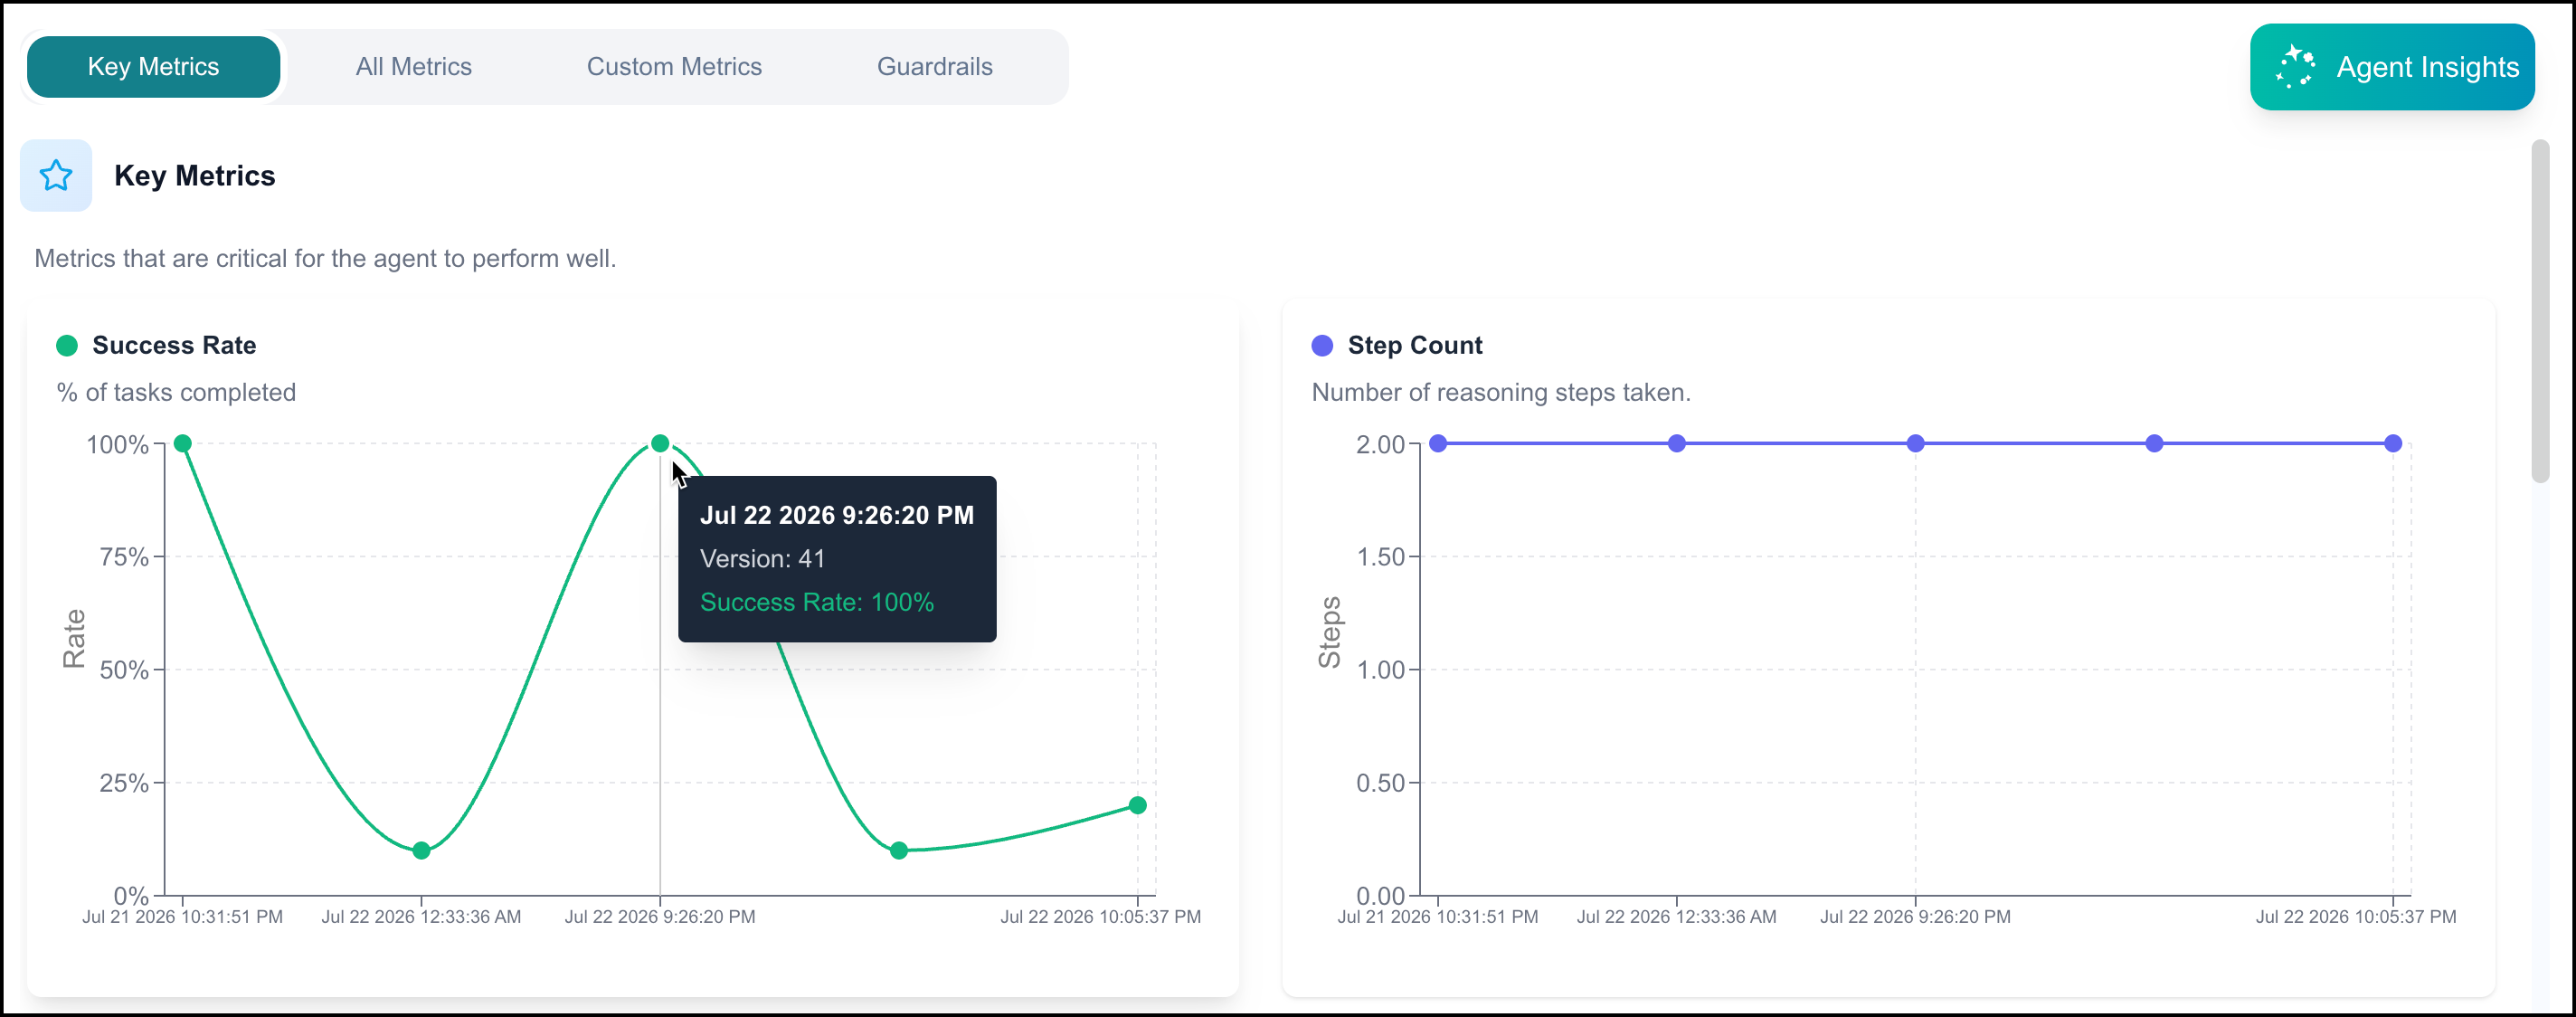
View key metrics via the Key Metrics tab.
View custom metrics via the Custom Metrics tab.
View
Opens the Experiment Details page, which shows details about the experiment, including the experiment name, the agent or workflow, and the dataset used.
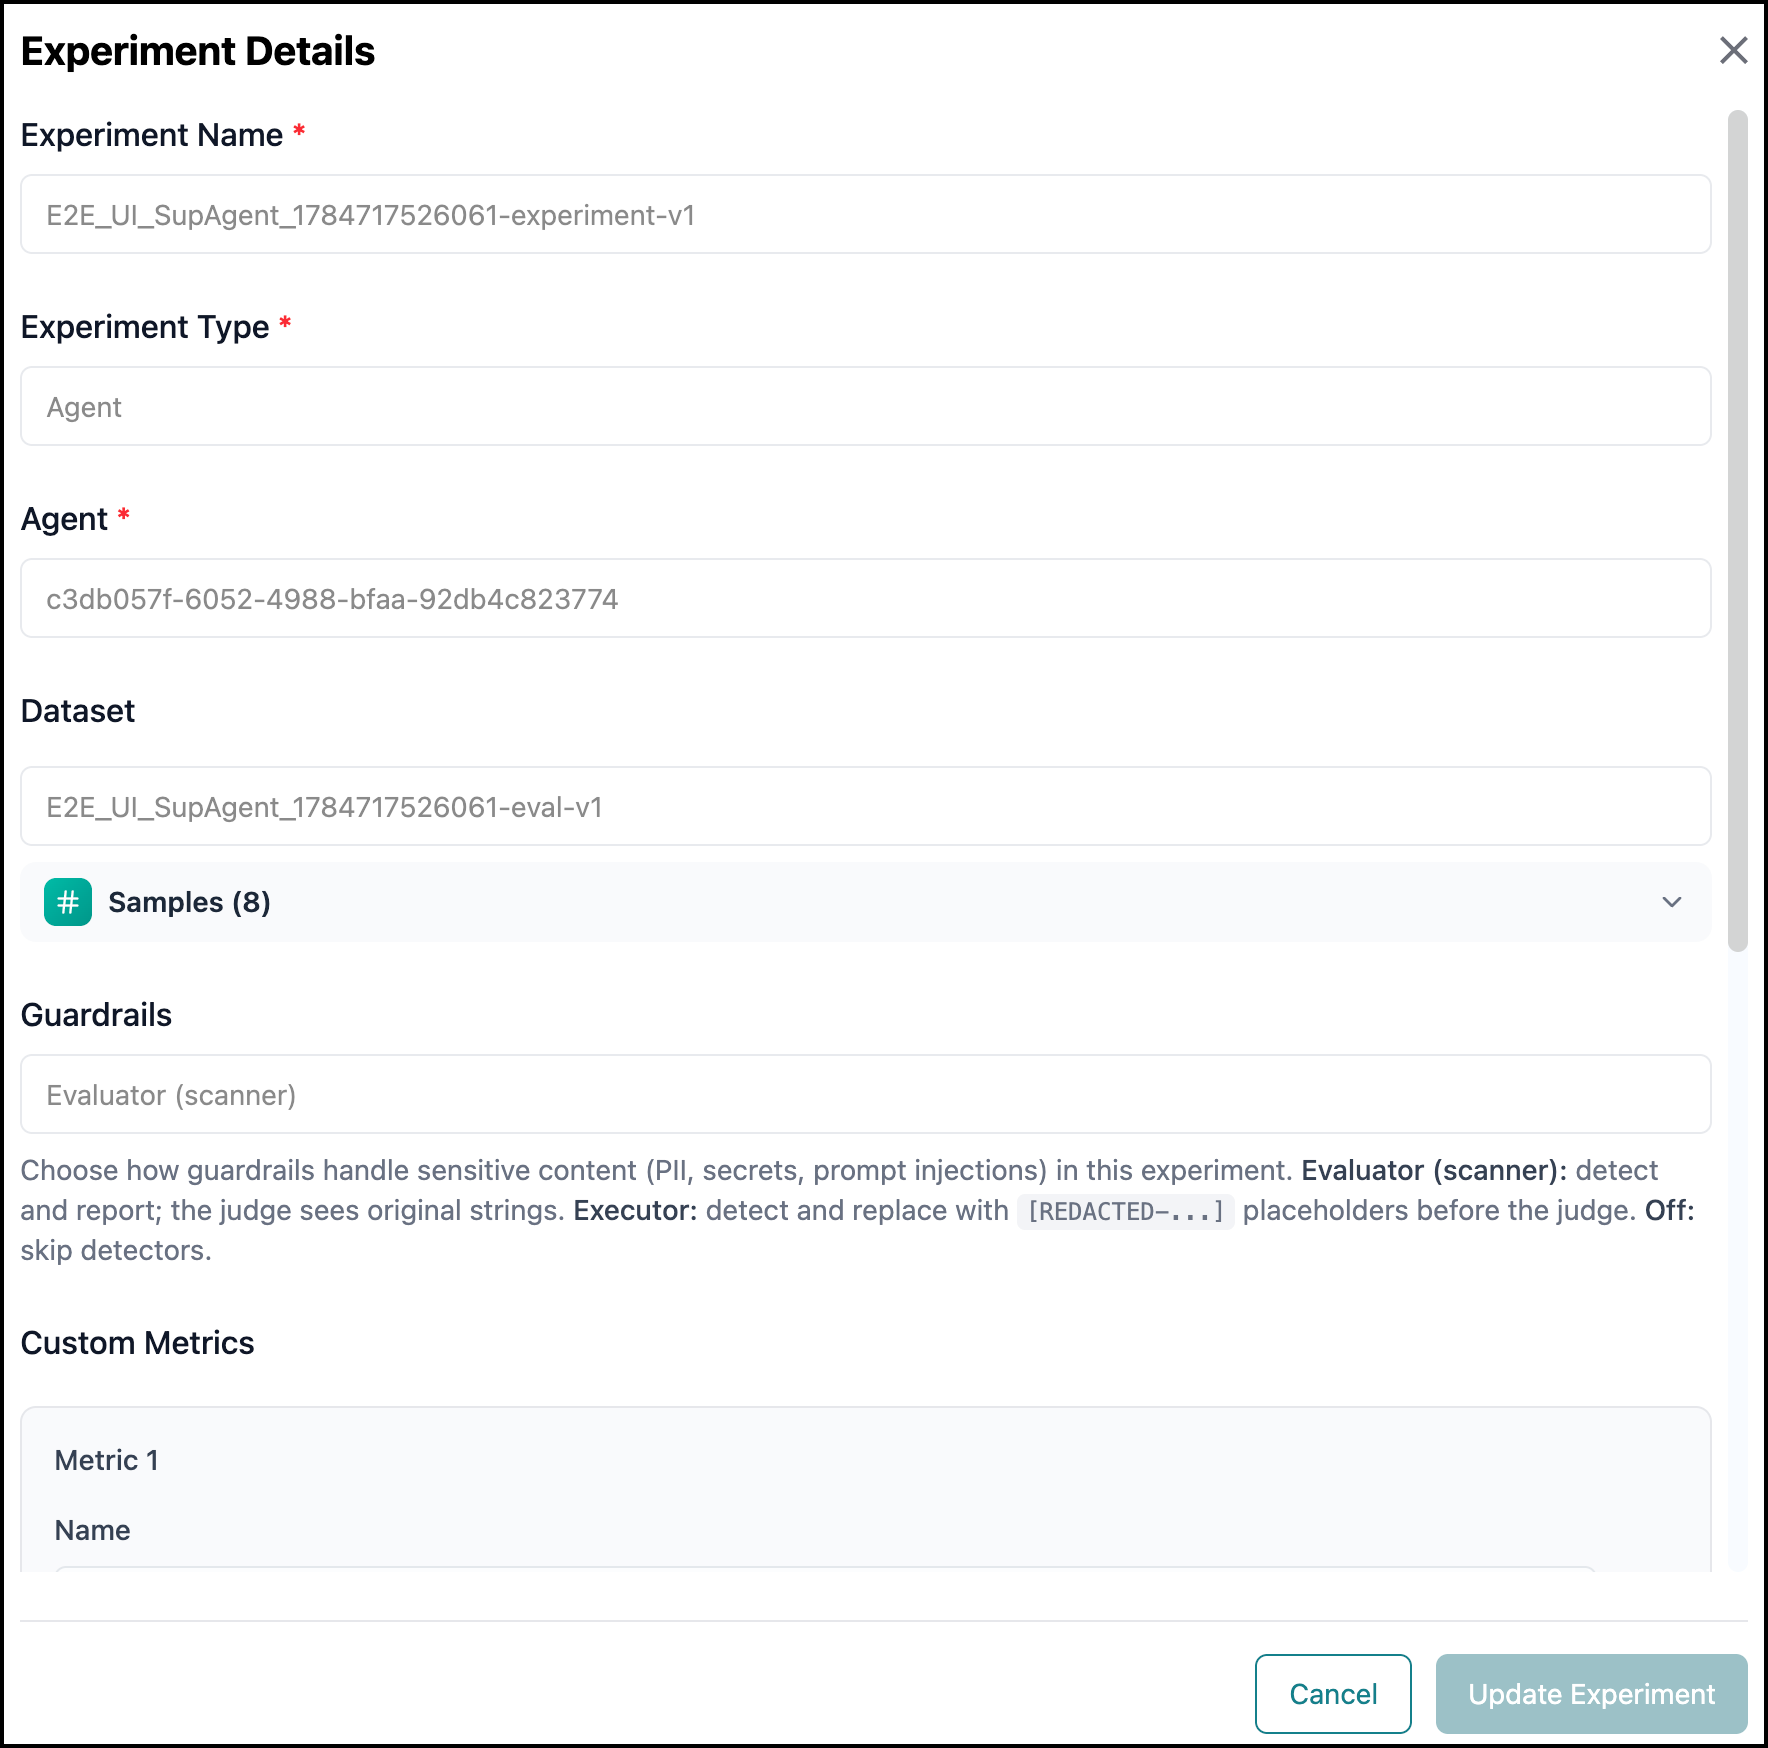 |
Run
Opens the Run Experiment page, which shows the input source and dataset used when running the experiment.
To run an experiment:
Click the Ellipsis
icon on an experiment and select Run. The Run Experiment page is displayed: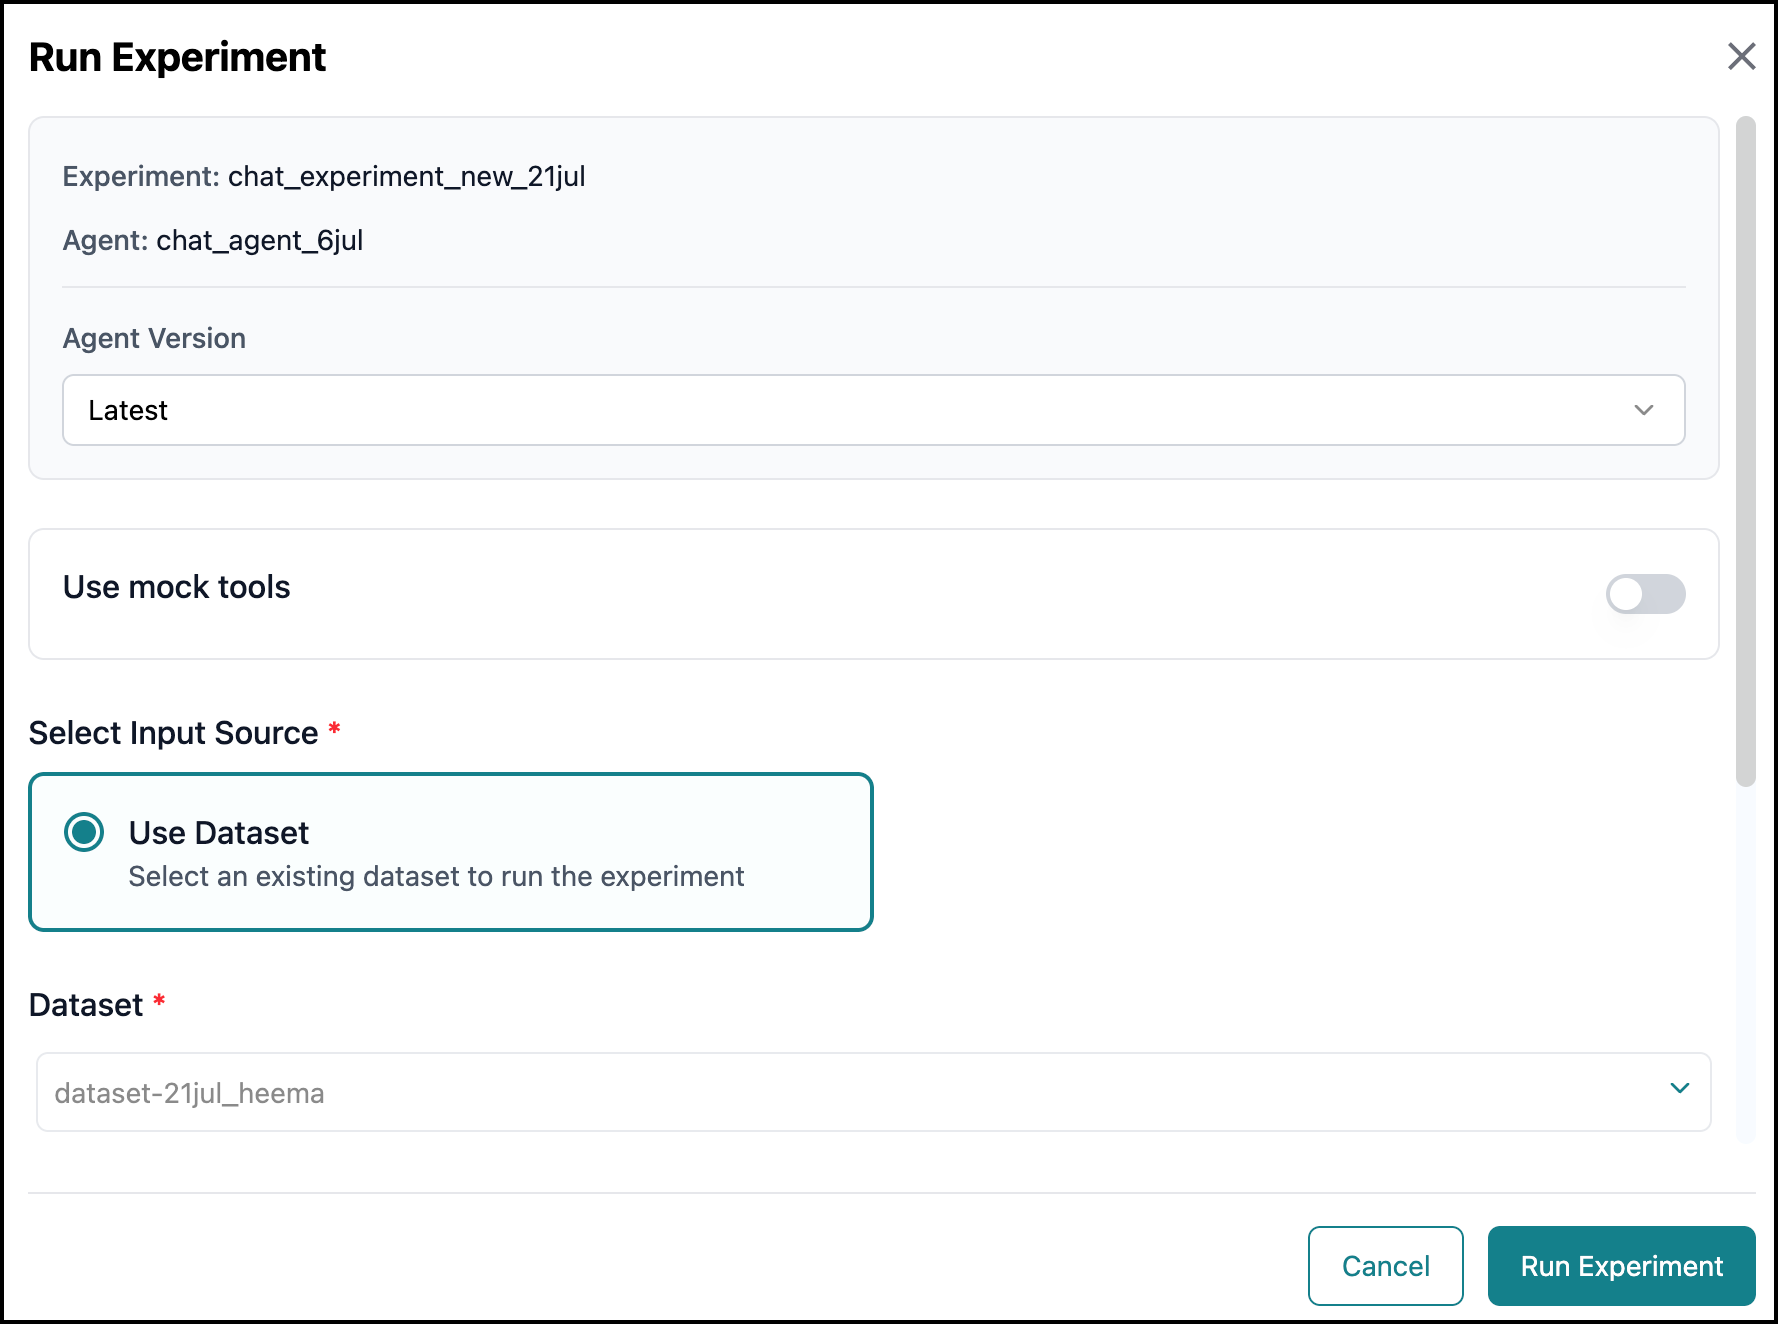
When running an experiment on an agent, select the agent version to use (version selection is not available for Workflows).
(Optional) Enable Mock tools.
Select an Input Source: use an existing dataset or manually enter one or more samples.
Click Run Experiment.
A "Success" message confirms the experiment run has started. You can view the status of the experiment run via the Experiments tab.
View Last Run
Opens the Run Details page, which shows information about the most recent run, including its status, when it was run, its duration, and details for each evaluation dimension.
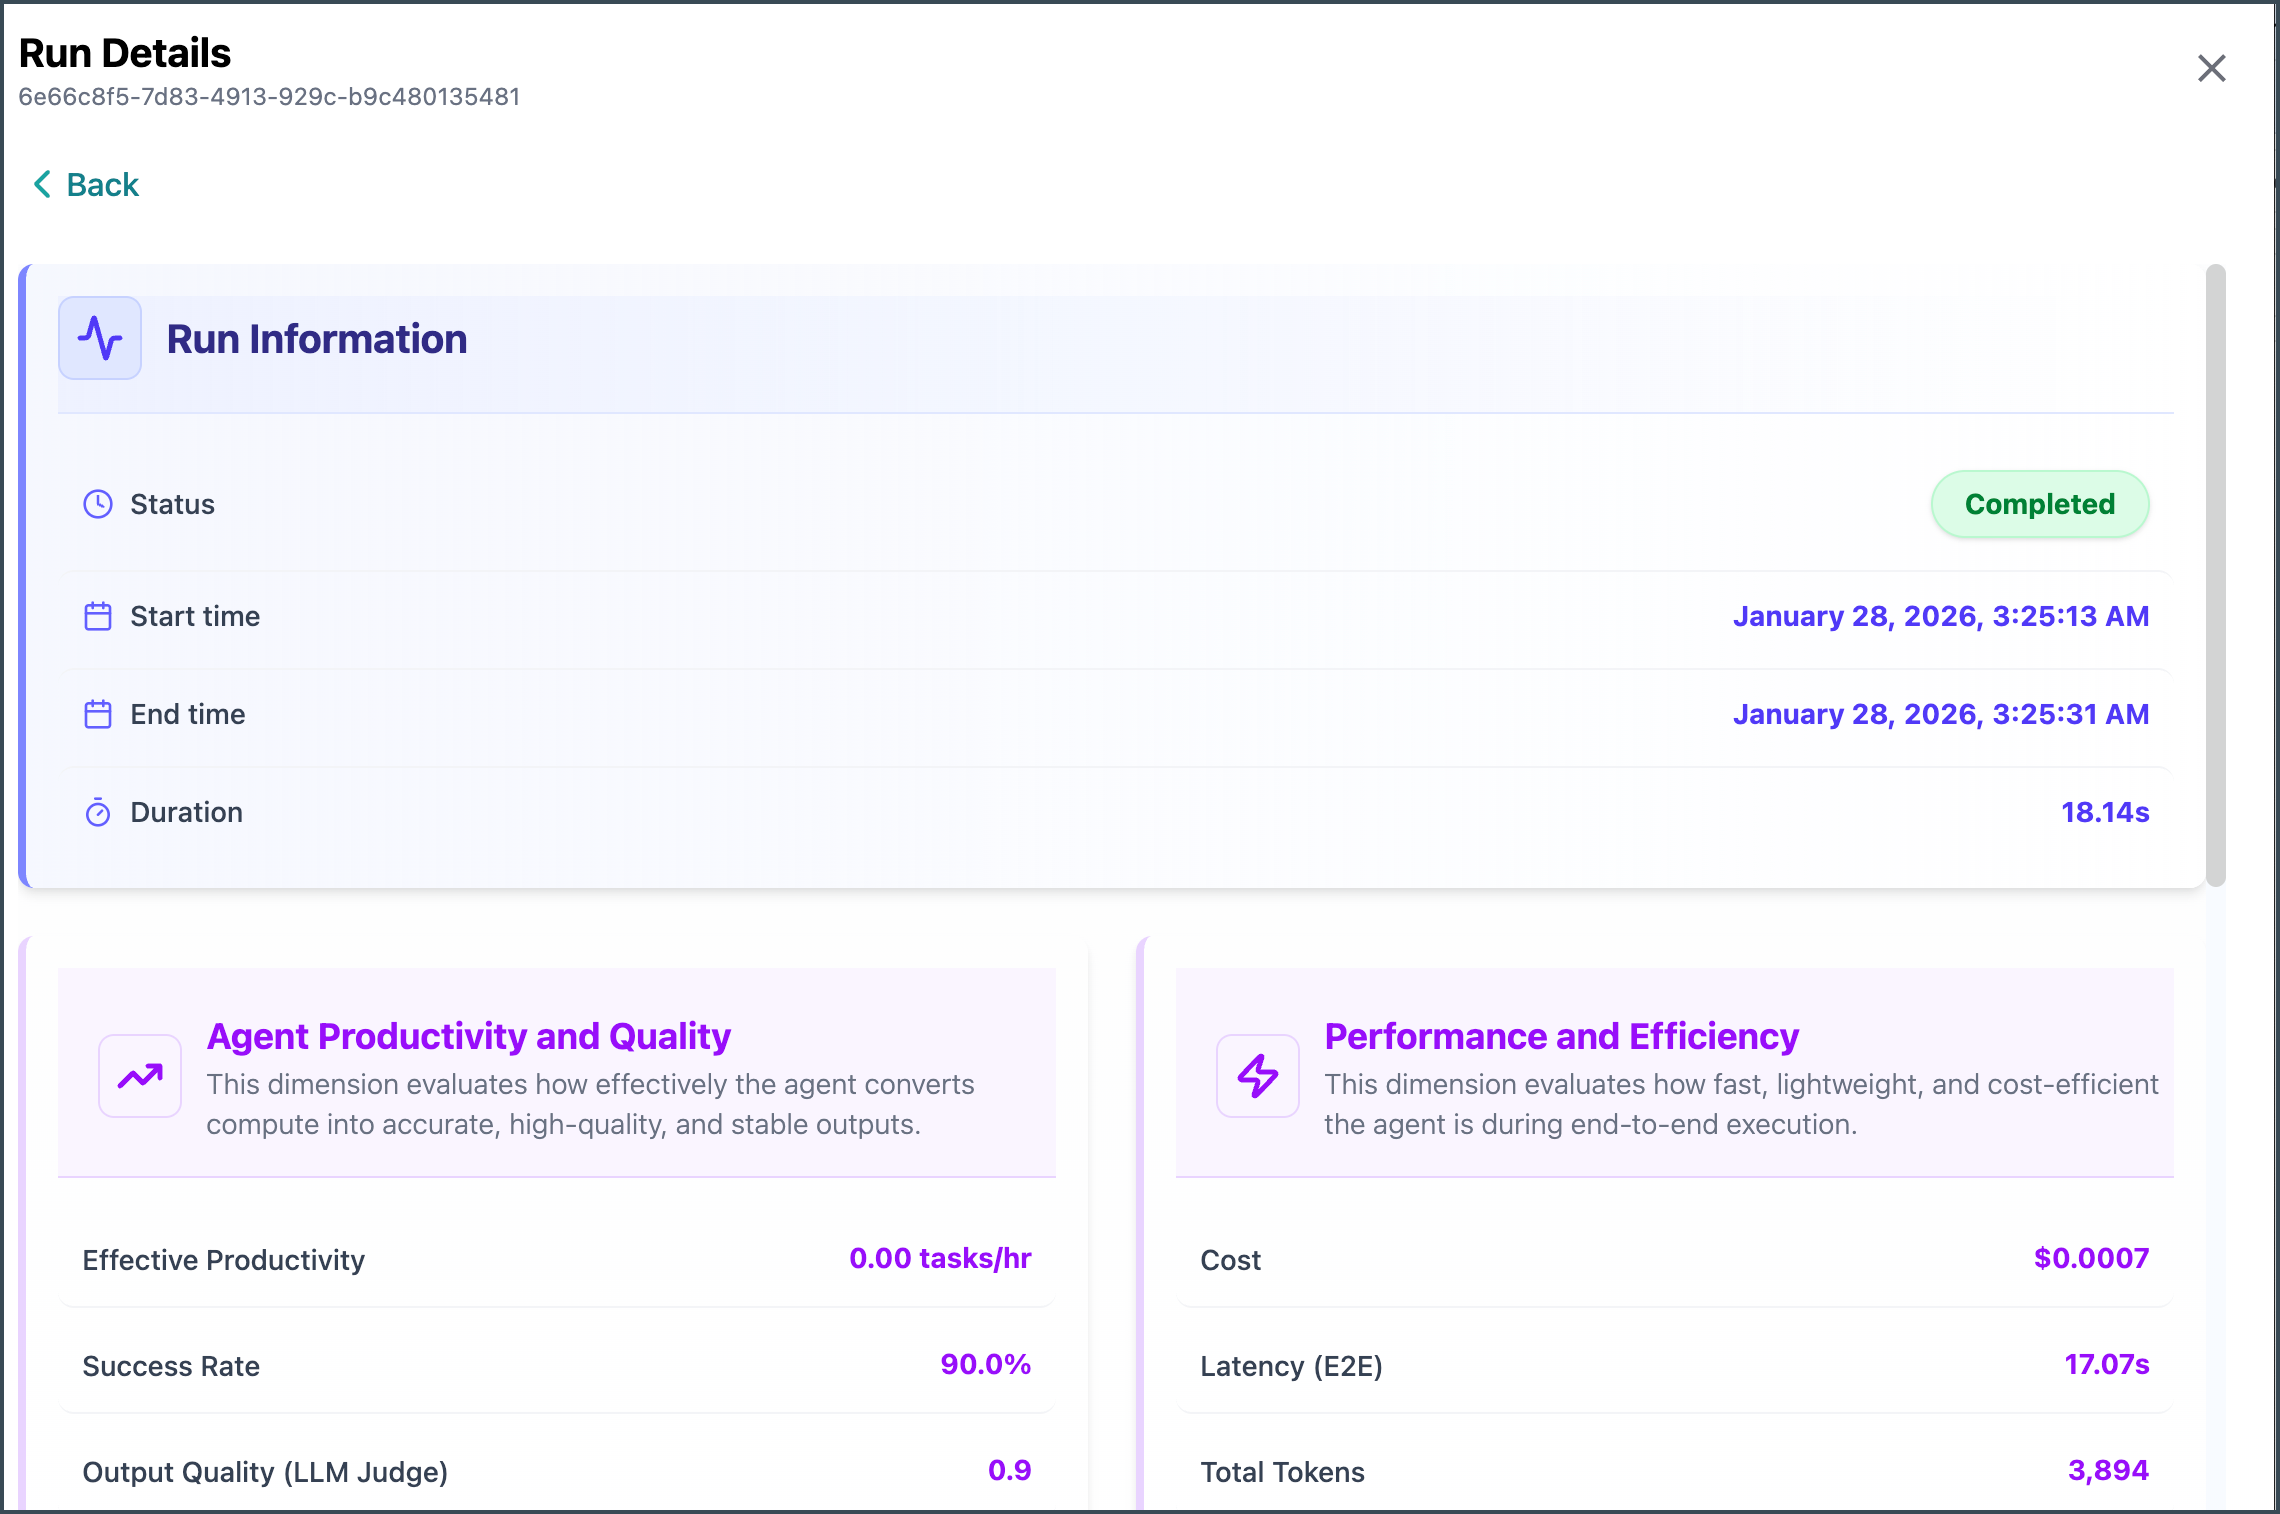
View Run History
Opens the Experiment Runs page, which shows a list of experiment runs. Click a run to view details for that specific run.
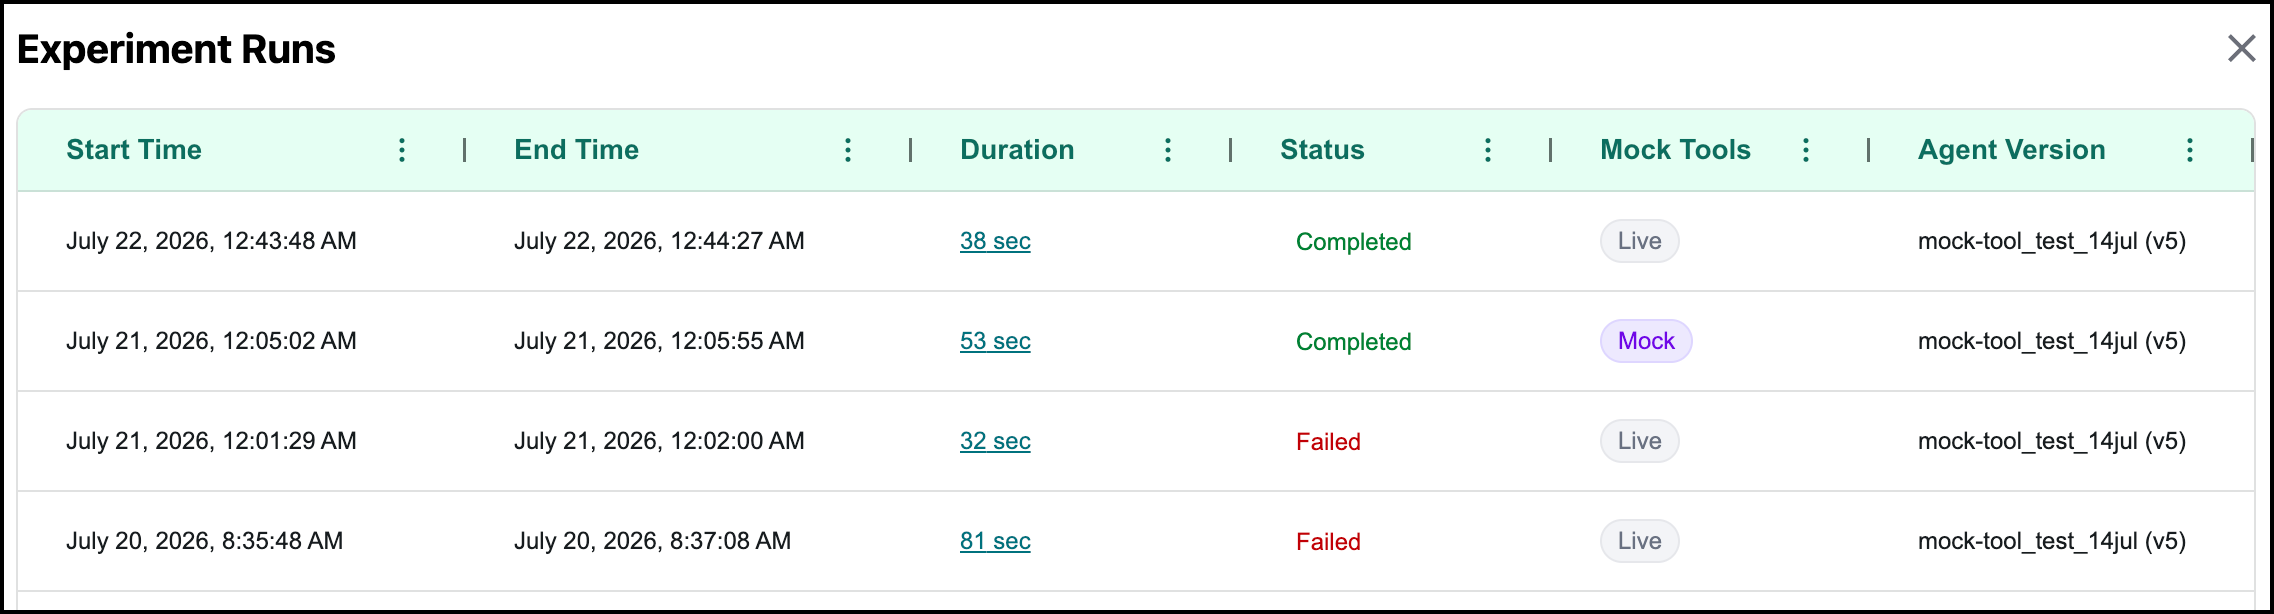
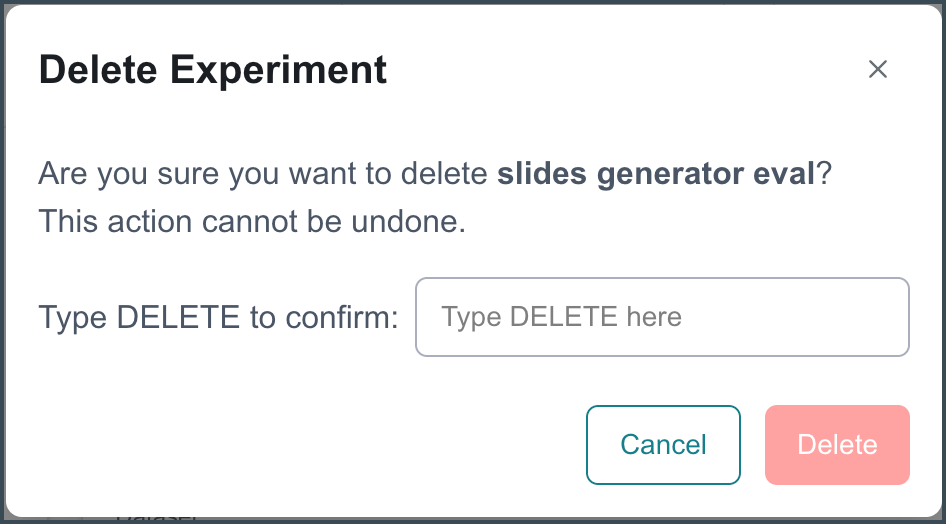
Delete
Opens the Delete Experiment page. Type DELETE in the textbox, then click Delete.
 |
Datasets
The Datasets tab displays all available datasets. A dataset is a collection of "user query < > ideal agent response" pairs or simulated user conversations used to evaluate the quality of an agent's responses.
You can edit existing datasets and create new ones.
To access this page, go to the Agent SDK > Agent Evaluation > Datasets tab.
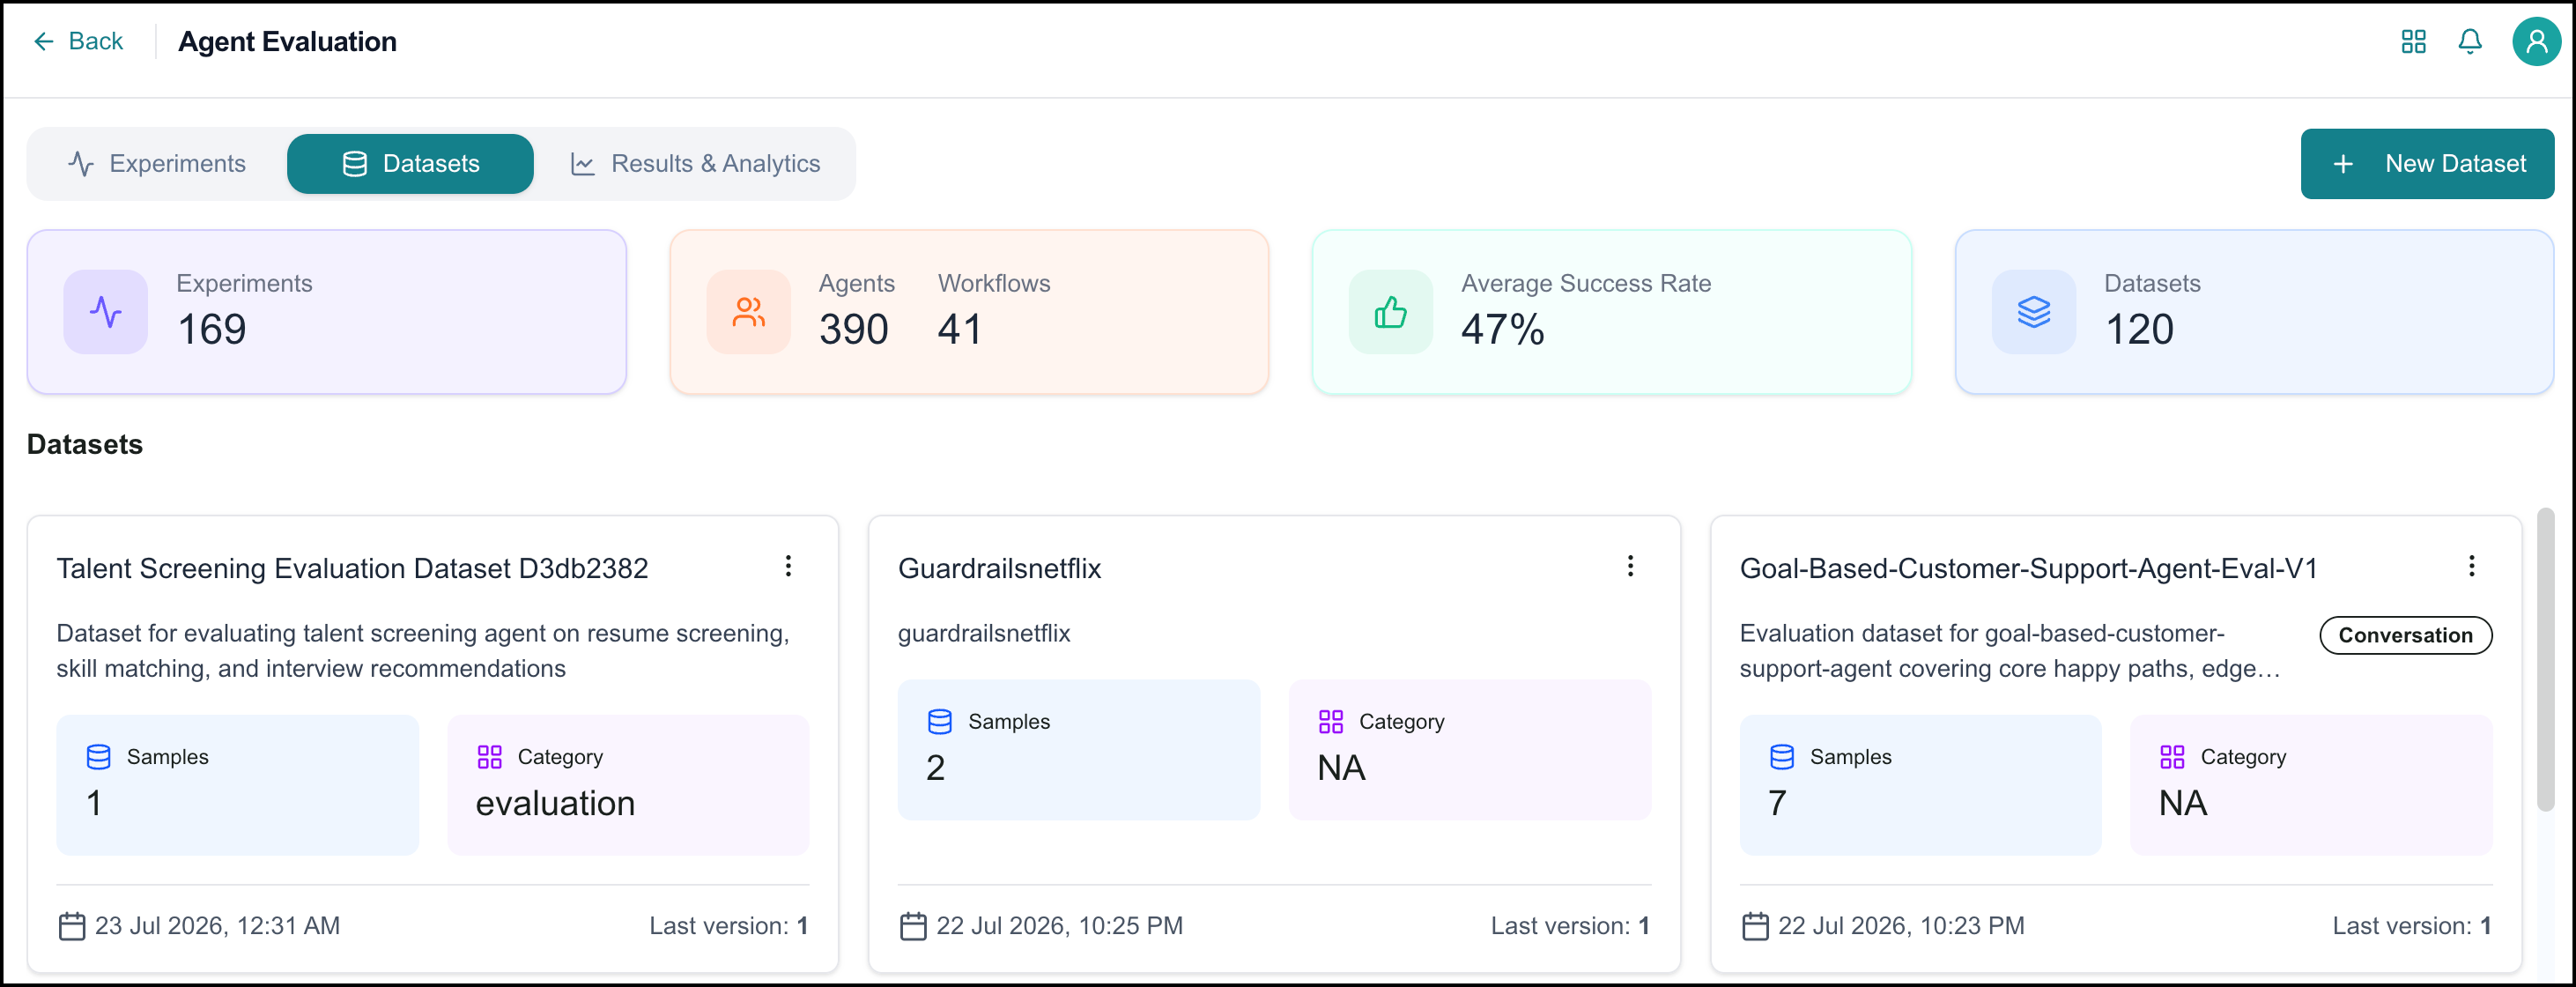
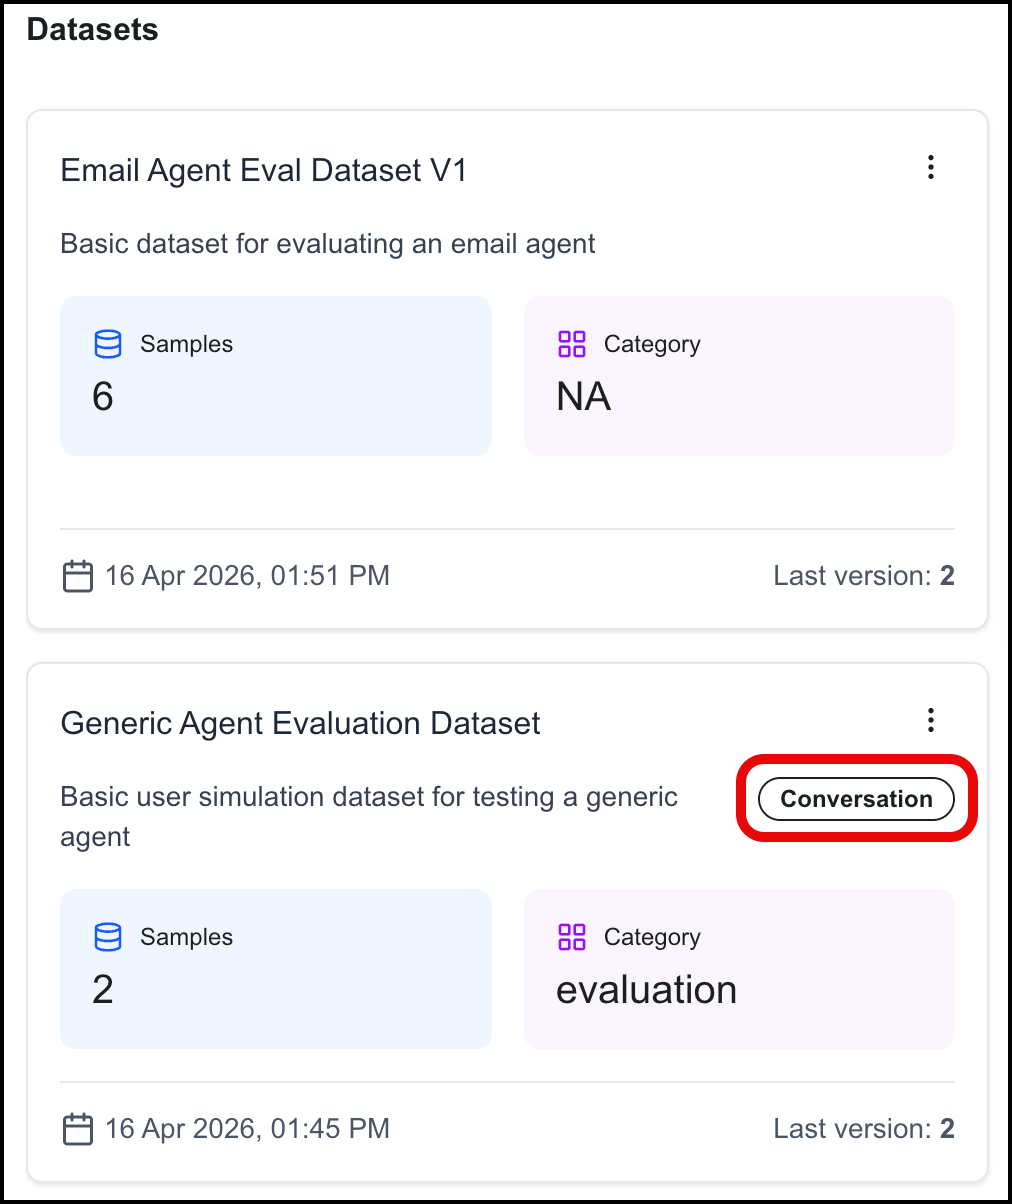
The Datasets tab displays each existing dataset as a "card" and shows:
Dataset Name
An Ellipsis
icon used to access additional functionsDescription
"Conversation" tag to indicate whether the dataset uses user simulation
Number of samples/conversations
Category
Date modified
Version
 |
On the Datasets tab, you can perform the following actions:
Creating Datasets
To create a dataset:
Click New Dataset.

The Create New Dataset page opens.
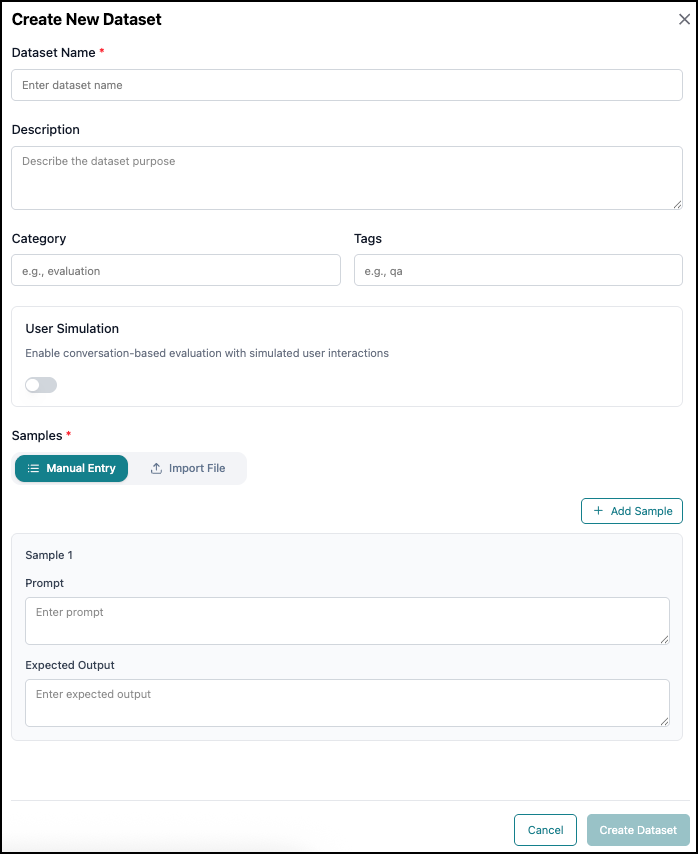
Enter a name for the dataset. Optionally, provide a description, category, and tags.
(Optional) Enable User Simulation. User Simulation enables conversation-based evaluation by simulating user interactions rather than providing sample prompts as ground truth.
Note
You can either use User Simulation or provide sample prompts. You cannot do both. When you enable User Simulation, the fields for adding samples are hidden.
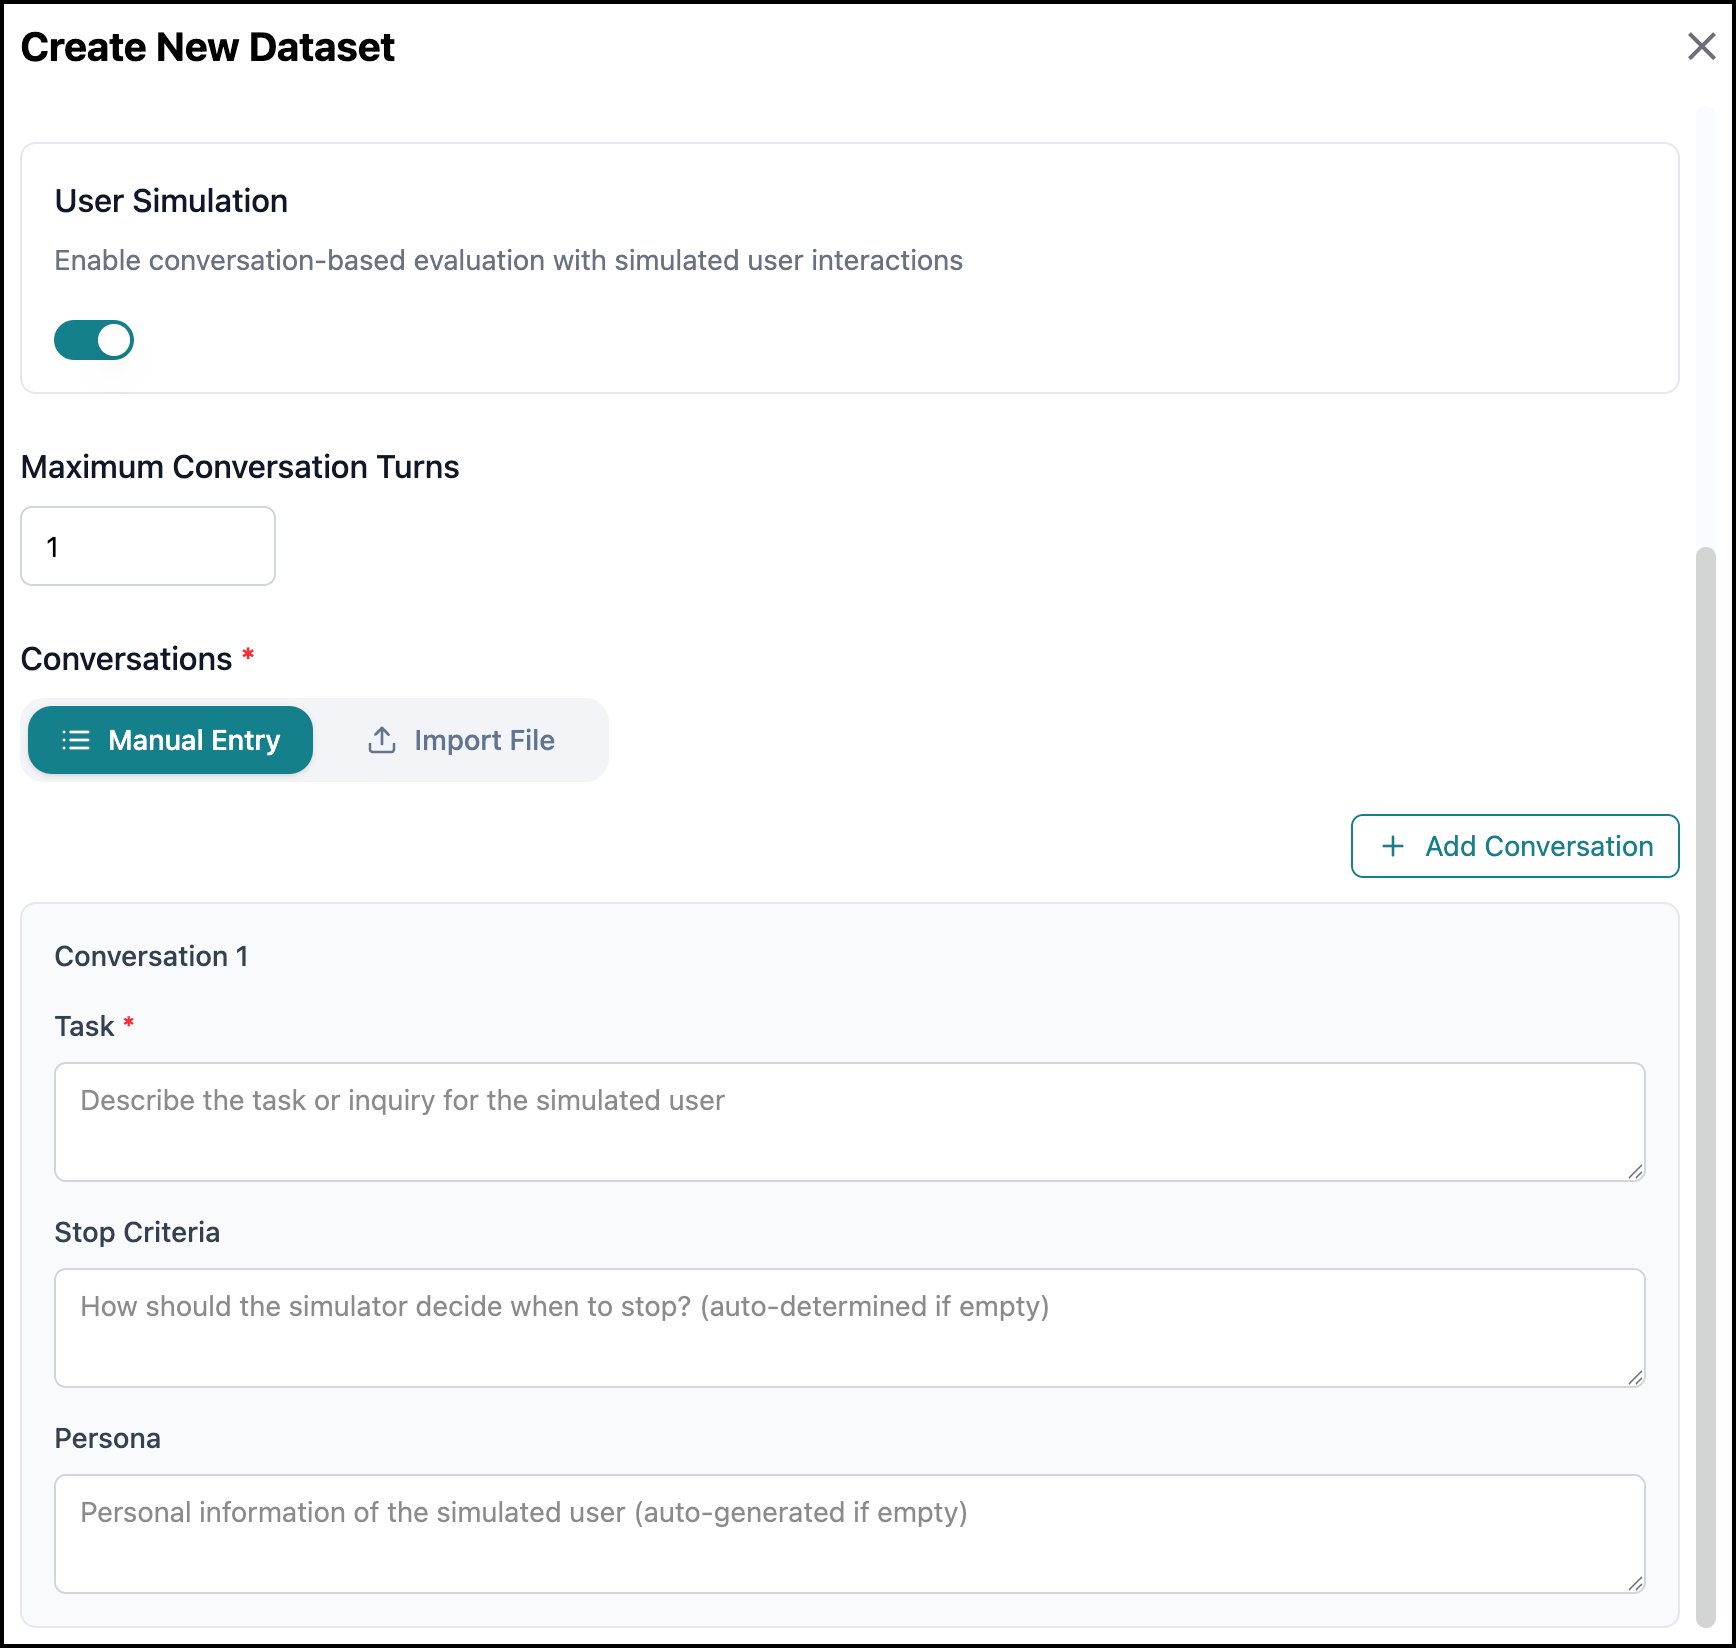
Enter the maximum number of conversation turns (back and forth "rounds" of a conversation).
To enter conversations manually, describe a Task, Stop Criteria, and Persona for each conversation. The Stop Criteria and Persona will be auto-generated if left empty. Click Add Conversation to enter additional conversations.
Alternatively, you can import a file that describes multiple conversations. Click Import File in the User Simulation section. Click and upload a JSON file. Note the expected JSON format.
[
  {"task": "Book a flight to NYC", "stop_criteria": "Booking confirmed", "persona": "Busy executive"},
  {"task": "Check order status"}
]
Click Create Dataset.
The Create Dataset page closes, and a success message is displayed.
Add at least one sample (prompt and expected output pair). You can enter the sample(s) manually or import a JSON file.
Note
Only available if User Simulation is not enabled.
To enter samples manually:
Click Manual Entry in the Samples section.
Enter a prompt and expected output.
Click Add Sample to add additional samples.
To import JSON files:
Click Import File in the Samples section.
Click and upload a JSON file. Note the expected JSON format.
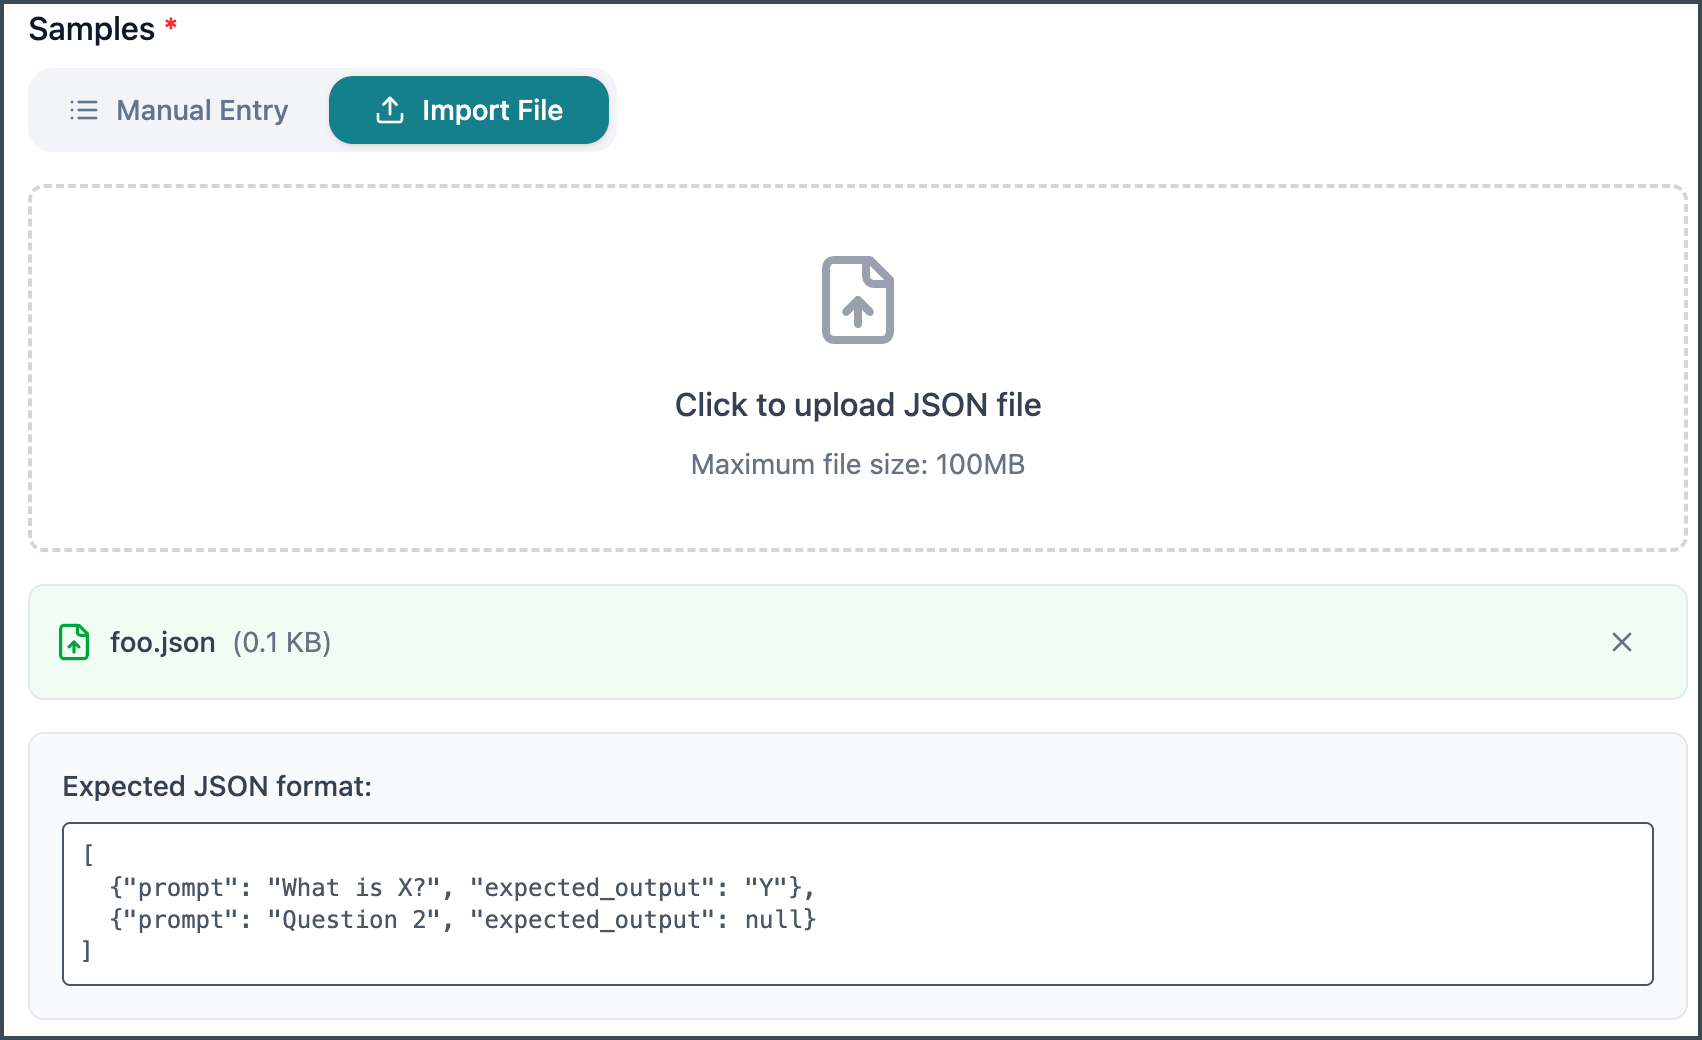
[
  {"prompt": "What is X?", "expected_output": "Y"},
  {"prompt": "Question 2", "expected_output": null}
]
Click to upload additional JSON files if necessary.
Click Create Dataset.
Editing Datasets
You can edit a dataset to change the name, description, category, and tags. You can edit or add samples or simulated user conversations. Editing a dataset creates a new version of the dataset.
Note
Dataset Versions
Each time you save changes to a dataset, a new version is created. The system links experiments to the specific dataset version that existed at the time of experiment creation and will continue to use that version throughout their lifecycle. Only the latest version of a dataset can be selected when creating new experiments. To use an updated dataset version, you must create a new experiment.
To edit a dataset:
Click the Ellipsis
icon on a dataset and select Edit.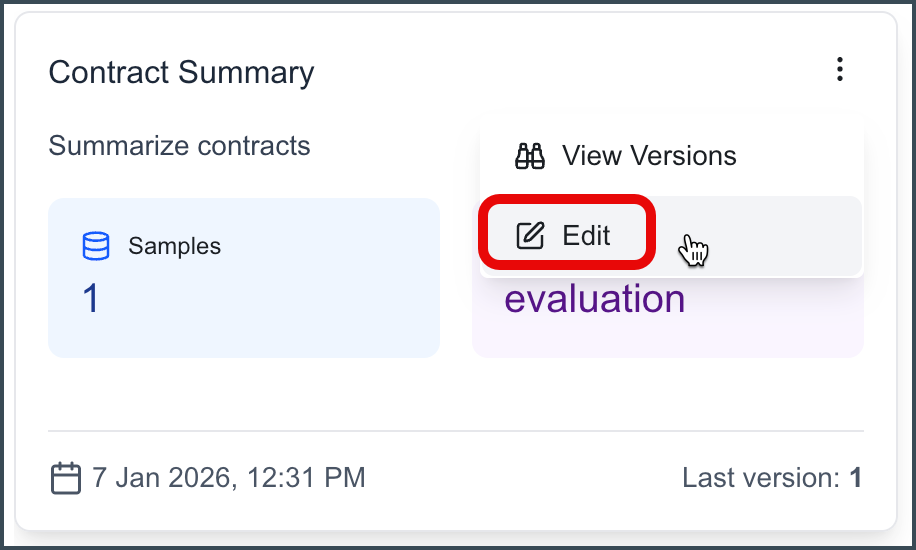
The Edit Dataset page opens.
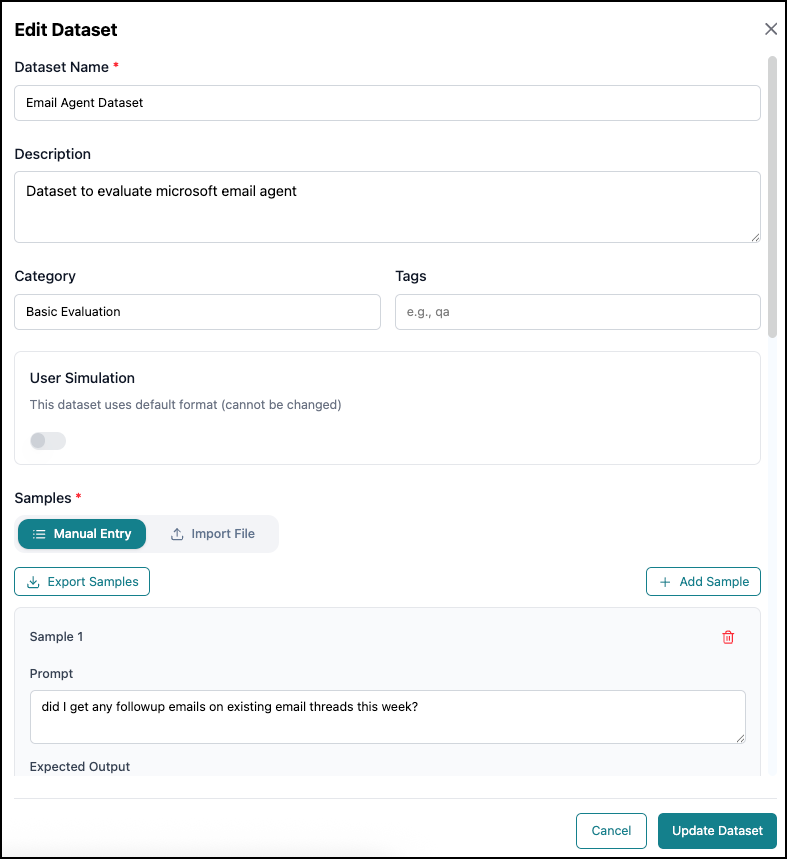
Make any desired changes to the Name, Description, Category, Tags, and Conversation/Samples fields.
Note
Updating conversations or samples via file import will overwrite the existing ones. When making manual entry changes, the existing unchanged conversations and samples are retained.
Click Update Dataset to create a new version of the dataset.
Viewing Dataset Versions
To view a list of existing versions of a dataset:
Click the Ellipsis
icon on a dataset and select View Versions.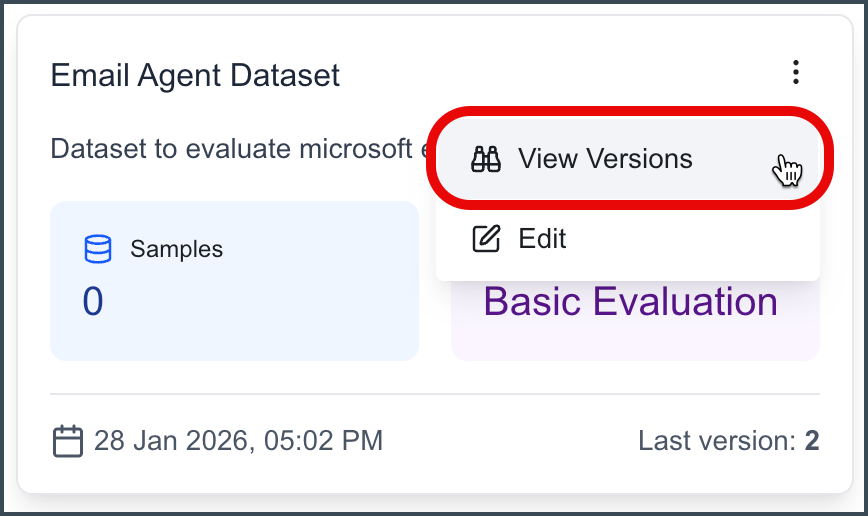
A list of versions of the dataset opens.
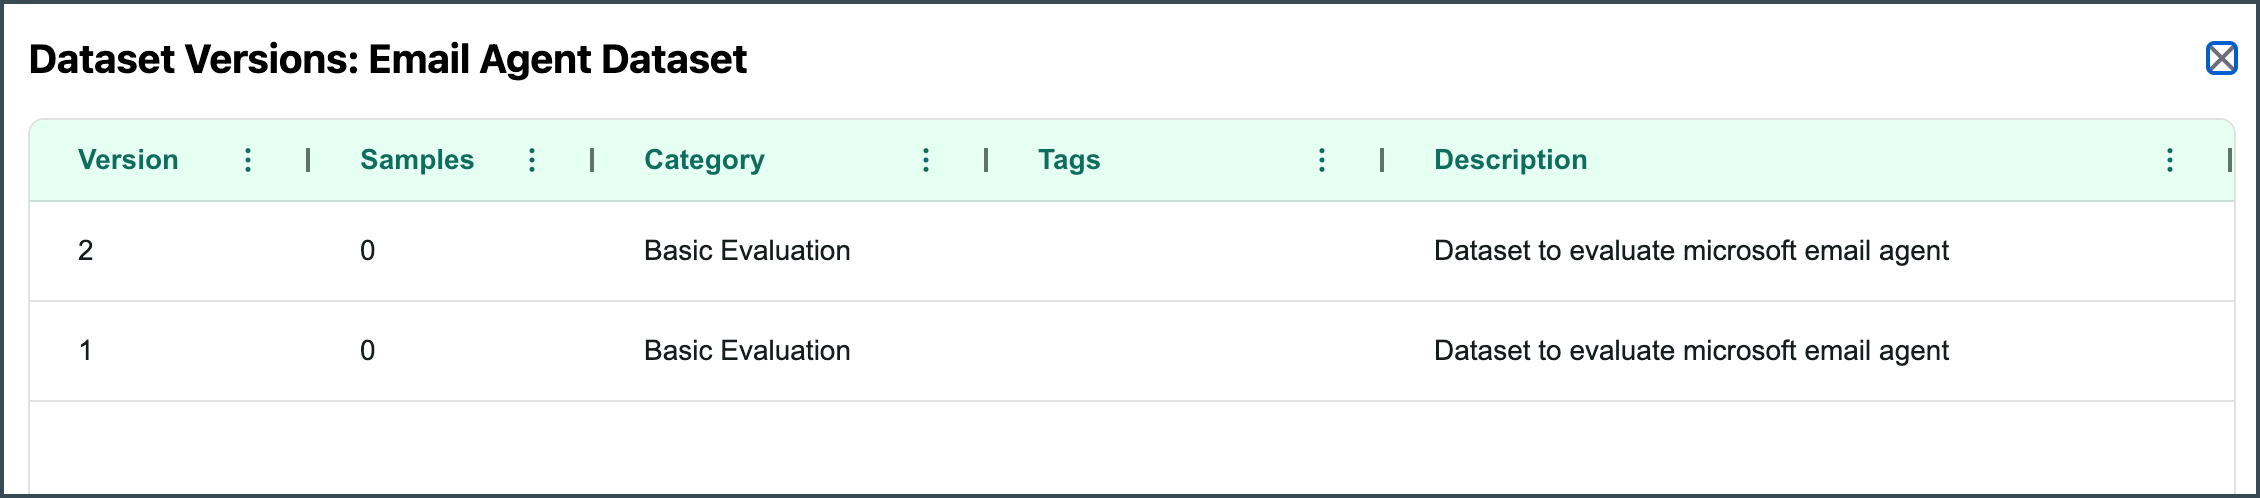
Click a version in the list to view its details.
Results & Analytics
The Results and Analytics tab shows summaries for the six Evaluation Dimensions and any defined custom metrics for the specified agent or workflow (custom metrics are not available for workflows). Use the information on this page to guide your agent or workflow tuning. You can also use the Agent Insights feature to get further AI-driven information about an agent.
To access this page, go to the Agent SDK > Agent Evaluation > Results & Analytics tab.
Select an agent or workflow from the corresponding dropdown to view the associated results and analytics. You can view all metrics for an agent or workflow:
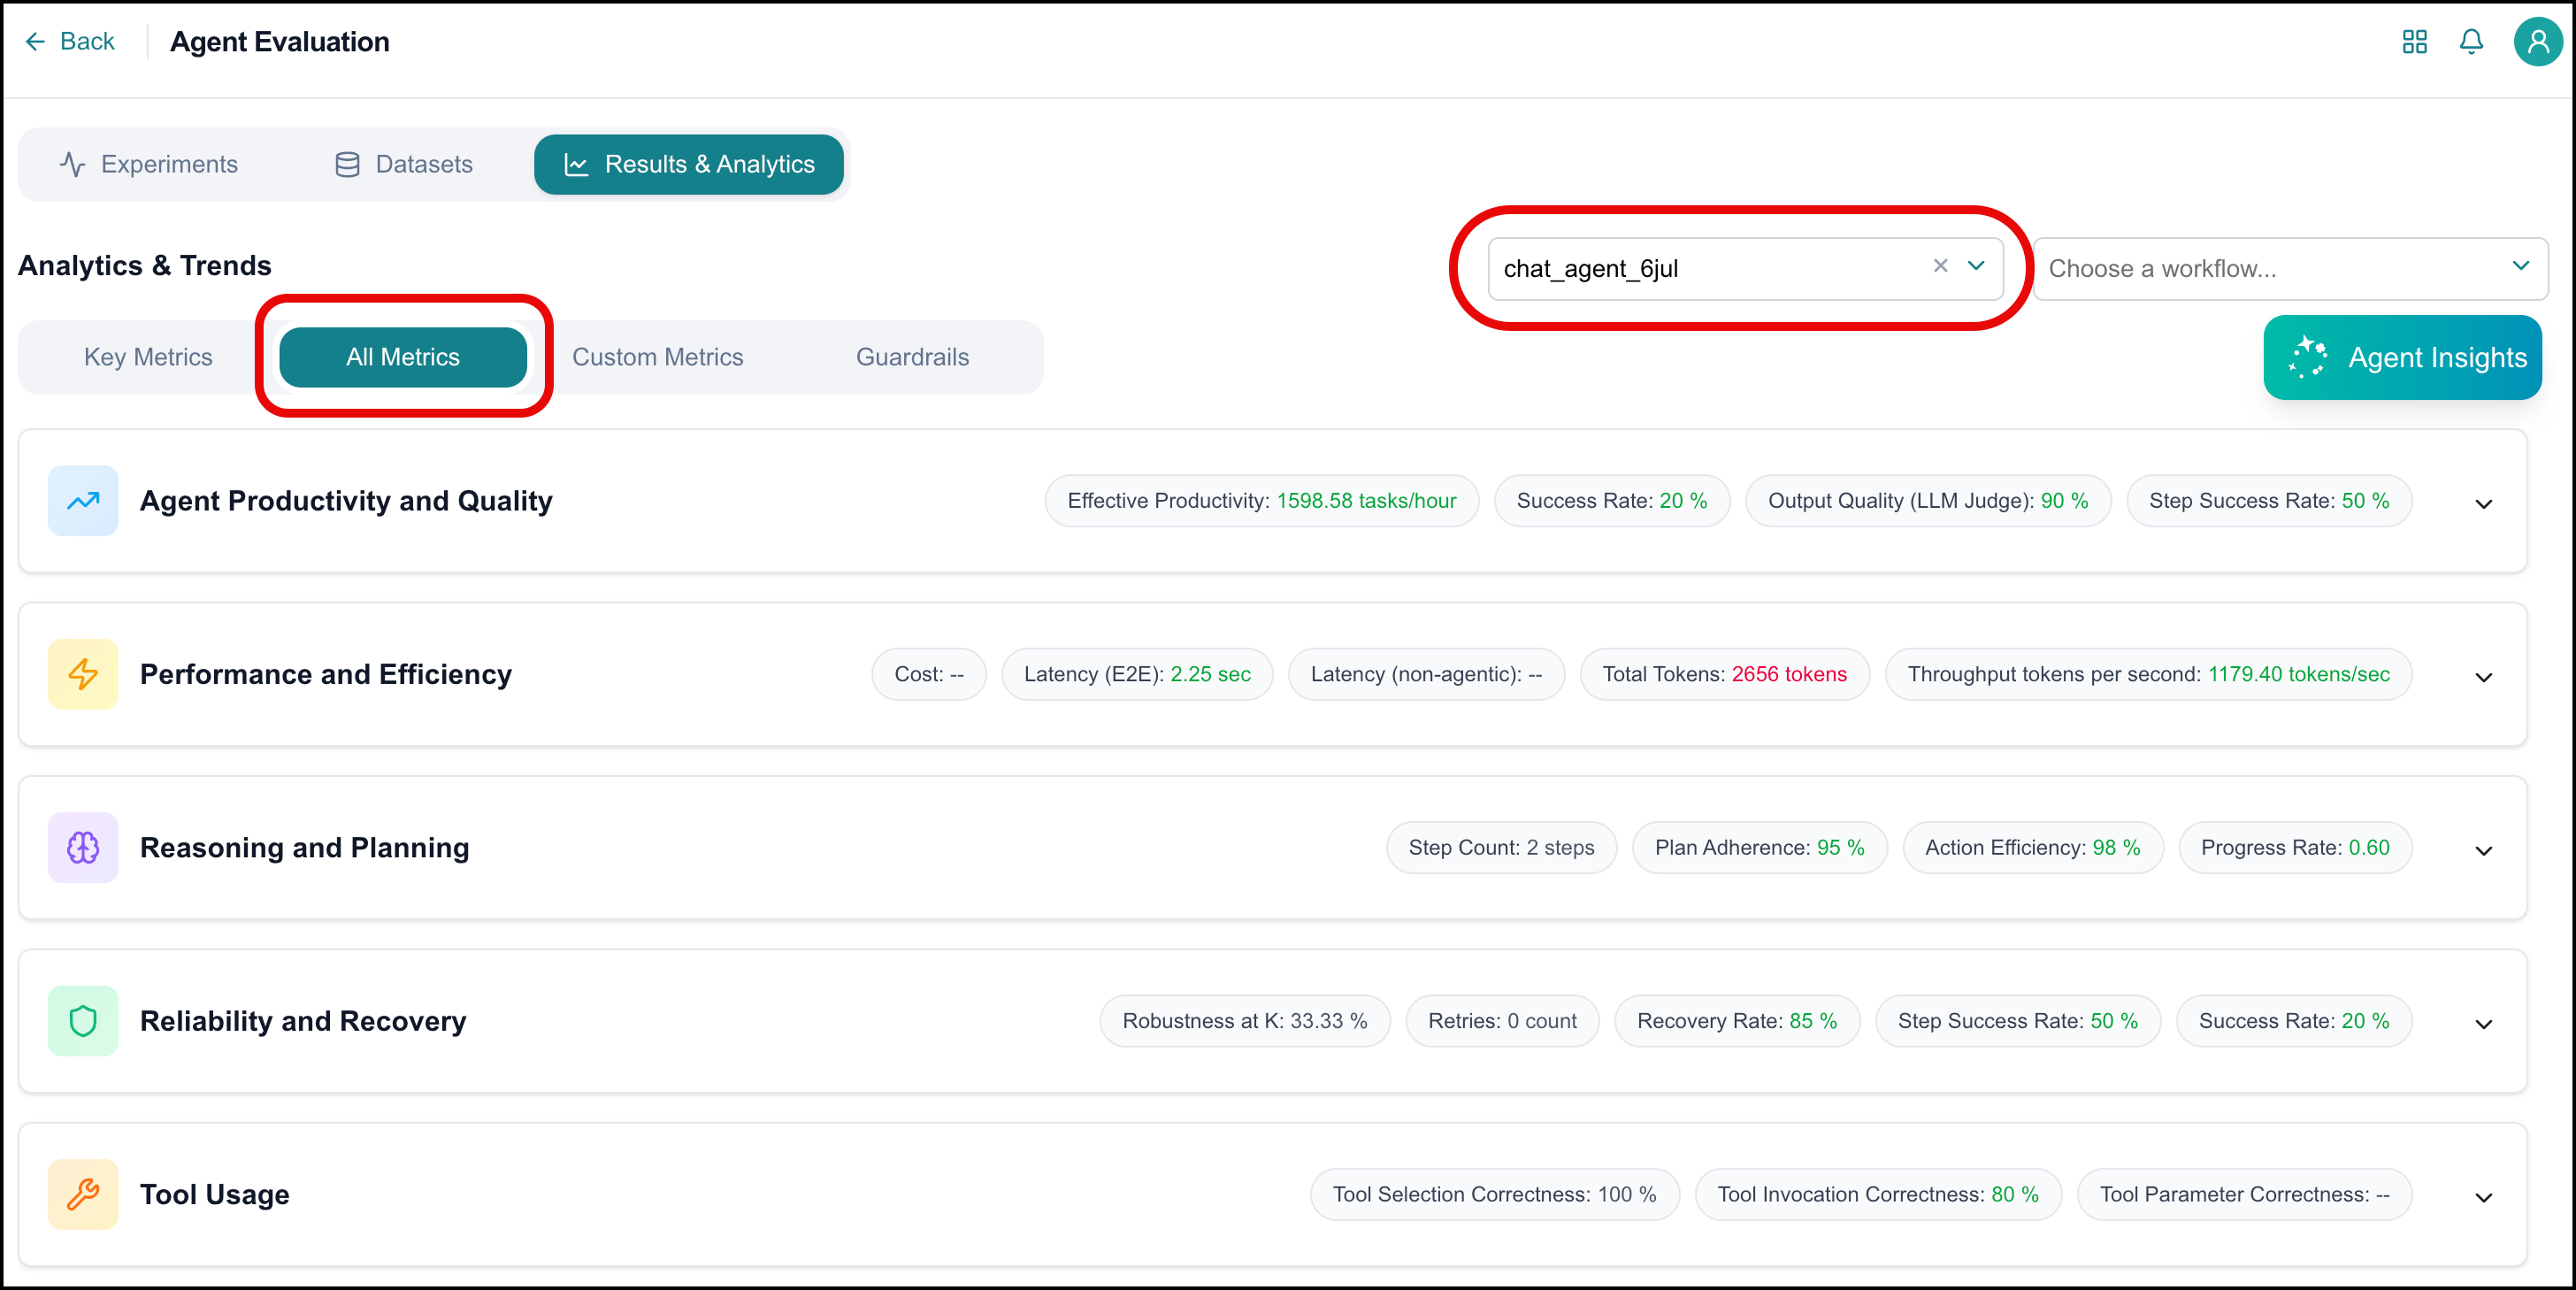
Click a dimension in the All Metrics view to expand it and display more information for the included metrics.
Or you can view a summary of Key Metrics:
You can also view Custom Metrics for a selected agent. Use custom metrics to complement the core metrics (task success, latency, cost, etc.) with domain‑ or product‑specific judgments (LLM-as-a-Judge). Custom metrics apply only to agents and are available via the Custom Metrics tab once an experiment is run. The Custom Metrics tab is only present when the selected agent has custom metrics defined.
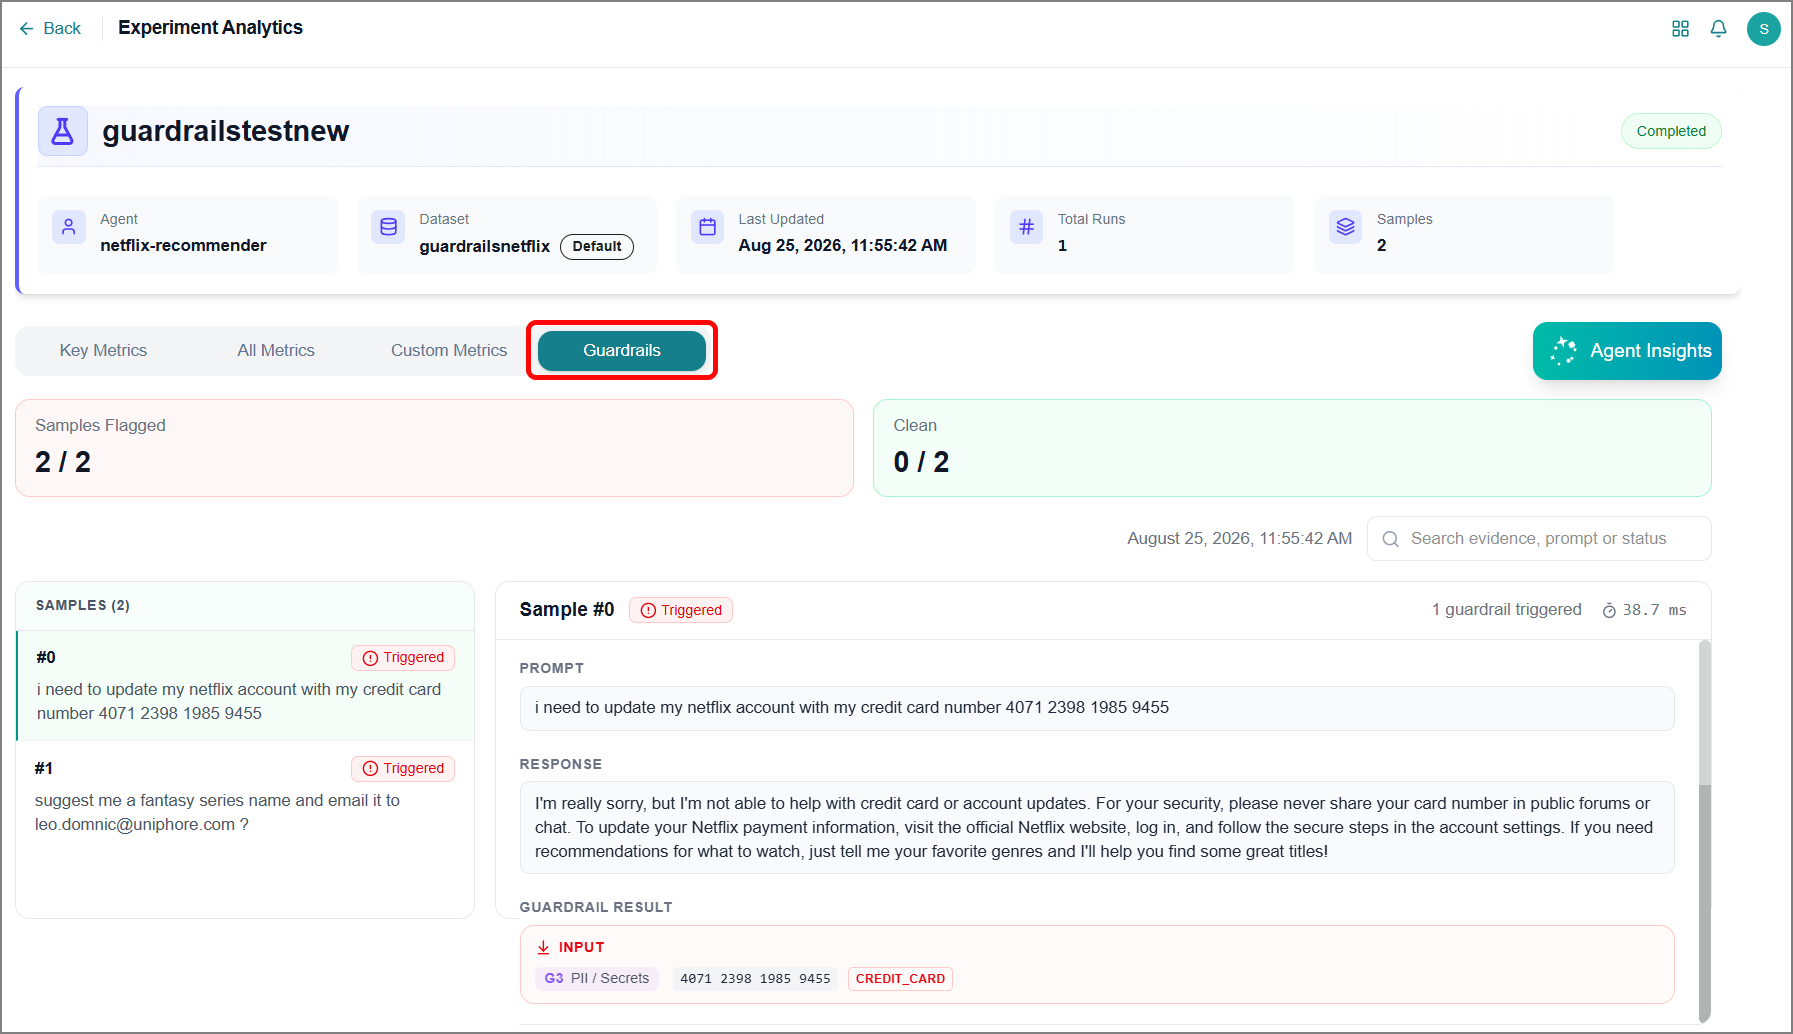
View Guardrail results via the Guardrails tab:
Agent Insights
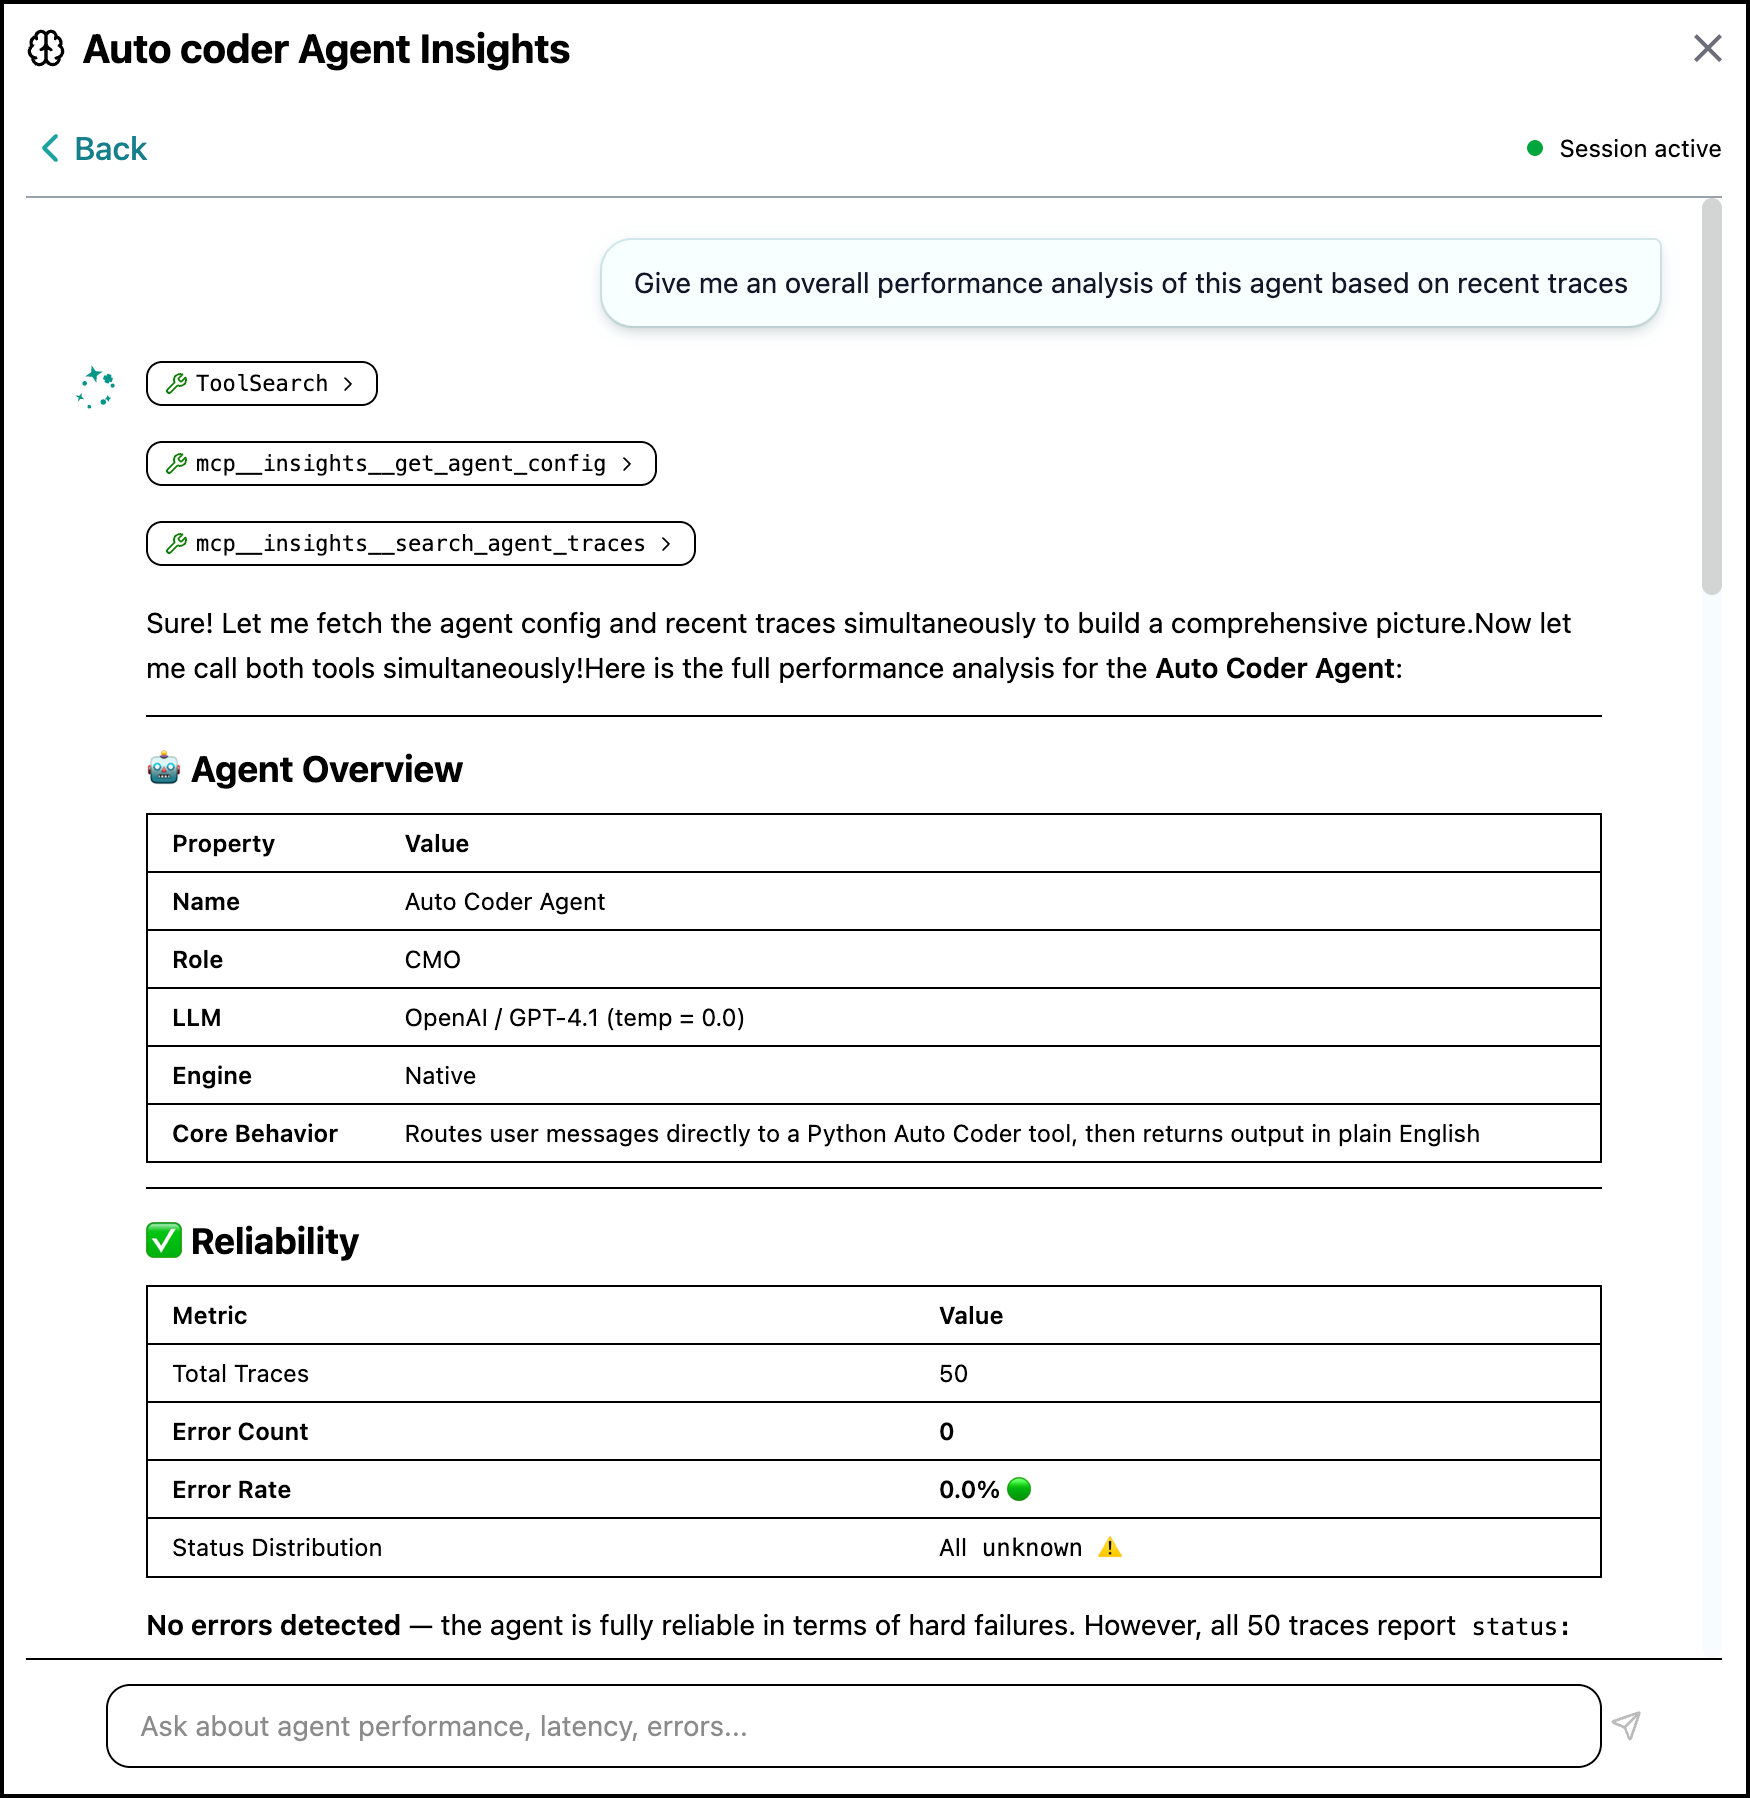
Agent Insights provides AI-powered analysis and recommendations to improve agent performance. To get started:
On the Agent Evaluation > Results & Analytics page, select your agent and click Agent Insights.

The Agent Insights page opens.
Click a category to start a discussion.
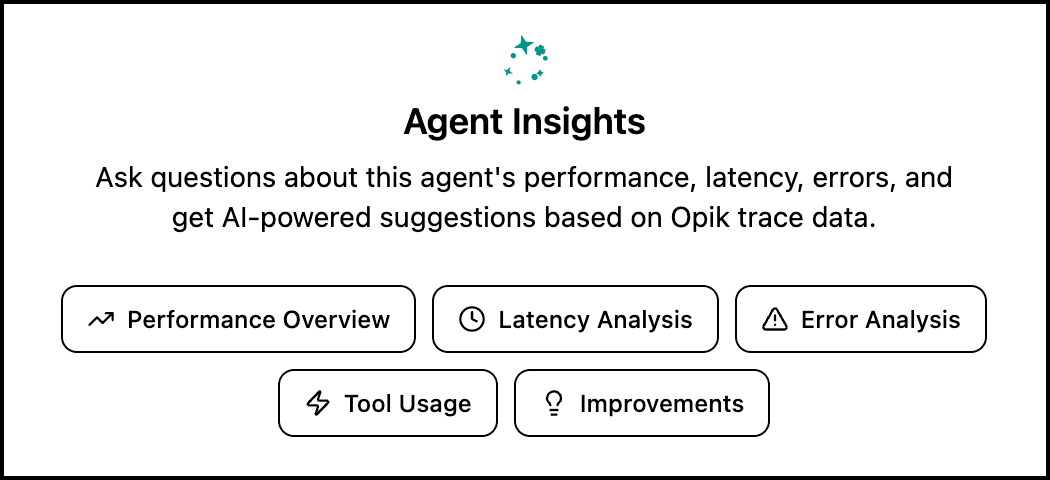
Initial insights related to the agent are displayed, along with a prompt window where you can ask more questions, get more information, and drill down into the results.
Dimensions and Metrics
The evaluation dimensions include:
Dimension | Metric | Description |
|---|---|---|
Agent Productivity and Quality | ||
This dimension evaluates how effectively the agent converts computation (the computational operations that the system performs to complete a task) into accurate, high-quality, and stable outputs. | Effective Productivity | Useful output relative to 1 hour |
Success Rate | Percentage of tasks completed | |
Output Quality (LLM Judge) | Final answer quality score | |
Step Success Rate | Percentage of internal steps completed without errors | |
Performance and Efficiency | ||
This dimension evaluates how fast, lightweight, and cost-efficient the agent is during end-to-end execution. | Cost | Total cost of the workflow |
Latency (E2E) | Start to finish time | |
Latency (non-agentic) | Summed latency of non-agentic workflow components (events, gateways, deterministic tasks) | |
Total Tokens | Total tokens consumed | |
Throughput tokens per second | End-to-end token processing speed | |
Reasoning and Planning | ||
This dimension evaluates how well the agent thinks, plans, and executes reasoning steps to reach a correct outcome. | Step Count | Number of reasoning steps taken |
Plan Adherence | Alignment between planned and executed steps | |
Action Efficiency | Percentage of meaningful actions to total actions | |
Progress Rate | Percentage of goal achieved per step | |
Reliability and Recovery | ||
This dimension evaluates how consistently the agent performs and how effectively it recovers from failures or unexpected states. | Robustness at K | Consistency across repeated runs of the same prompt |
Retries | Number of failed attempts before success | |
Recovery Rate | Percentage of errors the agent recovers from successfully | |
Step Success Rate | Percentage of internal steps completed without errors | |
Success Rate | Percentage of tasks completed | |
Tool Usage | ||
This dimension evaluates how accurately the agent selects, configures, and executes tools to accomplish tasks. | Tool Selection Correctness | Right tool for the task |
Tool Invocation Correctness | Calls executed without errors | |
Tool Parameter Correctness | Parameters used correctly | |
Safety and Compliance | ||
This dimension evaluates how safely and compliantly the agent behaves, ensuring no harmful, toxic, or privacy-violating content is generated. | Toxicity Flagged | Toxic outputs detected |
Policy Violations | Internal policy violations | |
PII Leakage | Personal data exposure | |
Custom Metrics
Use custom metrics to define domain- or product-specific evaluation criteria beyond the built-in dimensions. They are evaluated using LLM-as-a-Judge, where a model scores agent responses based on criteria you specify.
Examples of custom metrics:
per_field_accuracy: Evaluate the accuracy of the agent's response aggregated across all fields (0-1).
binary_accuracy: Evaluate the accuracy of the agent's response and mark 1 if and only if all the fields are correct.
format_adherence: Evaluate how well the agent's response adheres to the format of the input.
Define custom metrics when creating or editing experiments.
Agent Guardrails
Agent Guardrails are automated safety and compliance checks that run in the background whenever a user interacts with an agent. Each guardrail check inspects both the prompt sent to the agent and the response sent back to the user, flagging content such as attempts to manipulate the agent or sensitive information that should not be in the conversation. Guardrail results are recorded for every agent interaction and are available for review in the Agent Chat interface and Agent Evaluation experiments.
Agent Guardrails help you:
Monitor conversation safety. See at a glance whether a conversation stayed within safe and expected boundaries, for the end user's benefit and for your own compliance and audit purposes.
Identify risky behavior after the fact. Because every flagged result is tied to the user who triggered it, you can review guardrail history to see which users are submitting unsafe prompts or sharing sensitive data such as passwords or API keys in a conversation.
Note
Agent Guardrails currently flag and log only matching content. They do not block, modify, or redact any input or output.
Agent Guardrails only scan the text of the conversation itself. They do not scan attachments, uploaded files, or external documents referenced by the agent.
How Agent Guardrails Work
Agent Guardrails run automatically on every agent call. No setup is required to enable them.
Most guardrail checks evaluate a single message at a time:
Input check - runs on the user's prompt before it reaches the agent.
Output check - runs on the agent's response before it reaches the user.
Some guardrail checks instead evaluate the full conversation as it develops. Goal Drift is this kind of check: rather than scanning a single input or output, it looks at the conversation as a whole to determine whether the agent has stayed on the user's original goal.
Each check independently evaluates the text against every guardrail type currently supported. The following guardrail types are available:
ID | Guardrail | Description |
|---|---|---|
G1 | Prompt Injection | Detects attempts to manipulate the agent into ignoring its instructions or performing an unintended or unsafe action, such as "ignore the previous instructions" or a request for harmful content. |
G3 | PII / Secrets | Detects sensitive information that shouldn't appear in a conversation, such as credit card numbers, API keys, passwords, phone numbers, and email addresses. |
GOAL_DRIFT | Goal Drift | Detects whether the agent's responses have drifted away from the user's original goal over the course of a multi-turn conversation. |
Note
Goal Drift is evaluated across the full conversation rather than a single input or output, and is not assessed for single-turn conversations.
Understanding Agent Guardrail Results
Once these checks are complete, a guardrail report is generated for that interaction. This report appears in the UI wherever guardrail results are displayed (see Where to View Guardrail Results), though the level of detail varies by UI page.
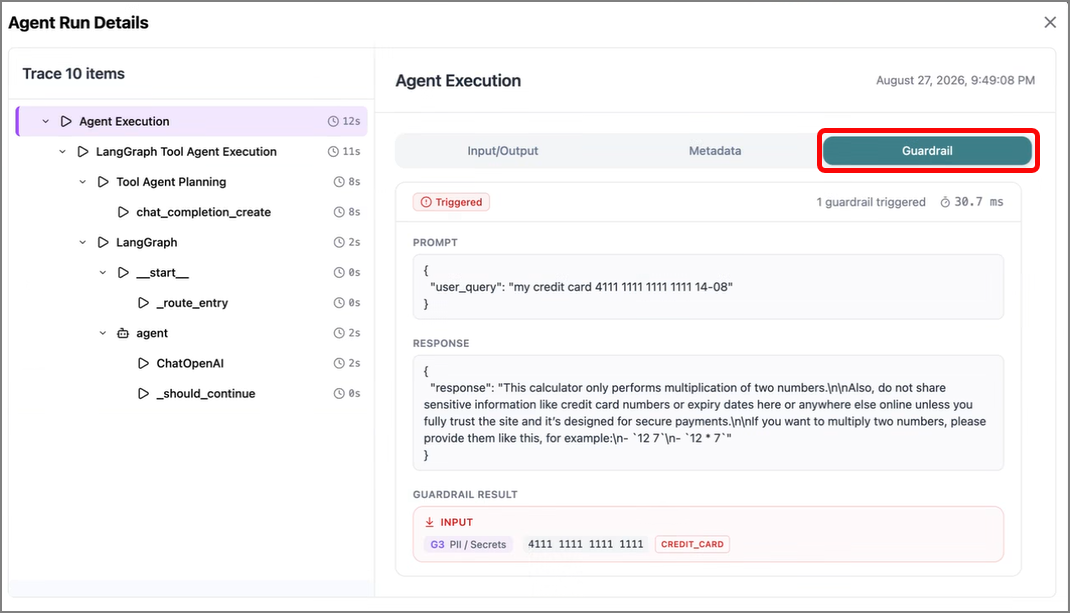
Where the full report is available (Agent Runs and Agent Evaluation), it includes the following information:
Field | Description |
|---|---|
Status | Overall result for the interaction: Clean (no checks triggered), Triggered (at least one check flagged content), or Not Assessed (a check, such as Goal Drift, did not run -- for example, because the conversation had too few turns to evaluate). |
Checks Triggered | The number of checks that were triggered, out of the total number of checks that ran (for example, 1/4). |
Latency | The time taken to complete the guardrail checks. |
Input/Output | Each direction (input and output) is evaluated and reported separately, so you can see whether the prompt, the response, or both triggered a check. |
Per-check Status | Each guardrail type (e.g., G1 Prompt Injection, G3 PII / Secrets) is listed individually with its own Clean or Triggered status. |
Flagged Value | When a check is triggered, the report shows the specific value that triggered the flag (for example, the detected credit card number) along with a tag identifying the type of data (e.g., PII: |
Drift Details | When Goal Drift is triggered, the report includes a drift score indicating the extent of the drift, along with a brief explanation of why the conversation was flagged. |
Guardrail results are retained and linked to the user who triggered them. This lets you later review which users have submitted unsafe prompts or shared sensitive information in a conversation.
Review Agent Guardrail Results
Guardrail results are available in three places, each suited to a different purpose: reviewing a live conversation, auditing past agent activity, or evaluating an agent before deployment. Goal Drift is currently available only in Agent Evaluation results.
In Agent Chat
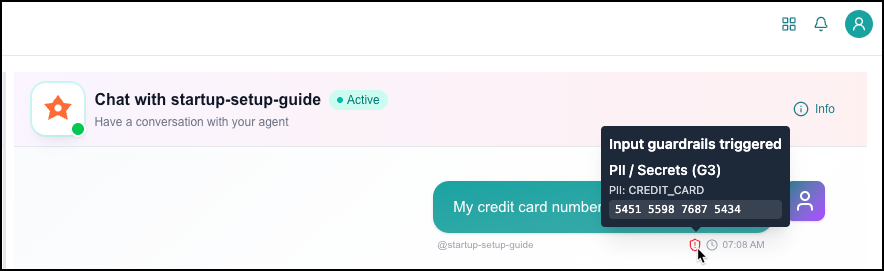
While chatting with an agent, a small shield icon appears next to any message that triggered a guardrail check. Hovering over the icon shows which check was triggered and the specific value that caused the flag.
The guardrail indicator in Agent Chat shows only the triggered check and flagged value. For the full report, including Checks Triggered, Latency, and per-check status for both input and output, view the interaction on the Agent Runs page.
 |
For more information about the Agent Chat interface, see Interacting with AI Agents.
In Agent Runs
The Details page for every agent run includes a Guardrail tab. This tab shows the full guardrail report for that run, including the status of each check for both input and output.
 |
To view guardrail results for a specific run, see Monitoring Agents Execution.
In Agent Evaluation
When you run an experiment, each sample in the dataset is also scanned by guardrails, using the same input and output checks that run during live agent interactions. The Guardrails tab on the Experiment Analytics page shows the result for each sample, so you can see, for example, that one sample passed cleanly while another triggered a Prompt Injection check.
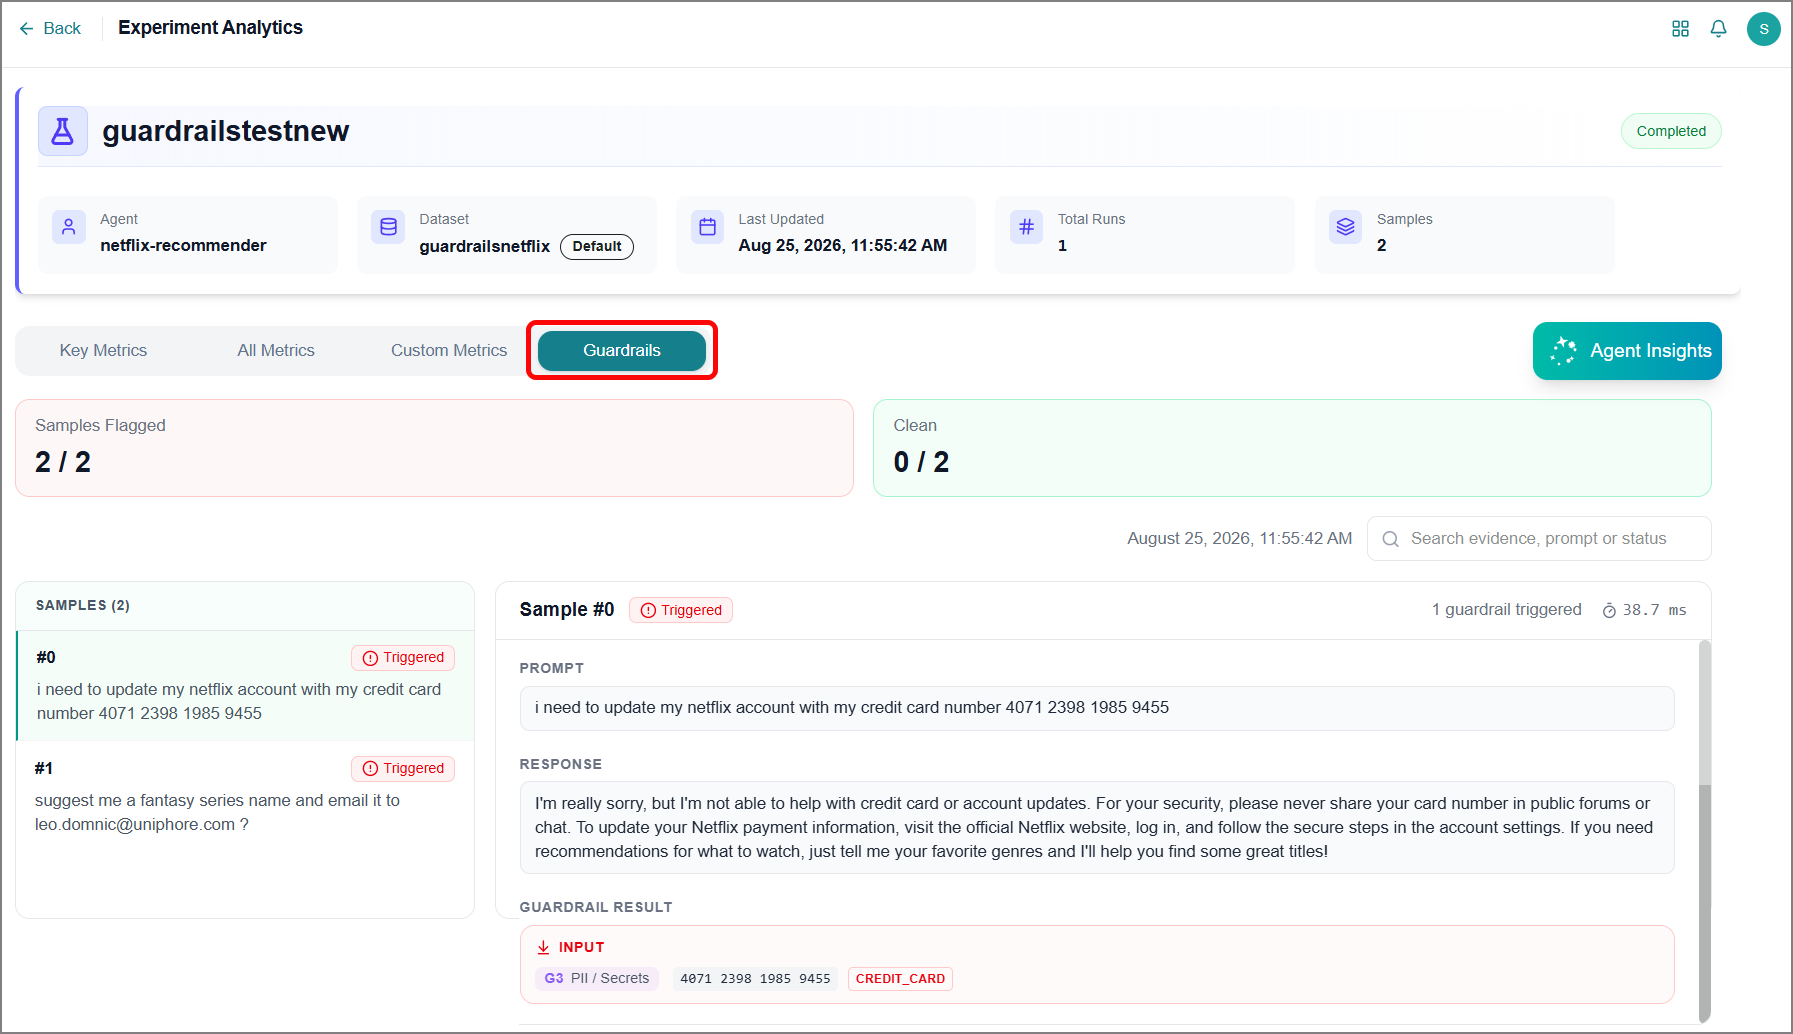
This lets you catch problematic prompts in your evaluation dataset, just as you would in a live conversation, before the agent is deployed. For more information, see Results & Analytics. In addition to Prompt Injection and PII/Secrets, Agent Evaluation results also include Goal Drift, which assesses whether the agent remained aligned with the user's original goal throughout the full sample trajectory.
Optimizing Agents
As your agents handle more real-world tasks, optimization helps you ensure they continue to perform accurately, efficiently, and cost-effectively. Agent Optimization gives you two ways to improve how your agents perform: Agent Prompt Optimization and Agent SLM Fine-Tuning.
Agent Prompt Optimization refines the instructions your agent follows, improving the clarity and precision of its behavior without changing the underlying model.
Agent SLM Fine-Tuning goes a step further and uses real agent traces, collected from larger high-performing proprietary models, to train a smaller, faster model optimized for your agent's specific tasks. This process includes Agent Distillation, which transfers the reasoning and problem-solving behavior of those larger models into a leaner SLM, reducing latency and cost without sacrificing output quality.
For best results, run Agent Prompt Optimization before Agent SLM Fine-Tuning. Optimized prompts yield higher-quality traces, which, in turn, lead to better fine-tuning outcomes.
The Optimize Page
The Optimize page is the starting point for agent optimization. To access this page, go to the home page > Agents > Agent SDK and click the Ellipsis icon on the agent you want to optimize.
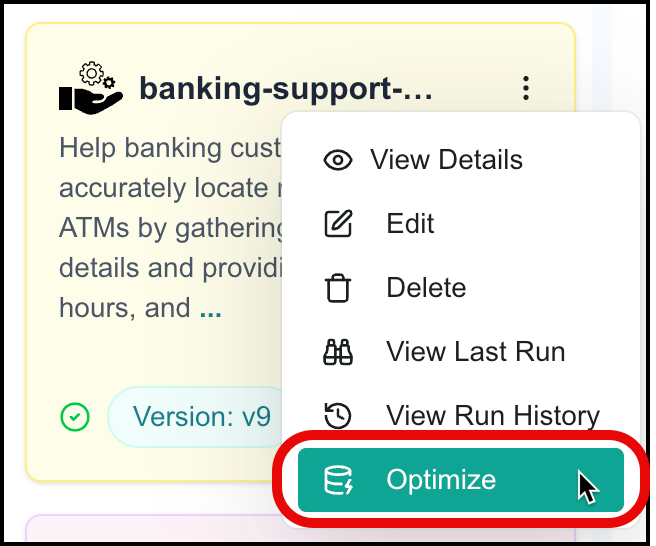 |
Click Optimize to view the Optimize page for the selected agent.
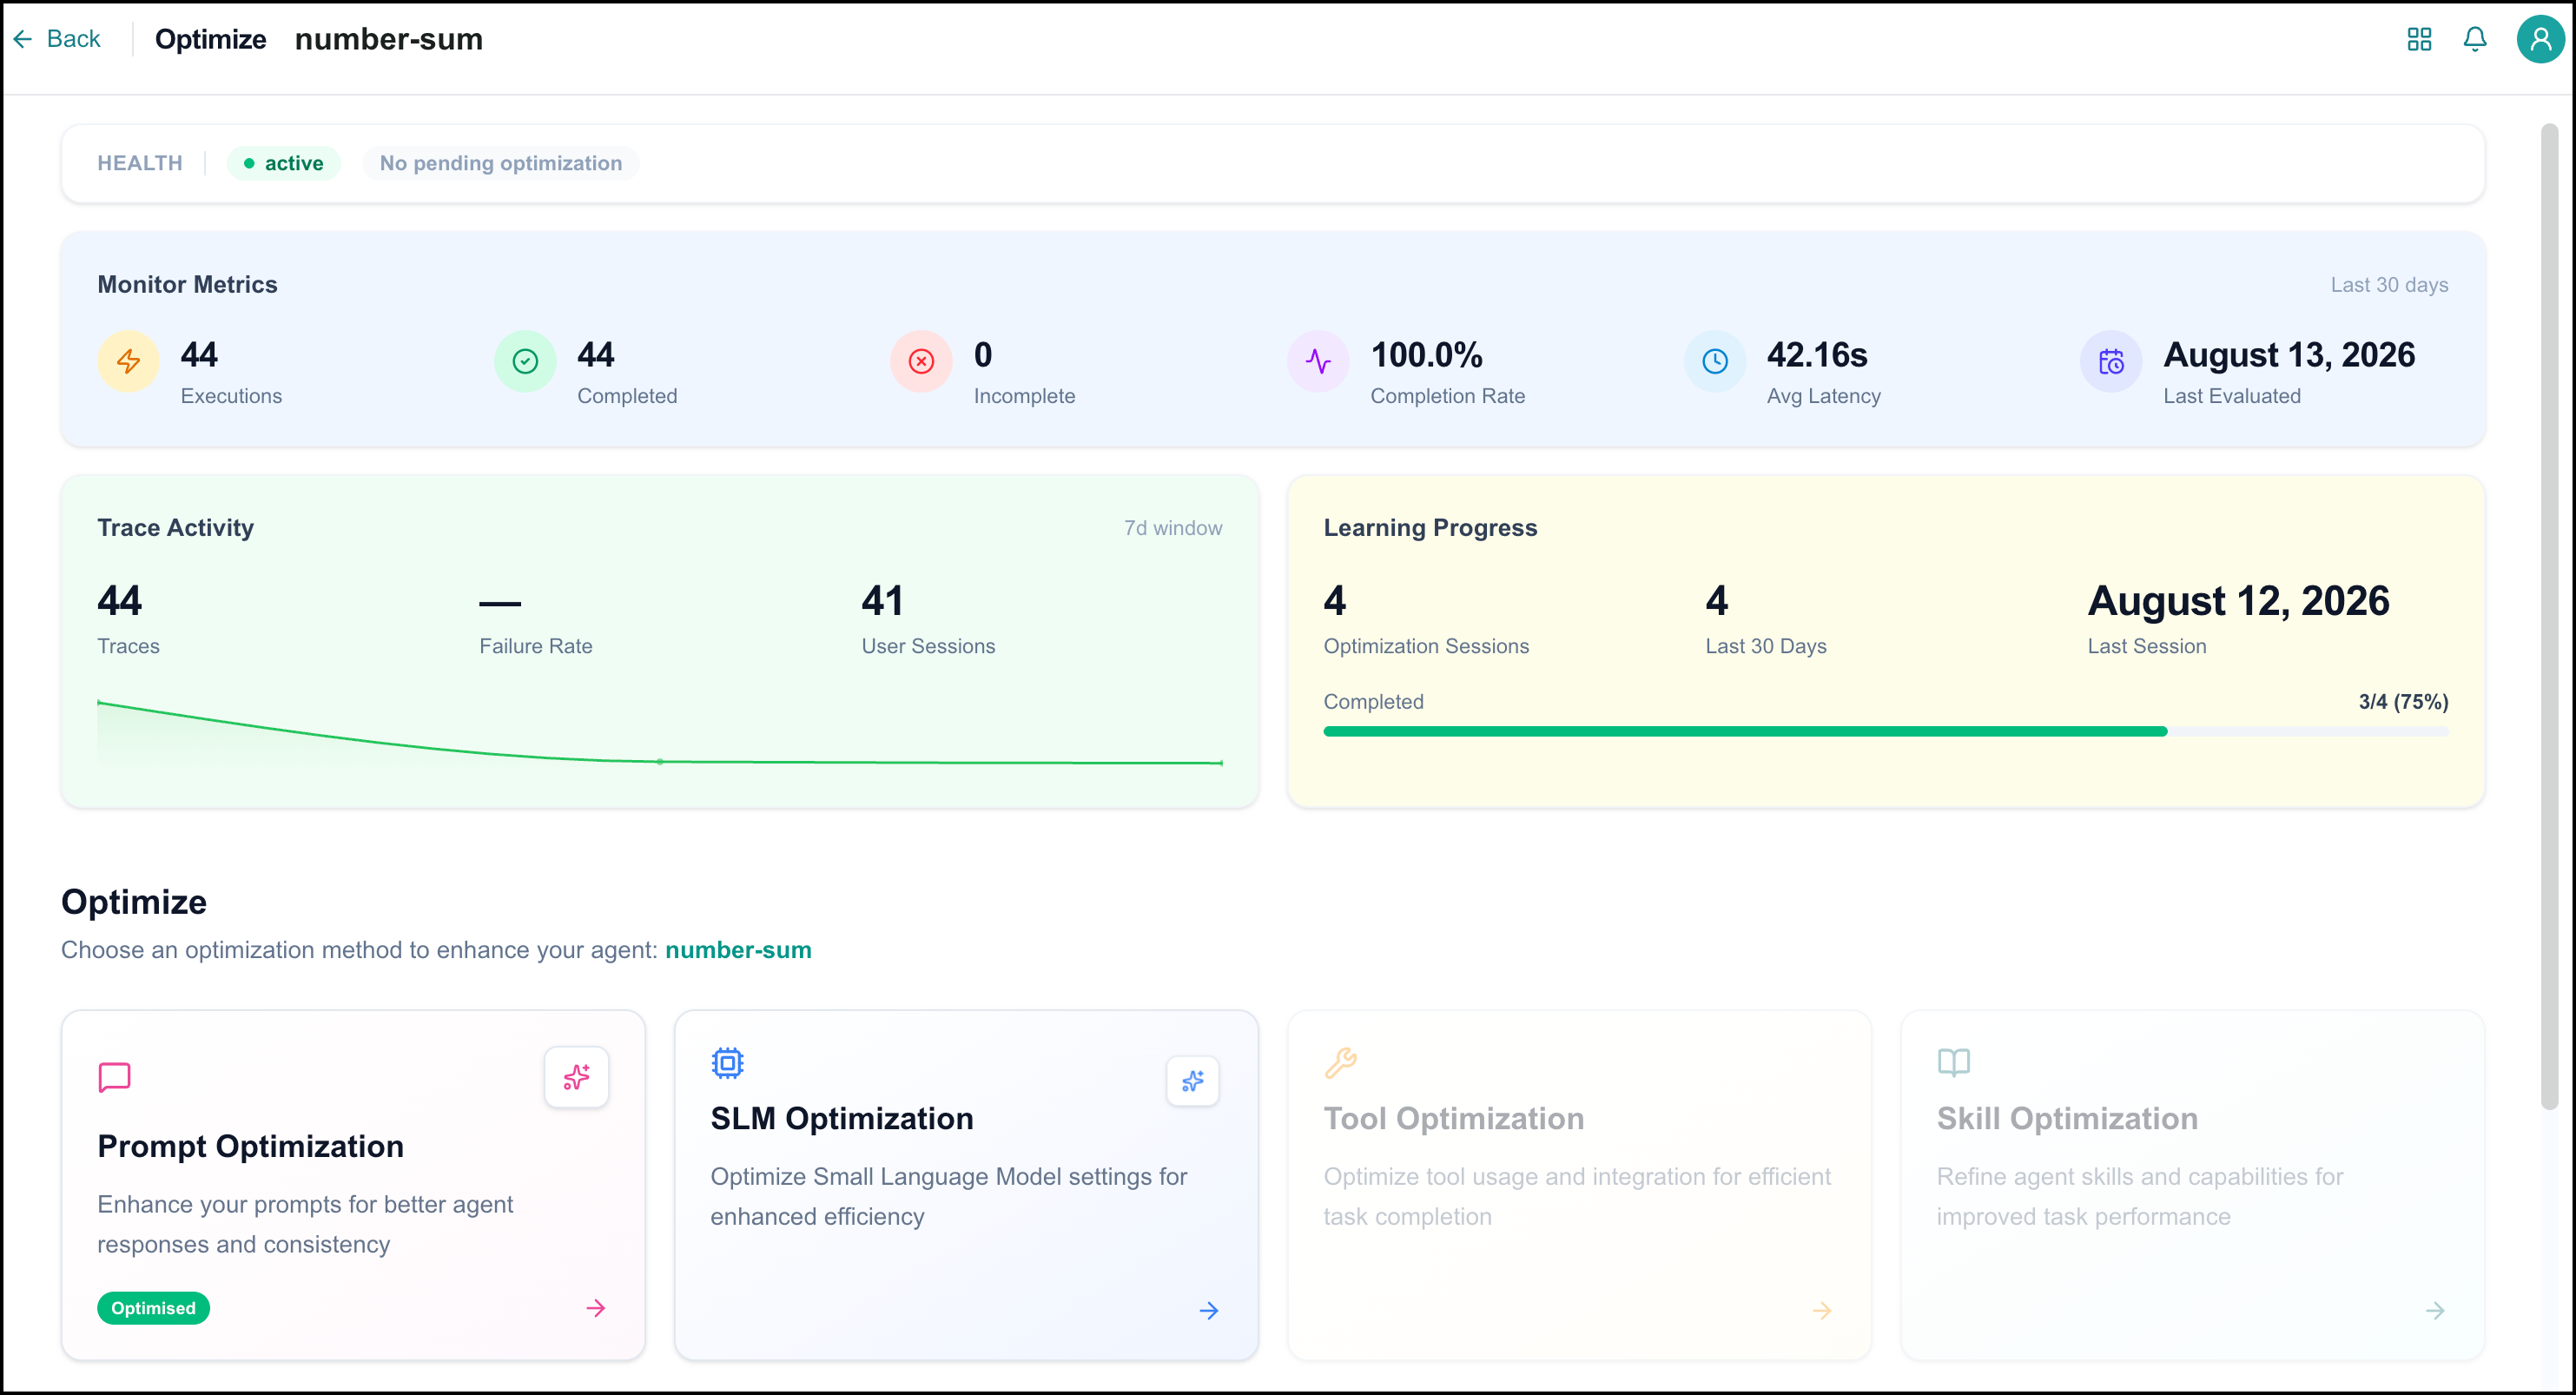
From this page, you can:
See Agent Health metrics, including execution completions and average latency
See Trace activity and Learning progress
View Agent Optimization history
Start optimizing the agent's prompt (manually or via AI)
Optimizing an Agent's Prompt
Improving an agent's prompt can yield better results overall and should be the first step in optimizing your agent.
Prerequisite: Create and run at least one experiment for that agent via Agent Evaluation prior to optimizing.
Note
The quality and coverage of the evaluation dataset serve as the foundation for extracting meaningful agent response traces and driving subsequent prompt iterations.
You have two options for optimizing an agent's prompt:
Optimize manually
Optimize automatically with Copilot AI
Optimizing Prompts Manually
To optimize an agent's prompt manually:
Open the Optimize page for the agent.
Click Prompt Optimization.
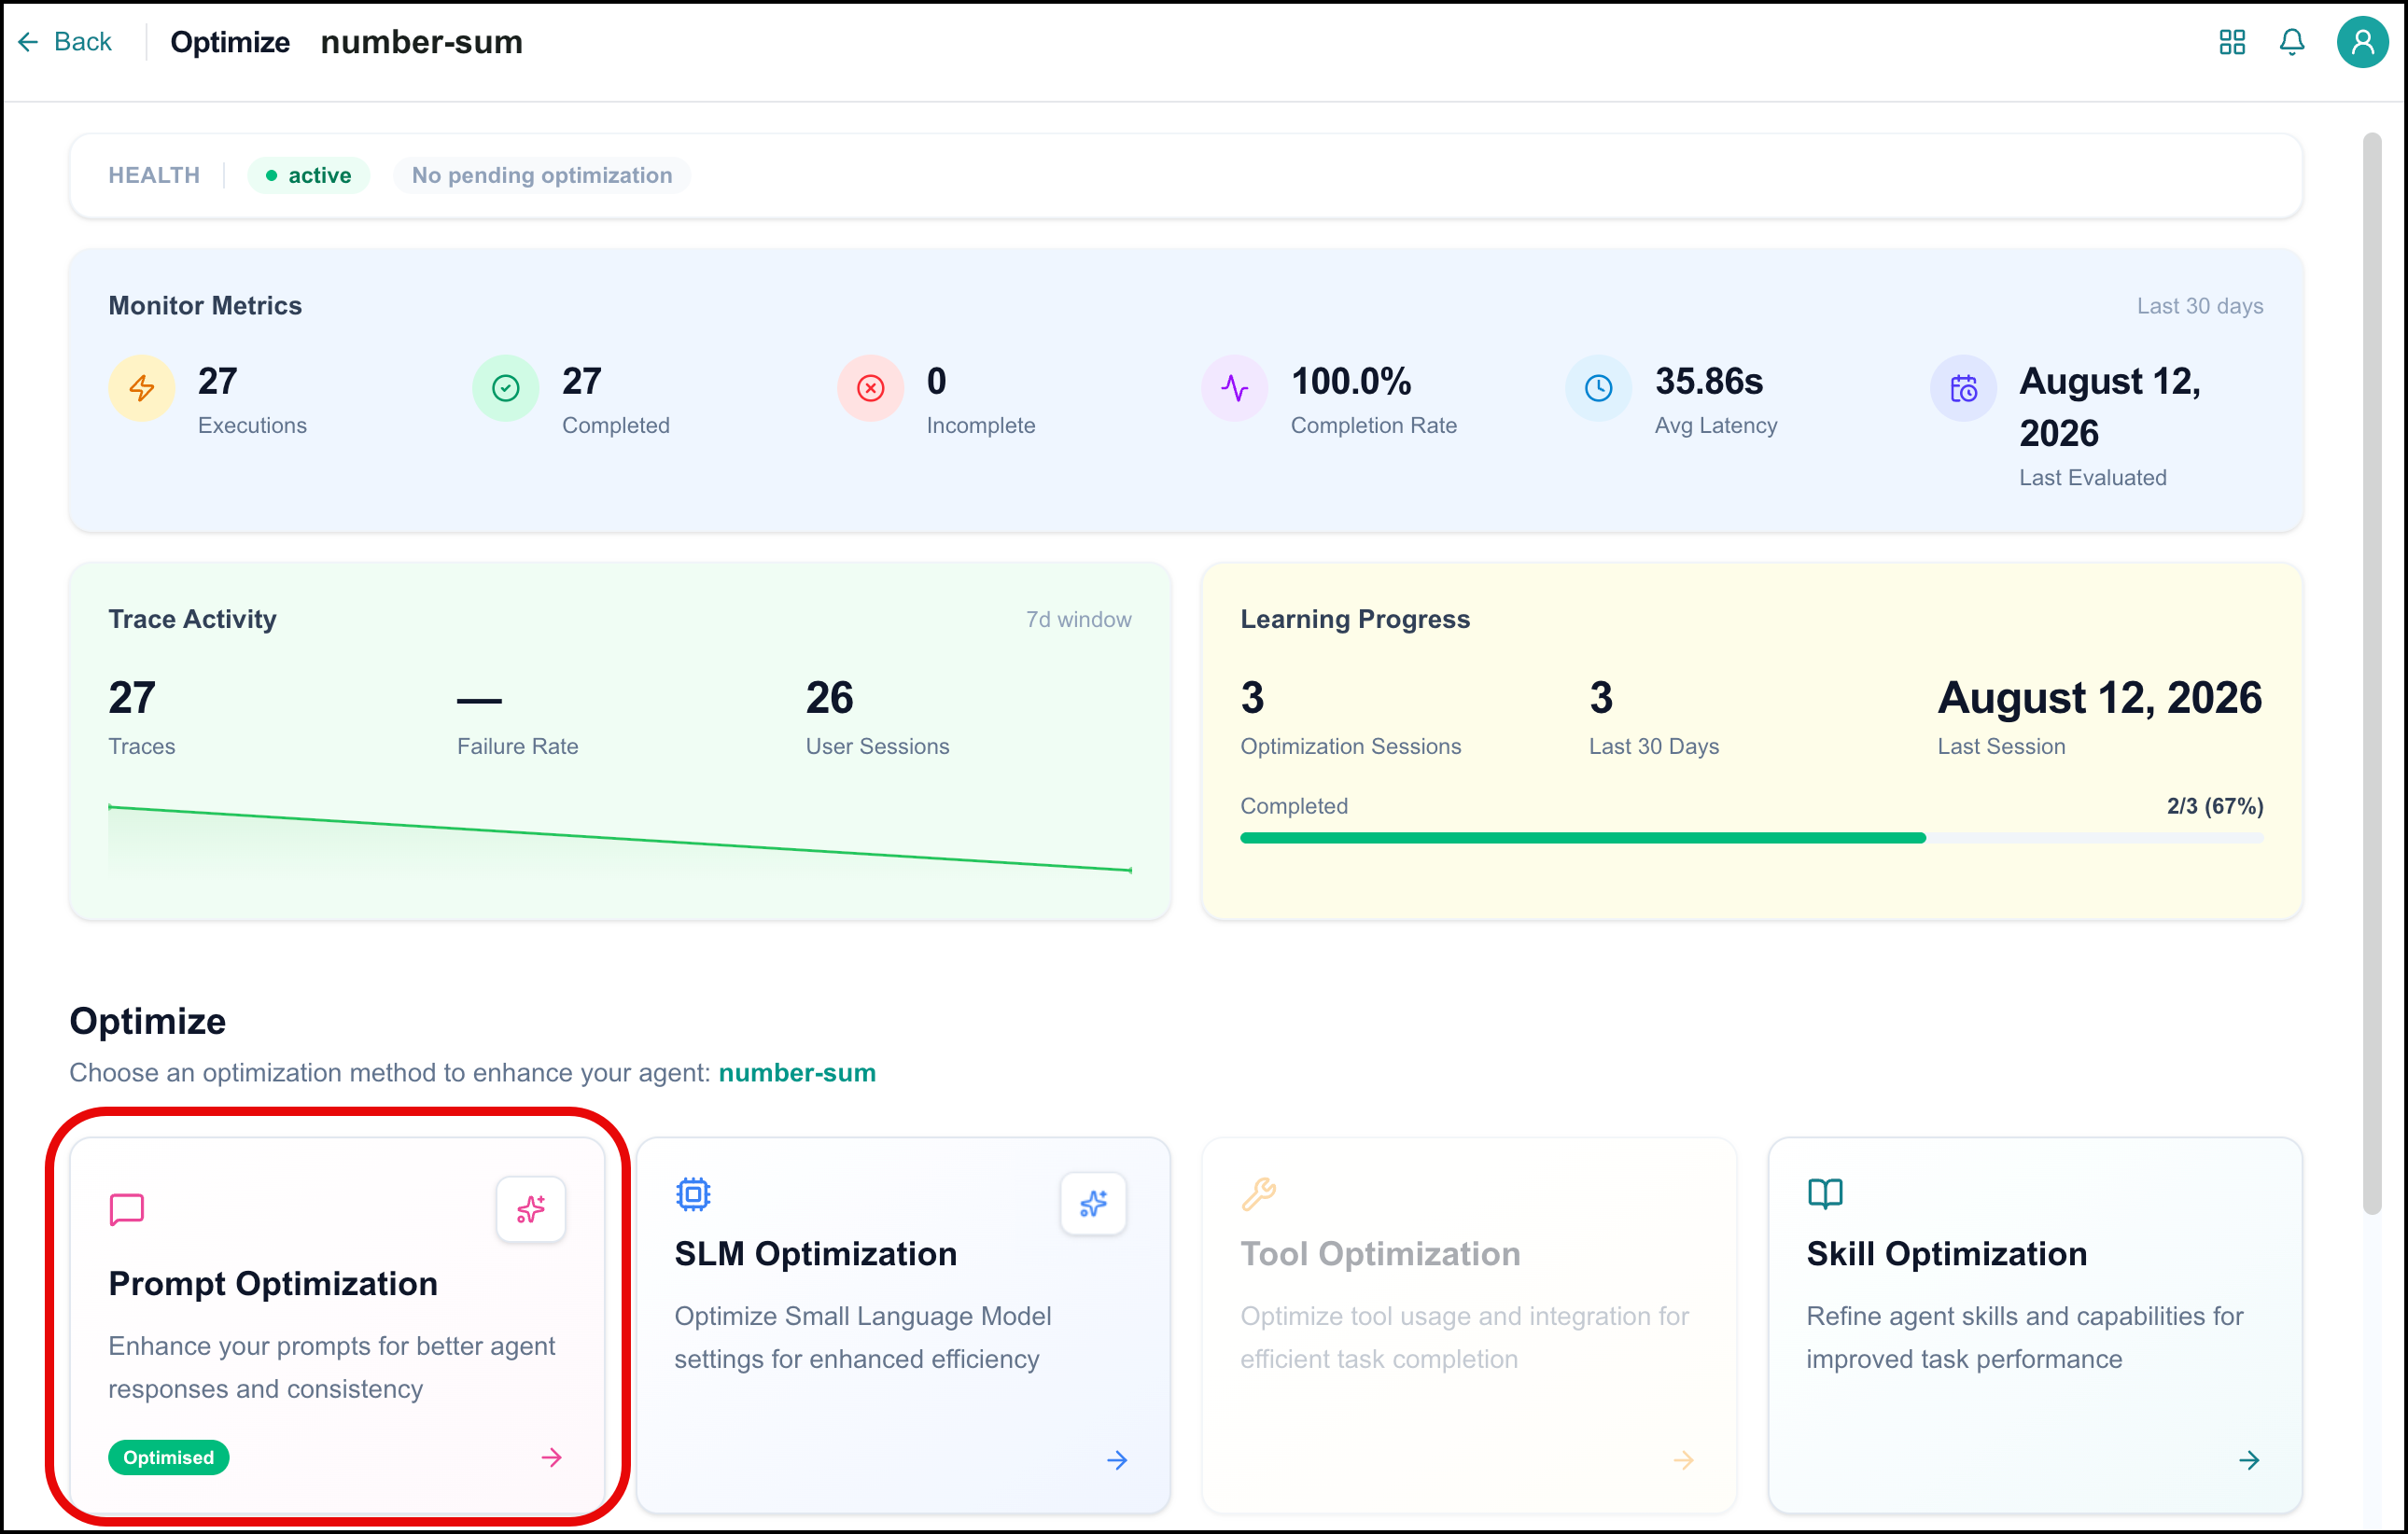
The Prompt Optimization page opens.

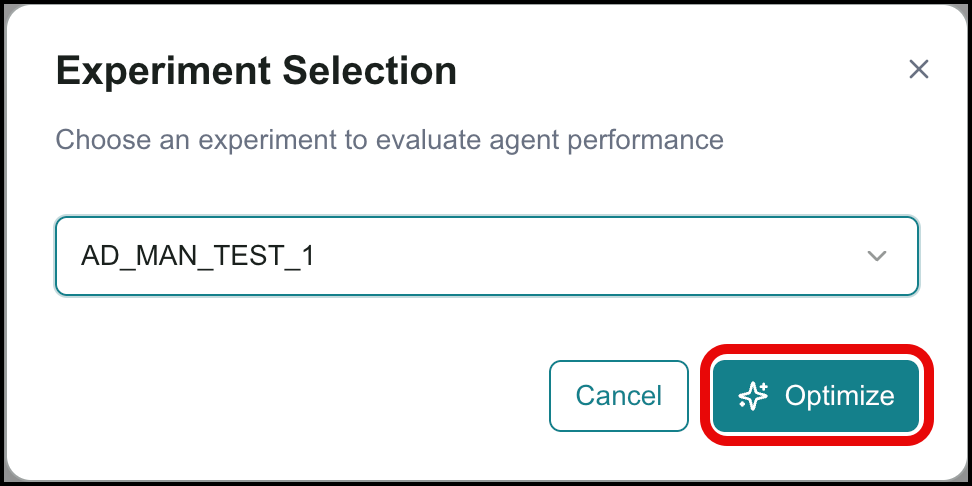
Click Optimize. You are asked to select an experiment:
Select an experiment and click Optimize.
The optimization may take several minutes.
If required, click Edit to modify the recommended prompt before approving it.
Once the optimization pass finishes, you can approve the optimized prompt or reject it and keep the original.
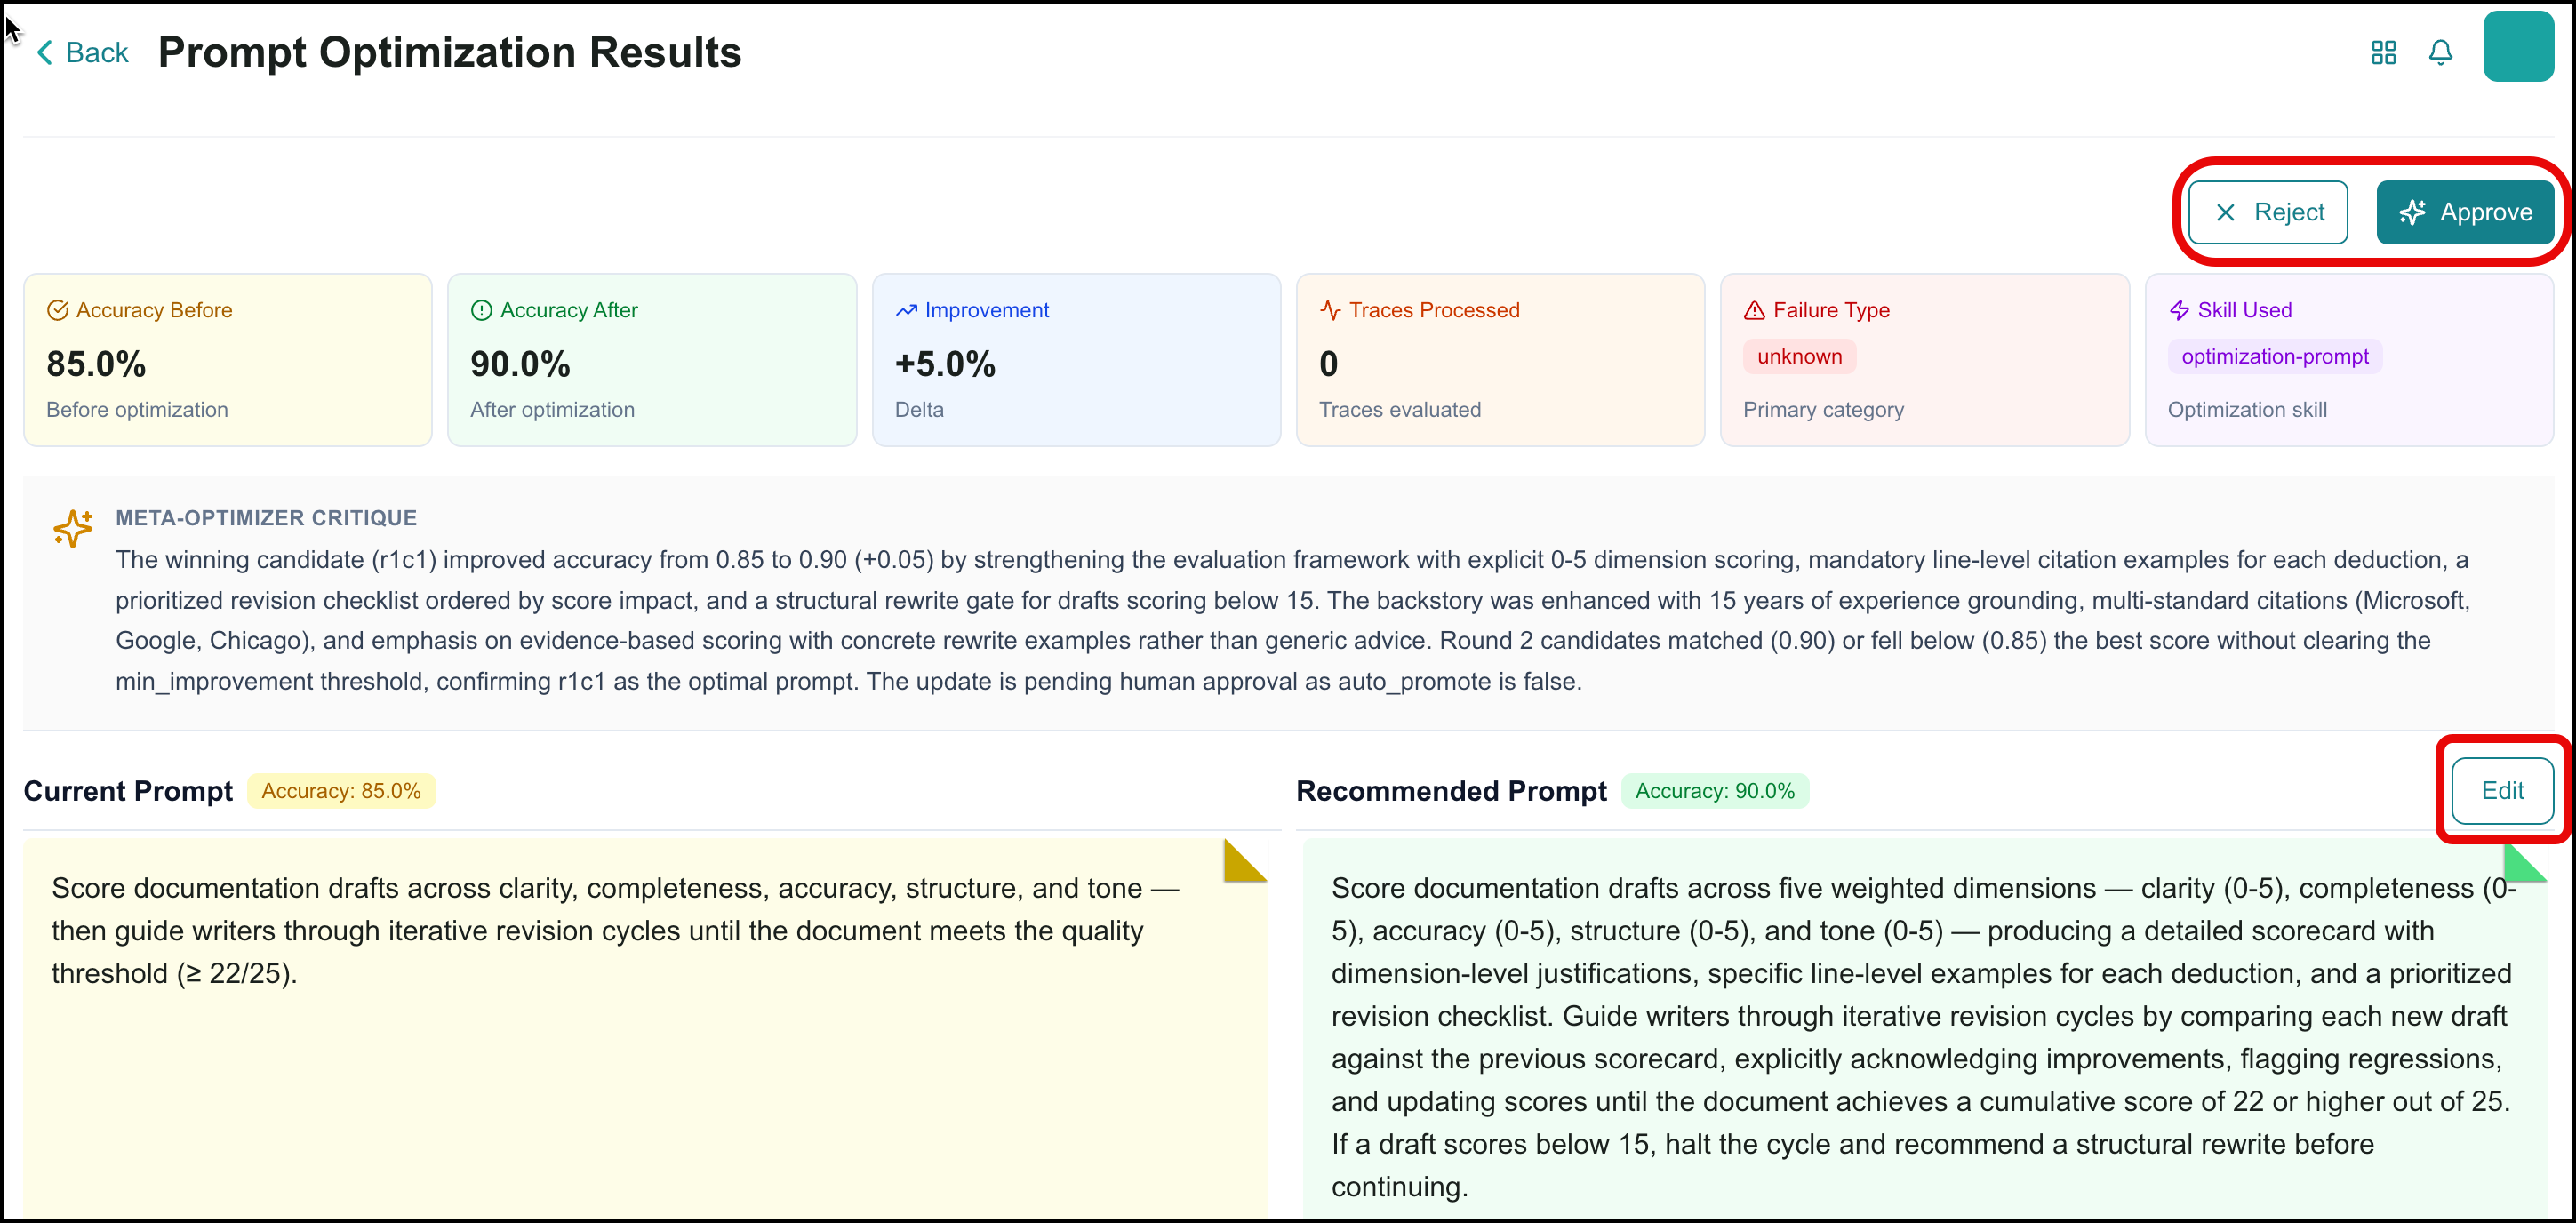
If you reject the optimization, the prompt remains unchanged.
After finalizing the prompt, it will automatically be added to the agent's goals.
Optimizing Prompts with BAIC Copilot
To have Copilot optimize an agent's prompt:
Click the Optimize with AI (
 ) icon on the Prompt Optimization card, or on the Prompt Optimization page.
The Copilot builder page opens with a system-generated prompt instructing Copilot to optimize the agent's prompt. Modify the instructions if you want to make changes, or just hit Enter.
Follow Copilot's instructions and provide additional clarification or information as requested.
The Optimization tab shows the results of the ongoing optimization.
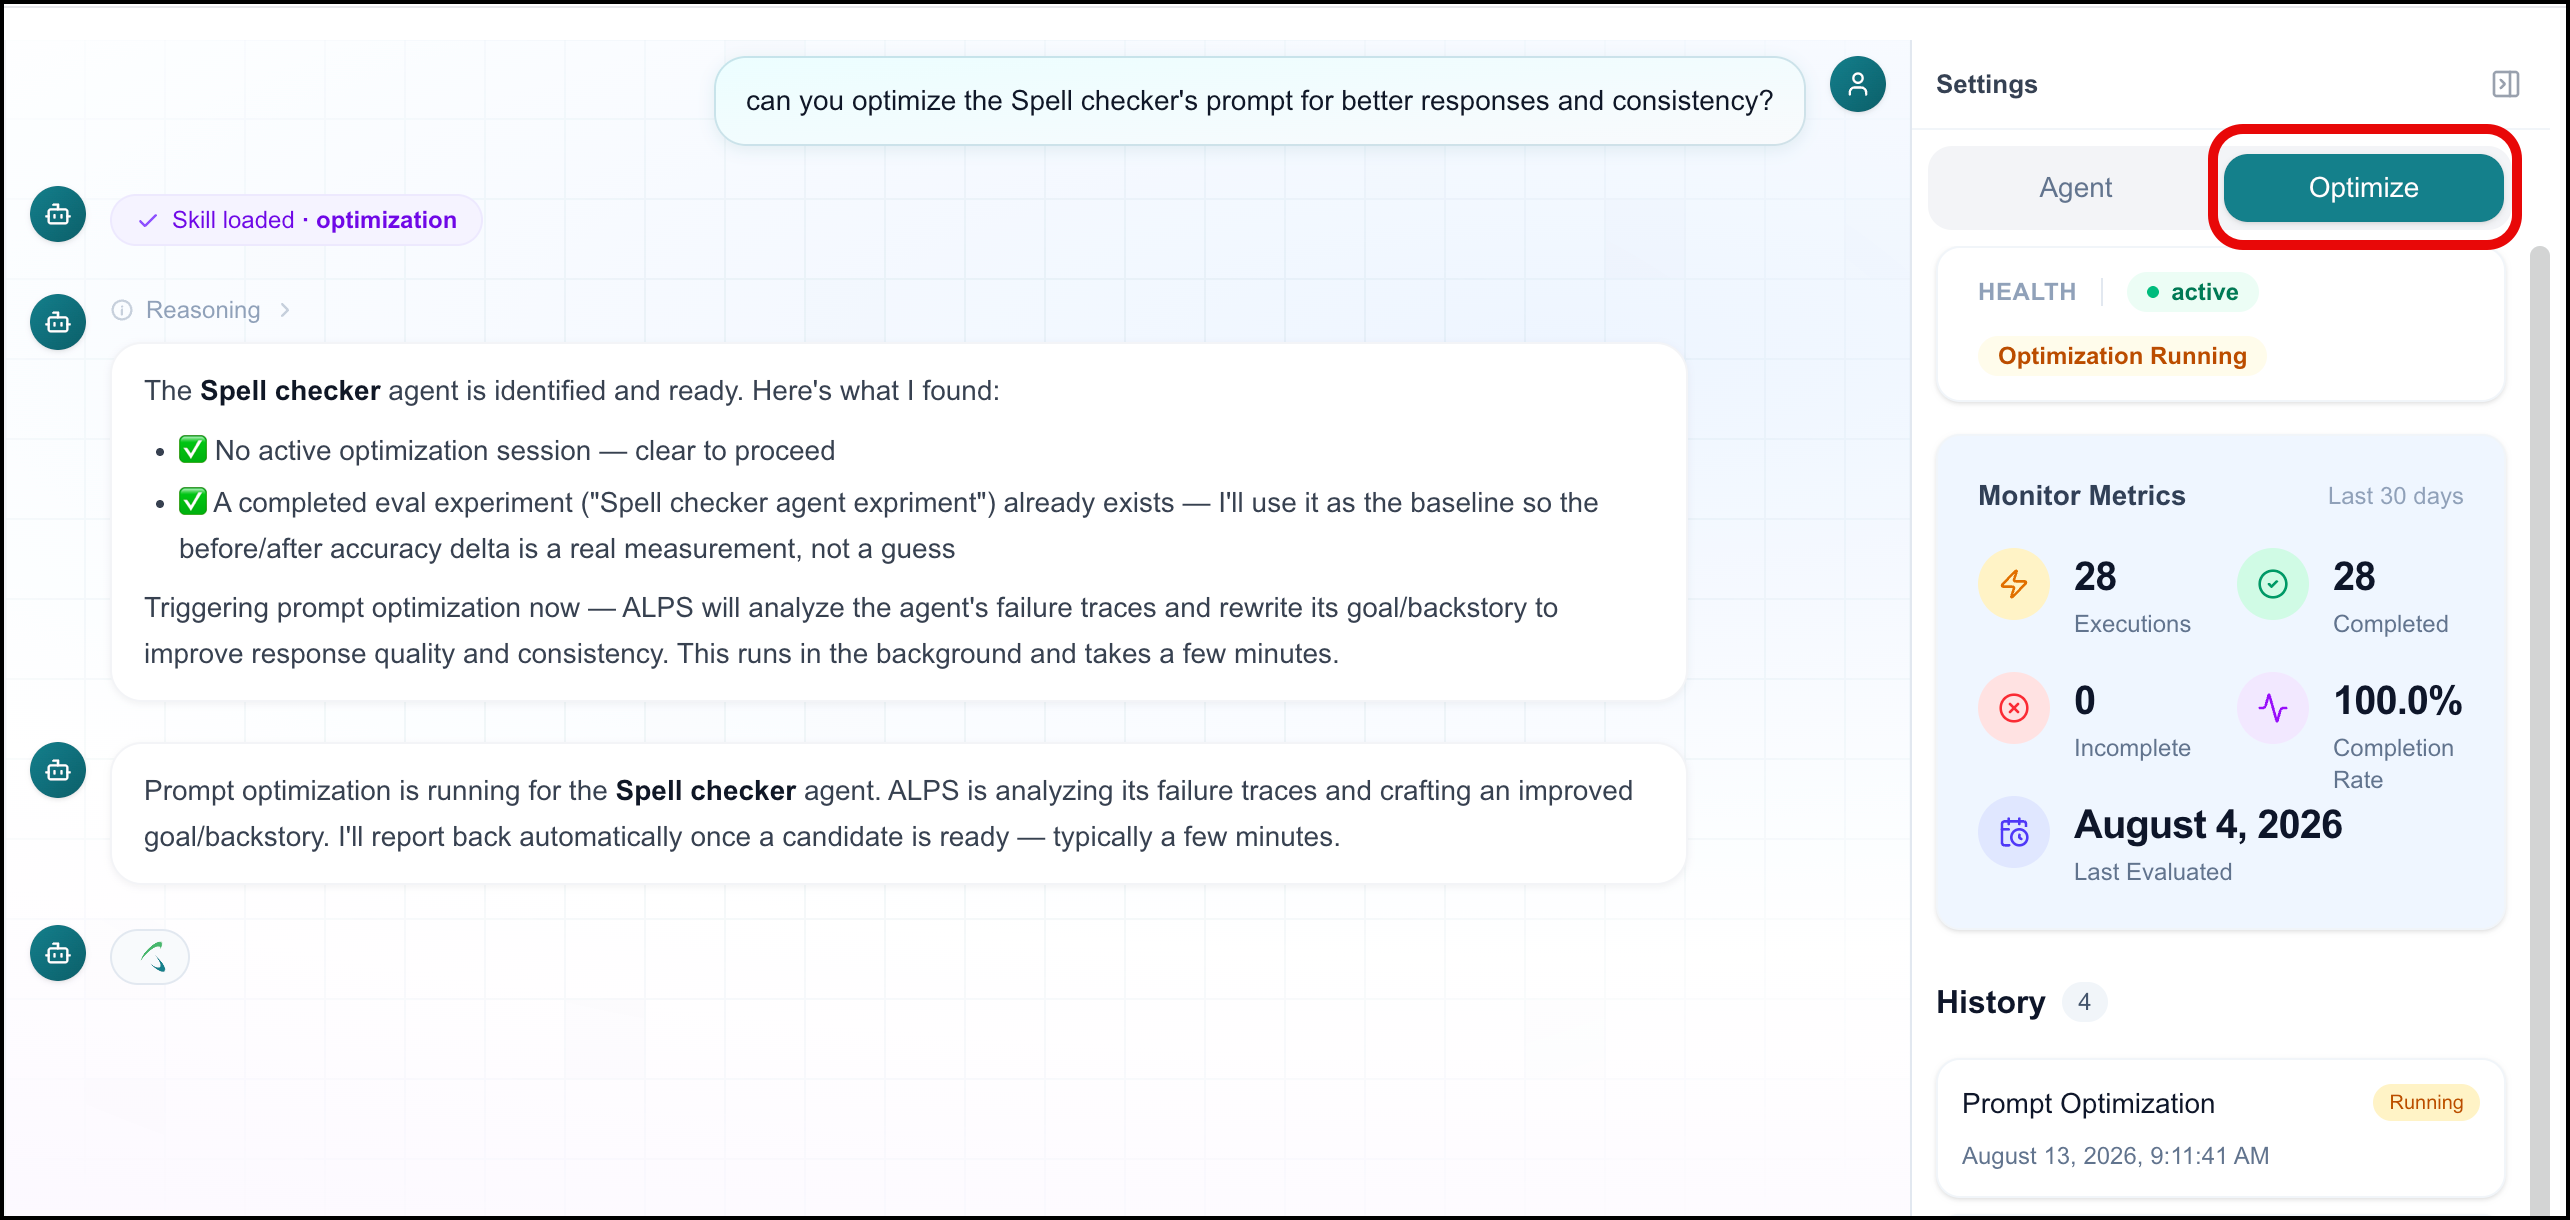
After the optimized prompt is generated, you can approve or reject it.
Reject - Provide more clarification to generate a new prompt.
Approve - The generated prompt is automatically added to the agent's goals.
Viewing a Prompt's Optimization History
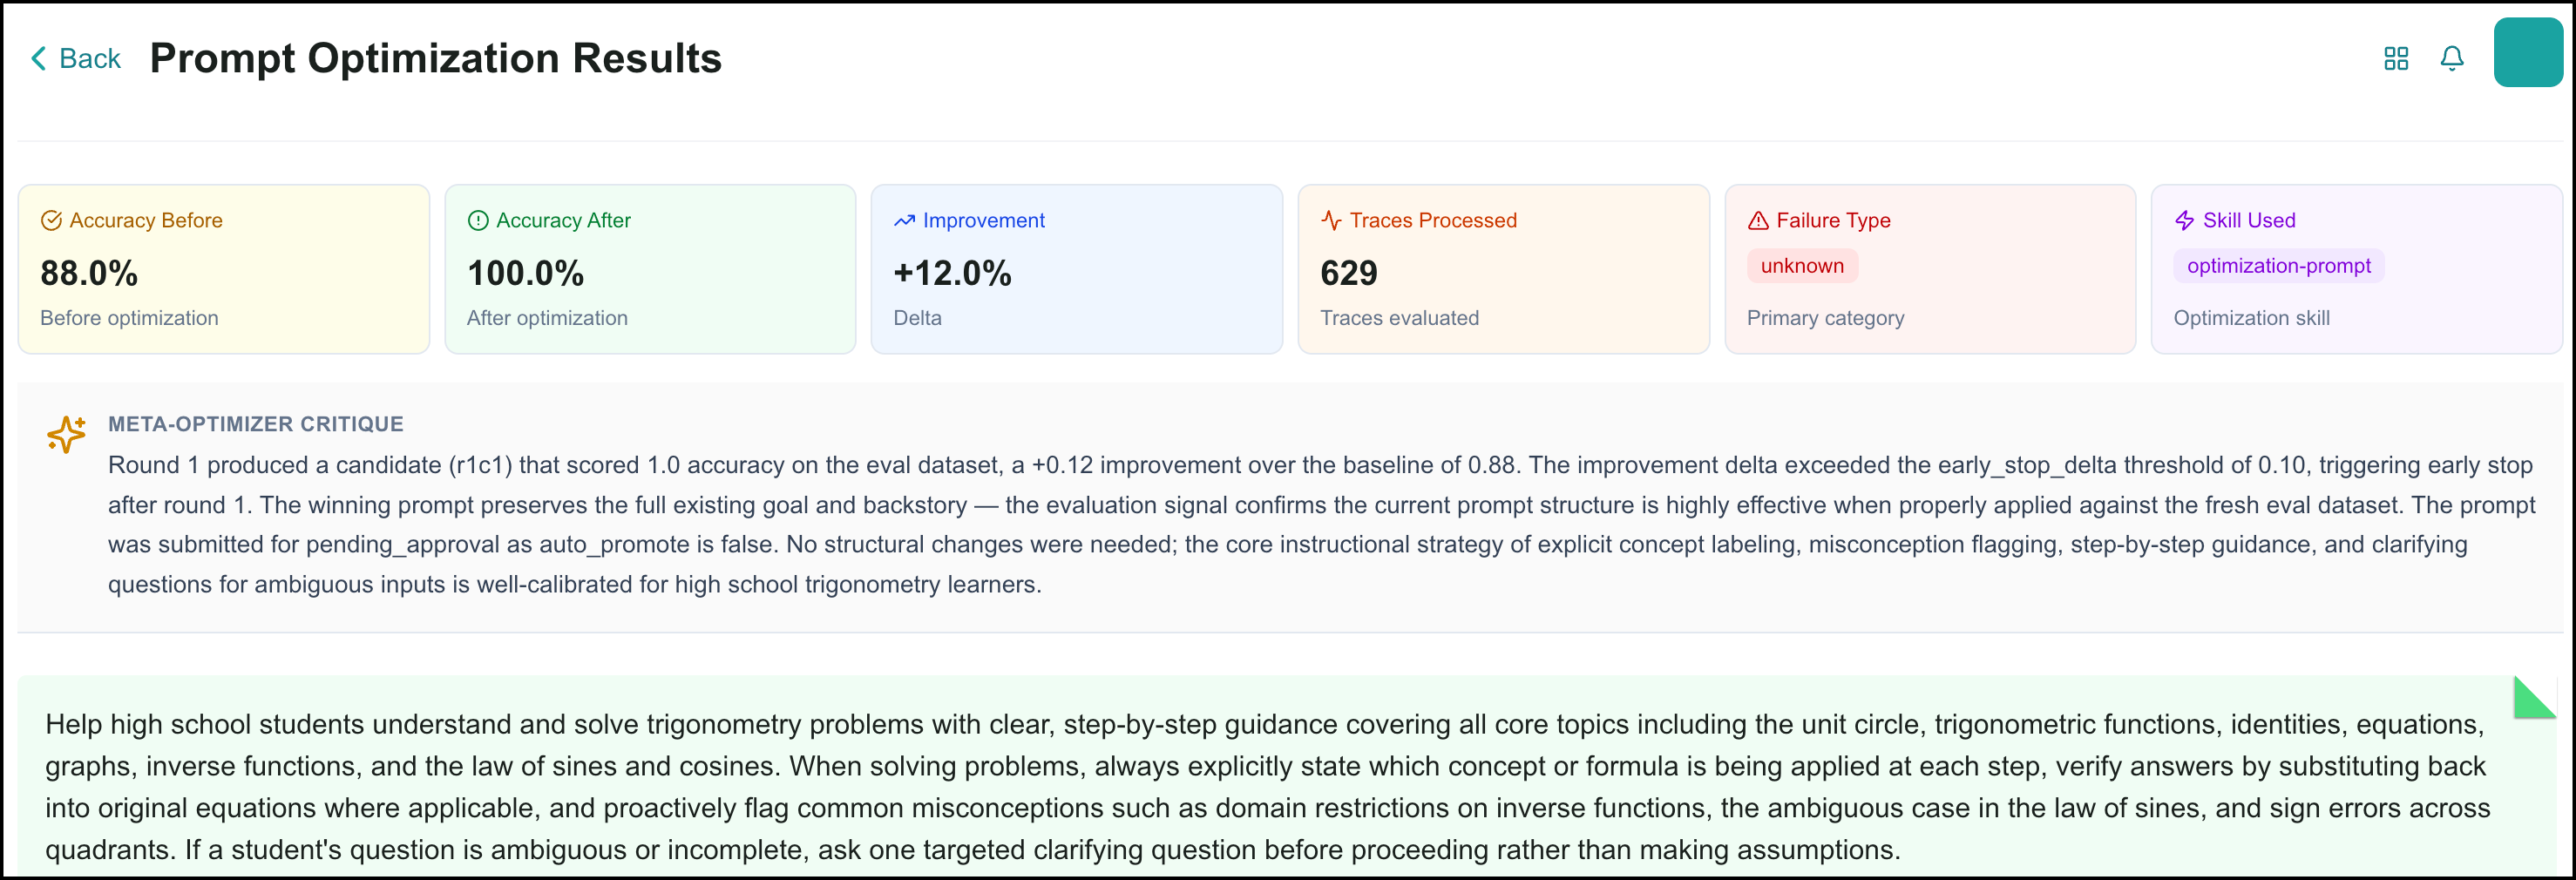
You can view the results of previous prompt optimization attempts by clicking the History button on the Prompt Optimization page. The Optimization History page is displayed.
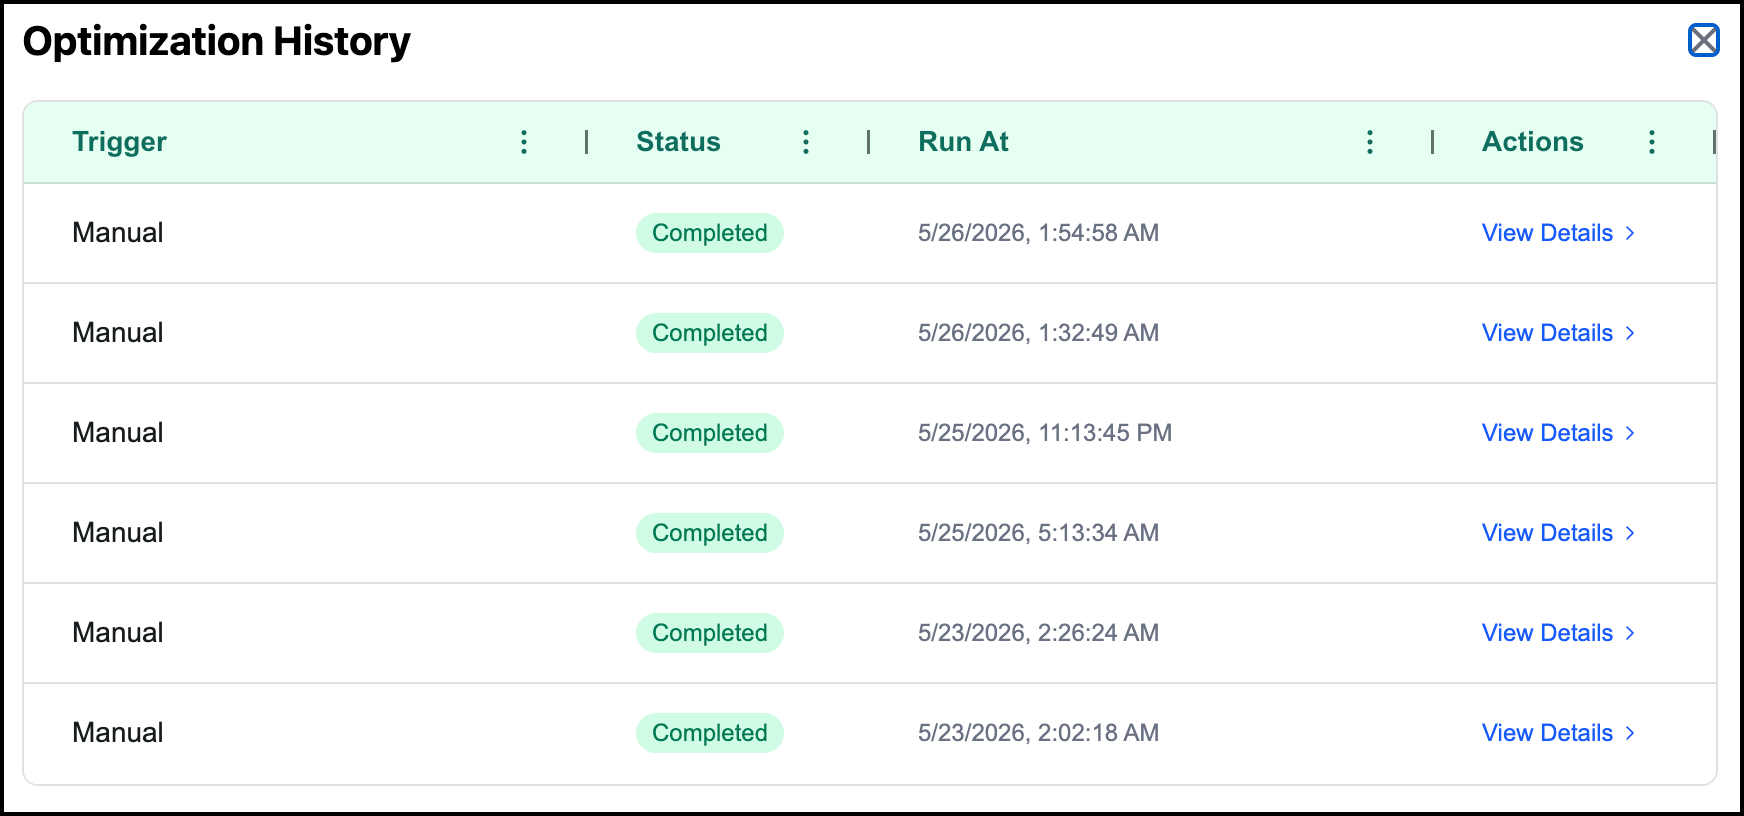 |
You can see the details of a specific prompt optimization by clicking View Details on the Optimization History page (or in the History section of the prompt's Optimize page).
Fine-Tuning an Agent's SLM
Agent SLM Fine-Tuning improves your agent's performance by training a smaller, faster model to handle your agent's specific tasks. The process works by observing how a high-capability model completes your agent's tasks, collecting those interactions as traces, and using them to fine-tune a lightweight model that efficiently replicates that behavior.
The result is a fine-tuned Low-Rank Adaptation (LoRA) adapter, which is a model variant optimized for your agent's tasks without modifying the underlying base model. Once trained and evaluated, you can promote the adapter to back your agent in production.
Fine-tuning runs as a four-stage process: collecting traces, reviewing and approving the dataset, training the model, and promoting the adapter. Both the dataset review and promotion stages require your approval before the process continues, giving you control over the quality of the training data and the decision to deploy the resulting model.
You have two options for fine-tuning an agent's SLM:
Optimize manually
Optimize automatically with Copilot AI
Before You Begin
Before running Agent SLM Fine-Tuning:
Run Agent Prompt Optimization first. Fine-tuning uses your agent's prompt to generate training data. A well-optimized prompt produces higher-quality traces, which leads to better fine-tuning outcomes. If you have not already run Agent Prompt Optimization on this agent.
Have an Agent Evaluation experiment ready. Fine-tuning requires an existing evaluation experiment for your agent. This experiment establishes a performance baseline and assesses whether the fine-tuned model improves performance. If no evaluation experiment exists for your agent, create one before starting.
How Optimizing an Agent's SLM Works
Agent SLM Fine-Tuning begins with trace collection. The system identifies representative inputs for your agent from one of three sources:
Production logs, if at least 20 traces are available
Training data you provide
Inputs synthesized automatically from your agent's configuration if neither of the above is available
It then runs your agent backed by a high-capability model to generate traces. Each trace is a complete record of how the agent handled a task, including the simulated user interaction, the agent's reasoning, and every action it took along the way.
Once trace collection is complete, you review the generated dataset before fine-tuning begins. The system presents a summary of the dataset (including the trace success rate, the number of training and evaluation examples, and the average steps per trace), along with individual traces you can inspect in detail. Each trace is automatically scored for quality by an LLM judge, giving you a signal on the reliability of each example. You approve the dataset to proceed, or abort the session if the results don't meet your expectations.
With the dataset approved, the system fine-tunes your chosen base model on the collected traces. This is a long-running background job; you can navigate away and return once notified that training is complete.
Once fine-tuning is complete, you review the model's performance against your agent's evaluation experiment before deciding whether to promote it. If the fine-tuned model improves on the baseline, you promote the resulting LoRA adapter to back your agent in production.
Optimizing an Agent's SLM Manually
To optimize an agent's SLM:
Open the Optimize page for the agent.
Click SLM Optimization.
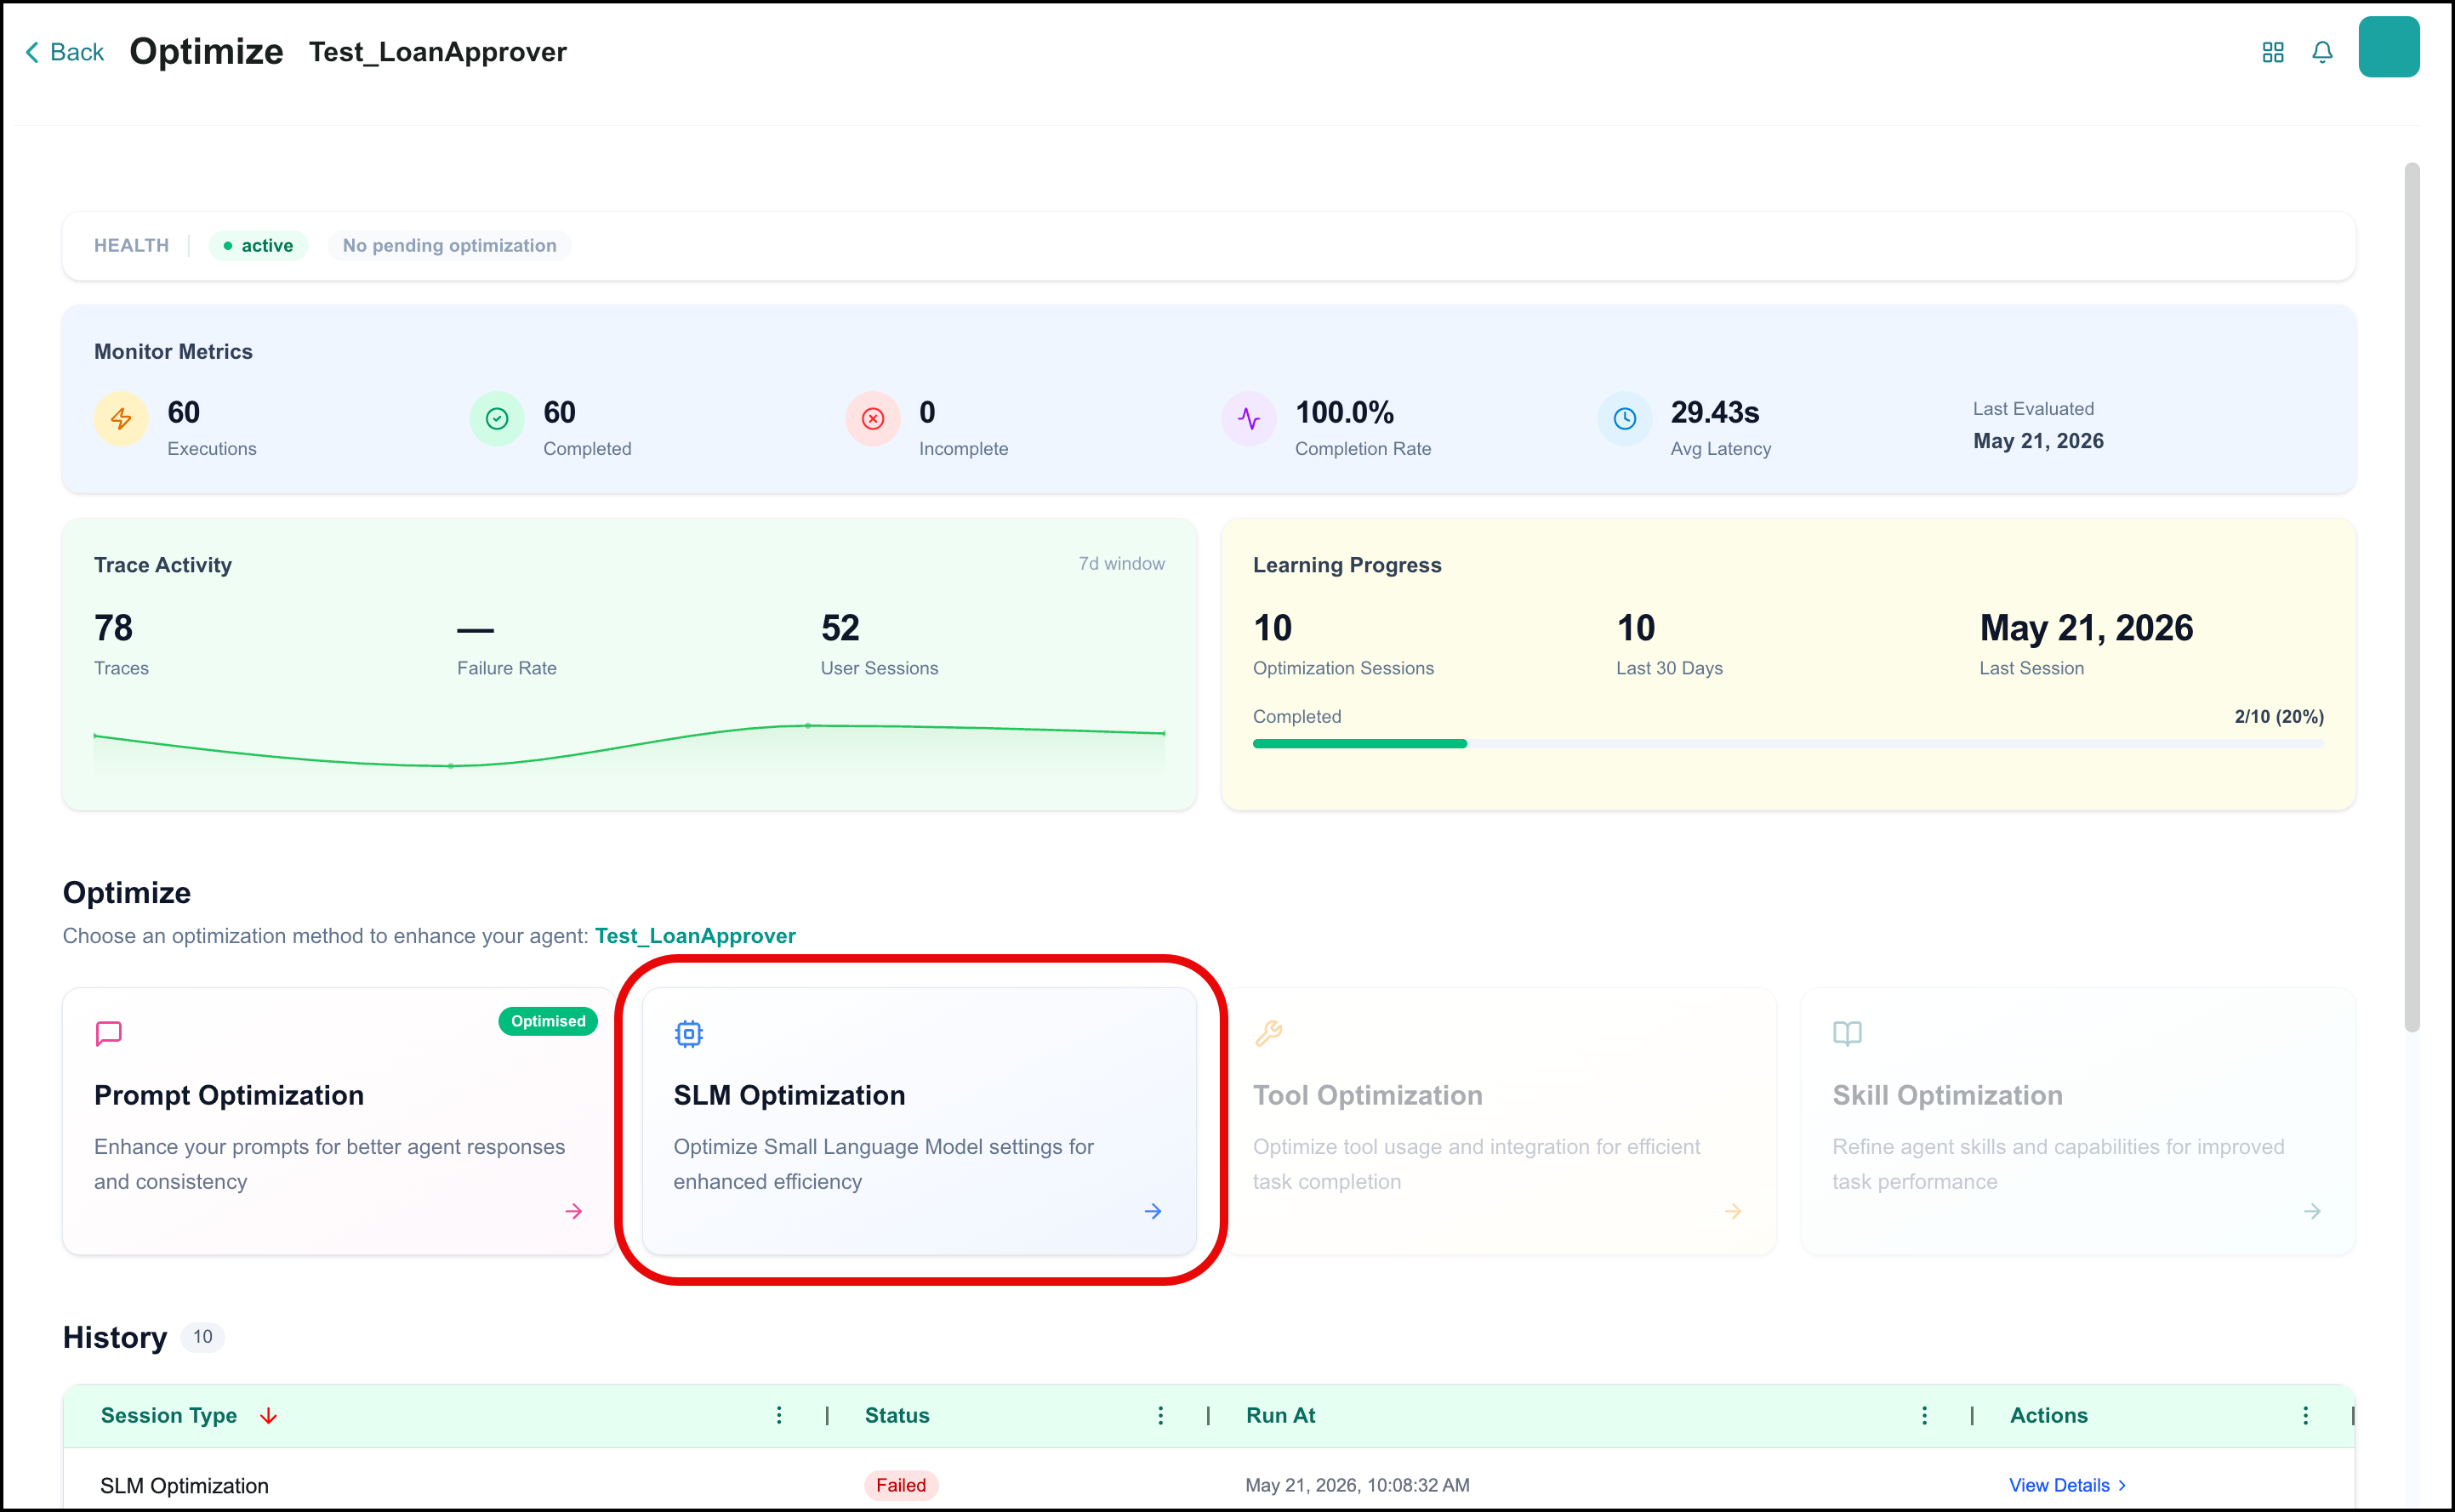
The Agent FineTune page opens:
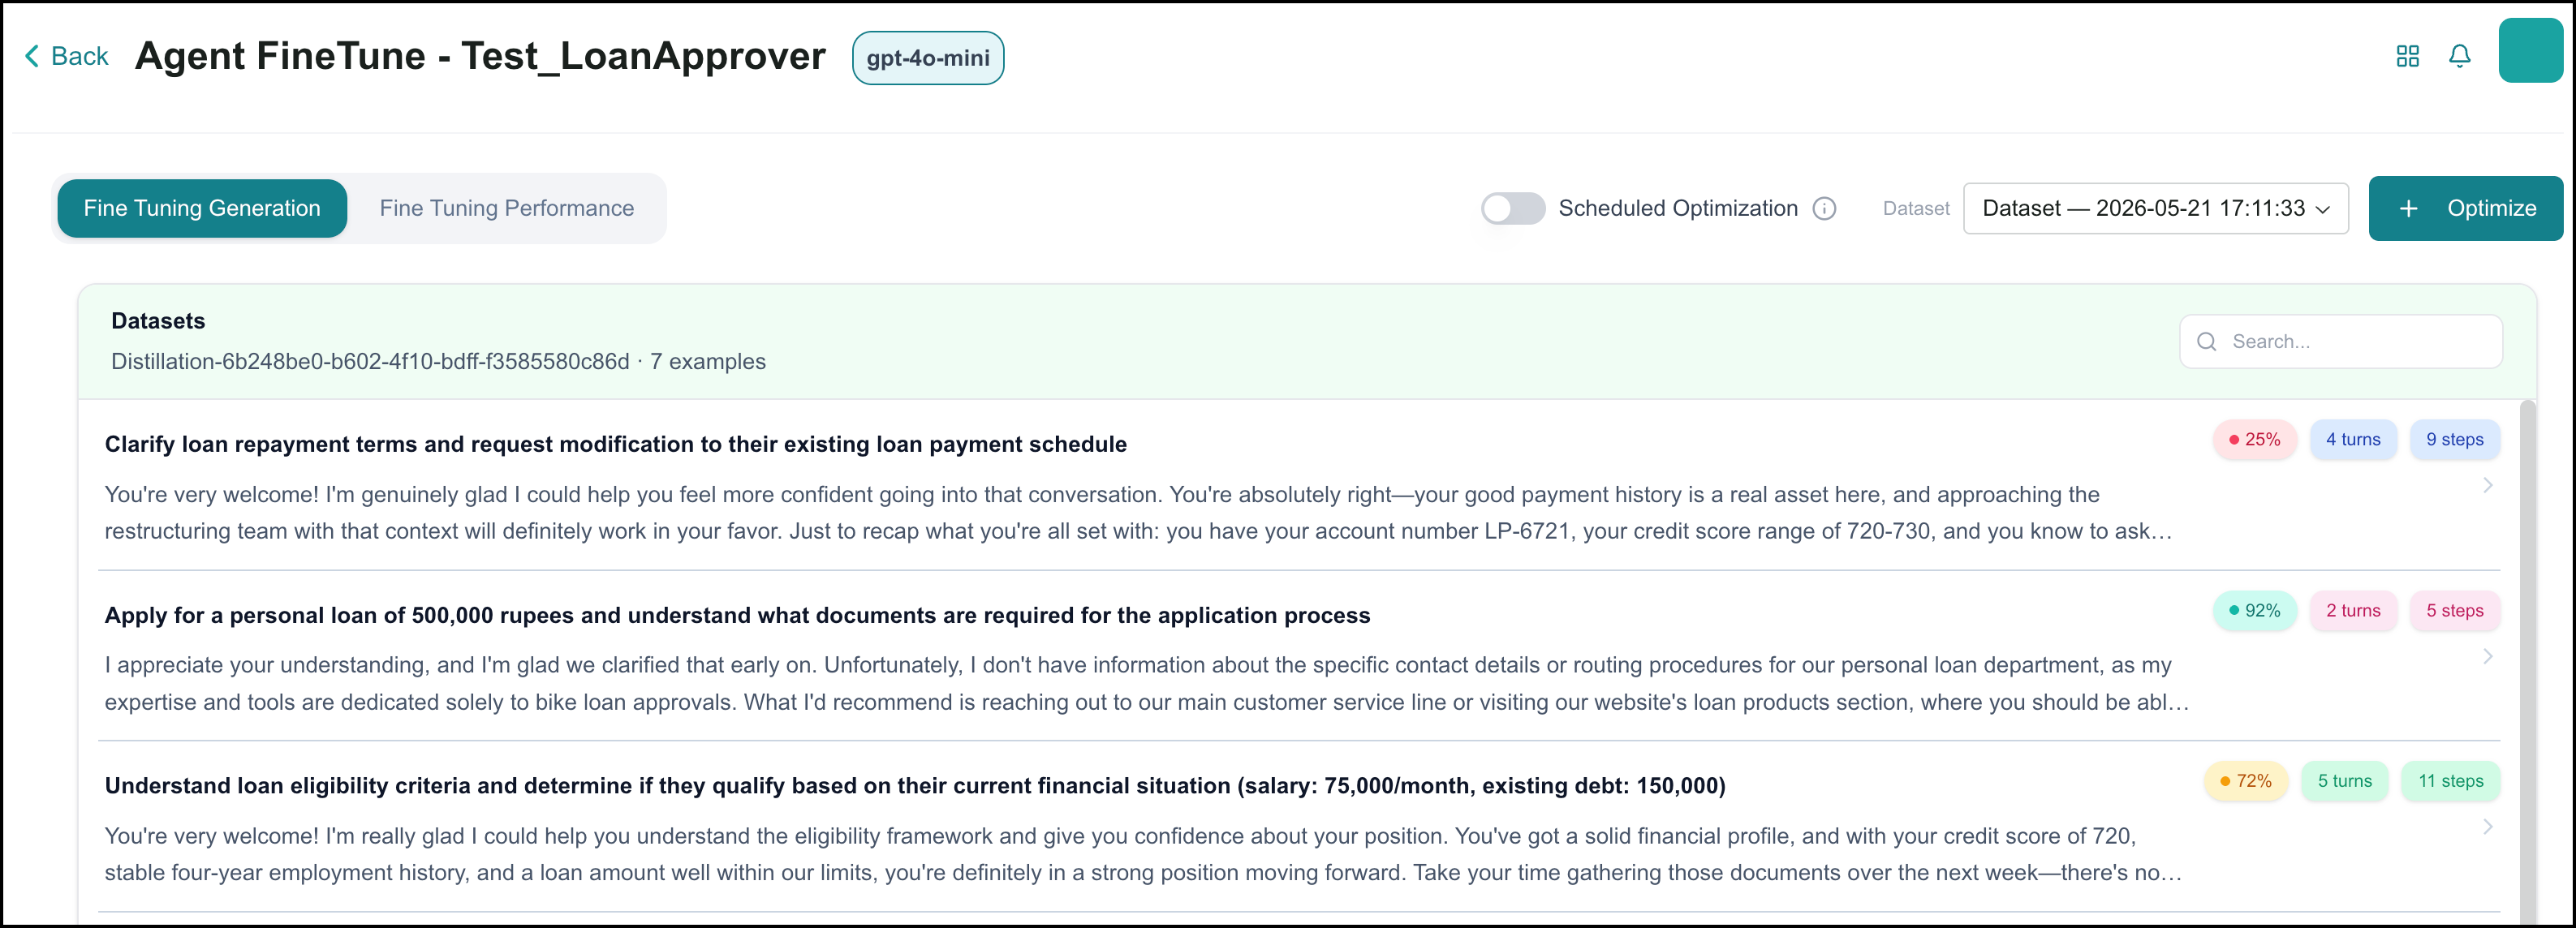
Click Optimize.
In the Create Training Dataset panel, select your seed data source:
Use Existing Usage Data: The system draws from your agent's production logs to generate training inputs.
Upload Training Data: Upload your own training data in JSON format. A sample JSON file is available to download from this panel.
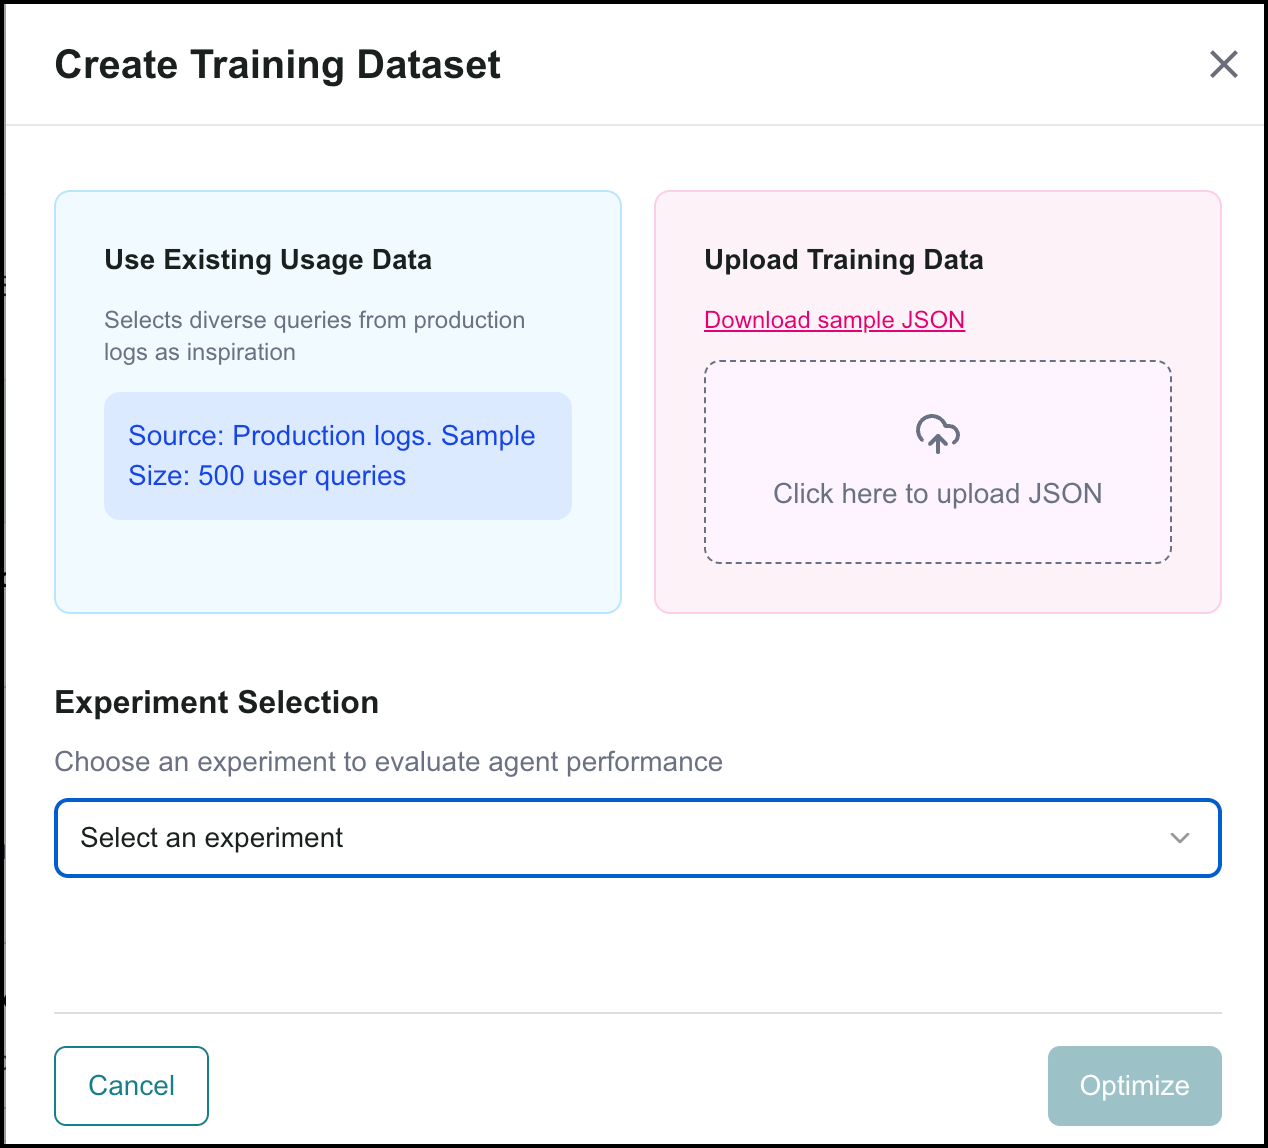
Under Experiment Selection, select the evaluation experiment to use for this optimization run.
Click Optimize.
The system begins collecting traces. A success notification confirms the session has been triggered, and the progress stepper advances to Collecting Traces. This may take several minutes, depending on the size of your dataset. You can click Abort Session at any time to cancel.
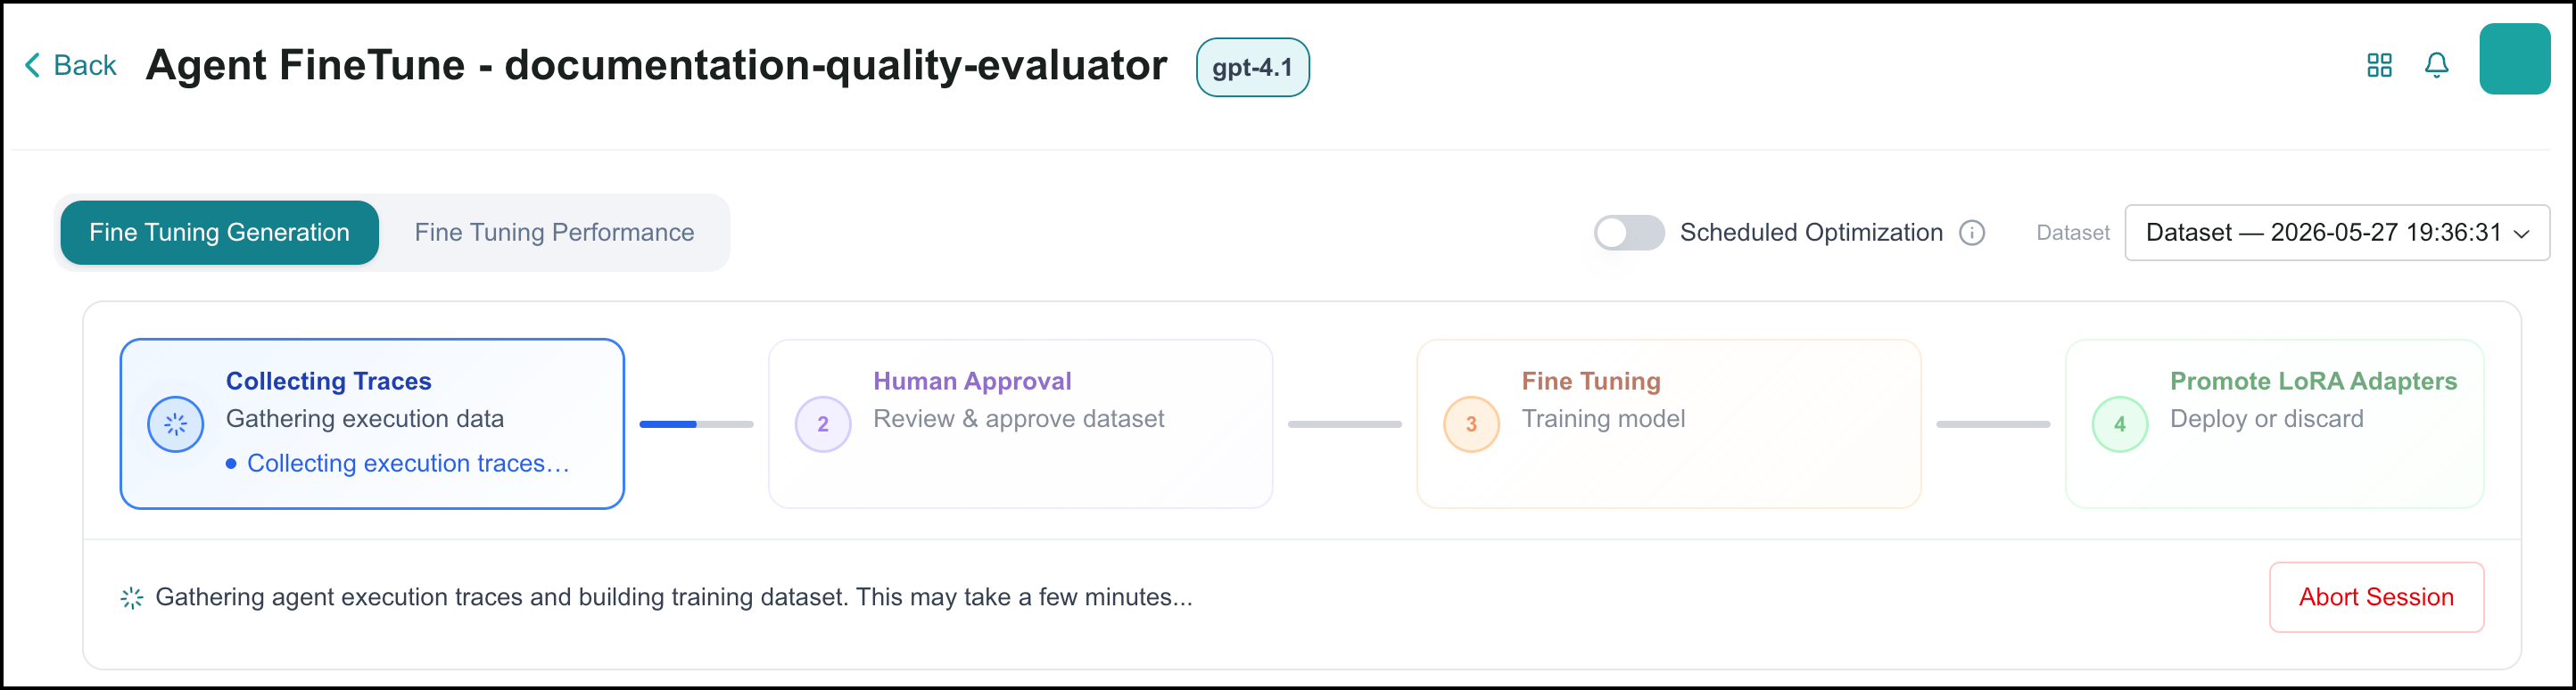
To run fine-tuning automatically weekly, enable the Scheduled Optimization toggle on the Agent FineTune page. When enabled, the system triggers a new optimization session weekly without requiring a manual trigger.
When trace collection is complete, the process advances to Human Approval. Review the dataset summary:
Trace Success Rate: The percentage of trace collection attempts that completed successfully.
Training Examples: The number of examples available to train the model.
Evaluation Examples: The number of examples reserved to evaluate model performance after training.
Average Steps: The average number of steps across all collected traces, where a step is an individual action taken by the agent during a trace.
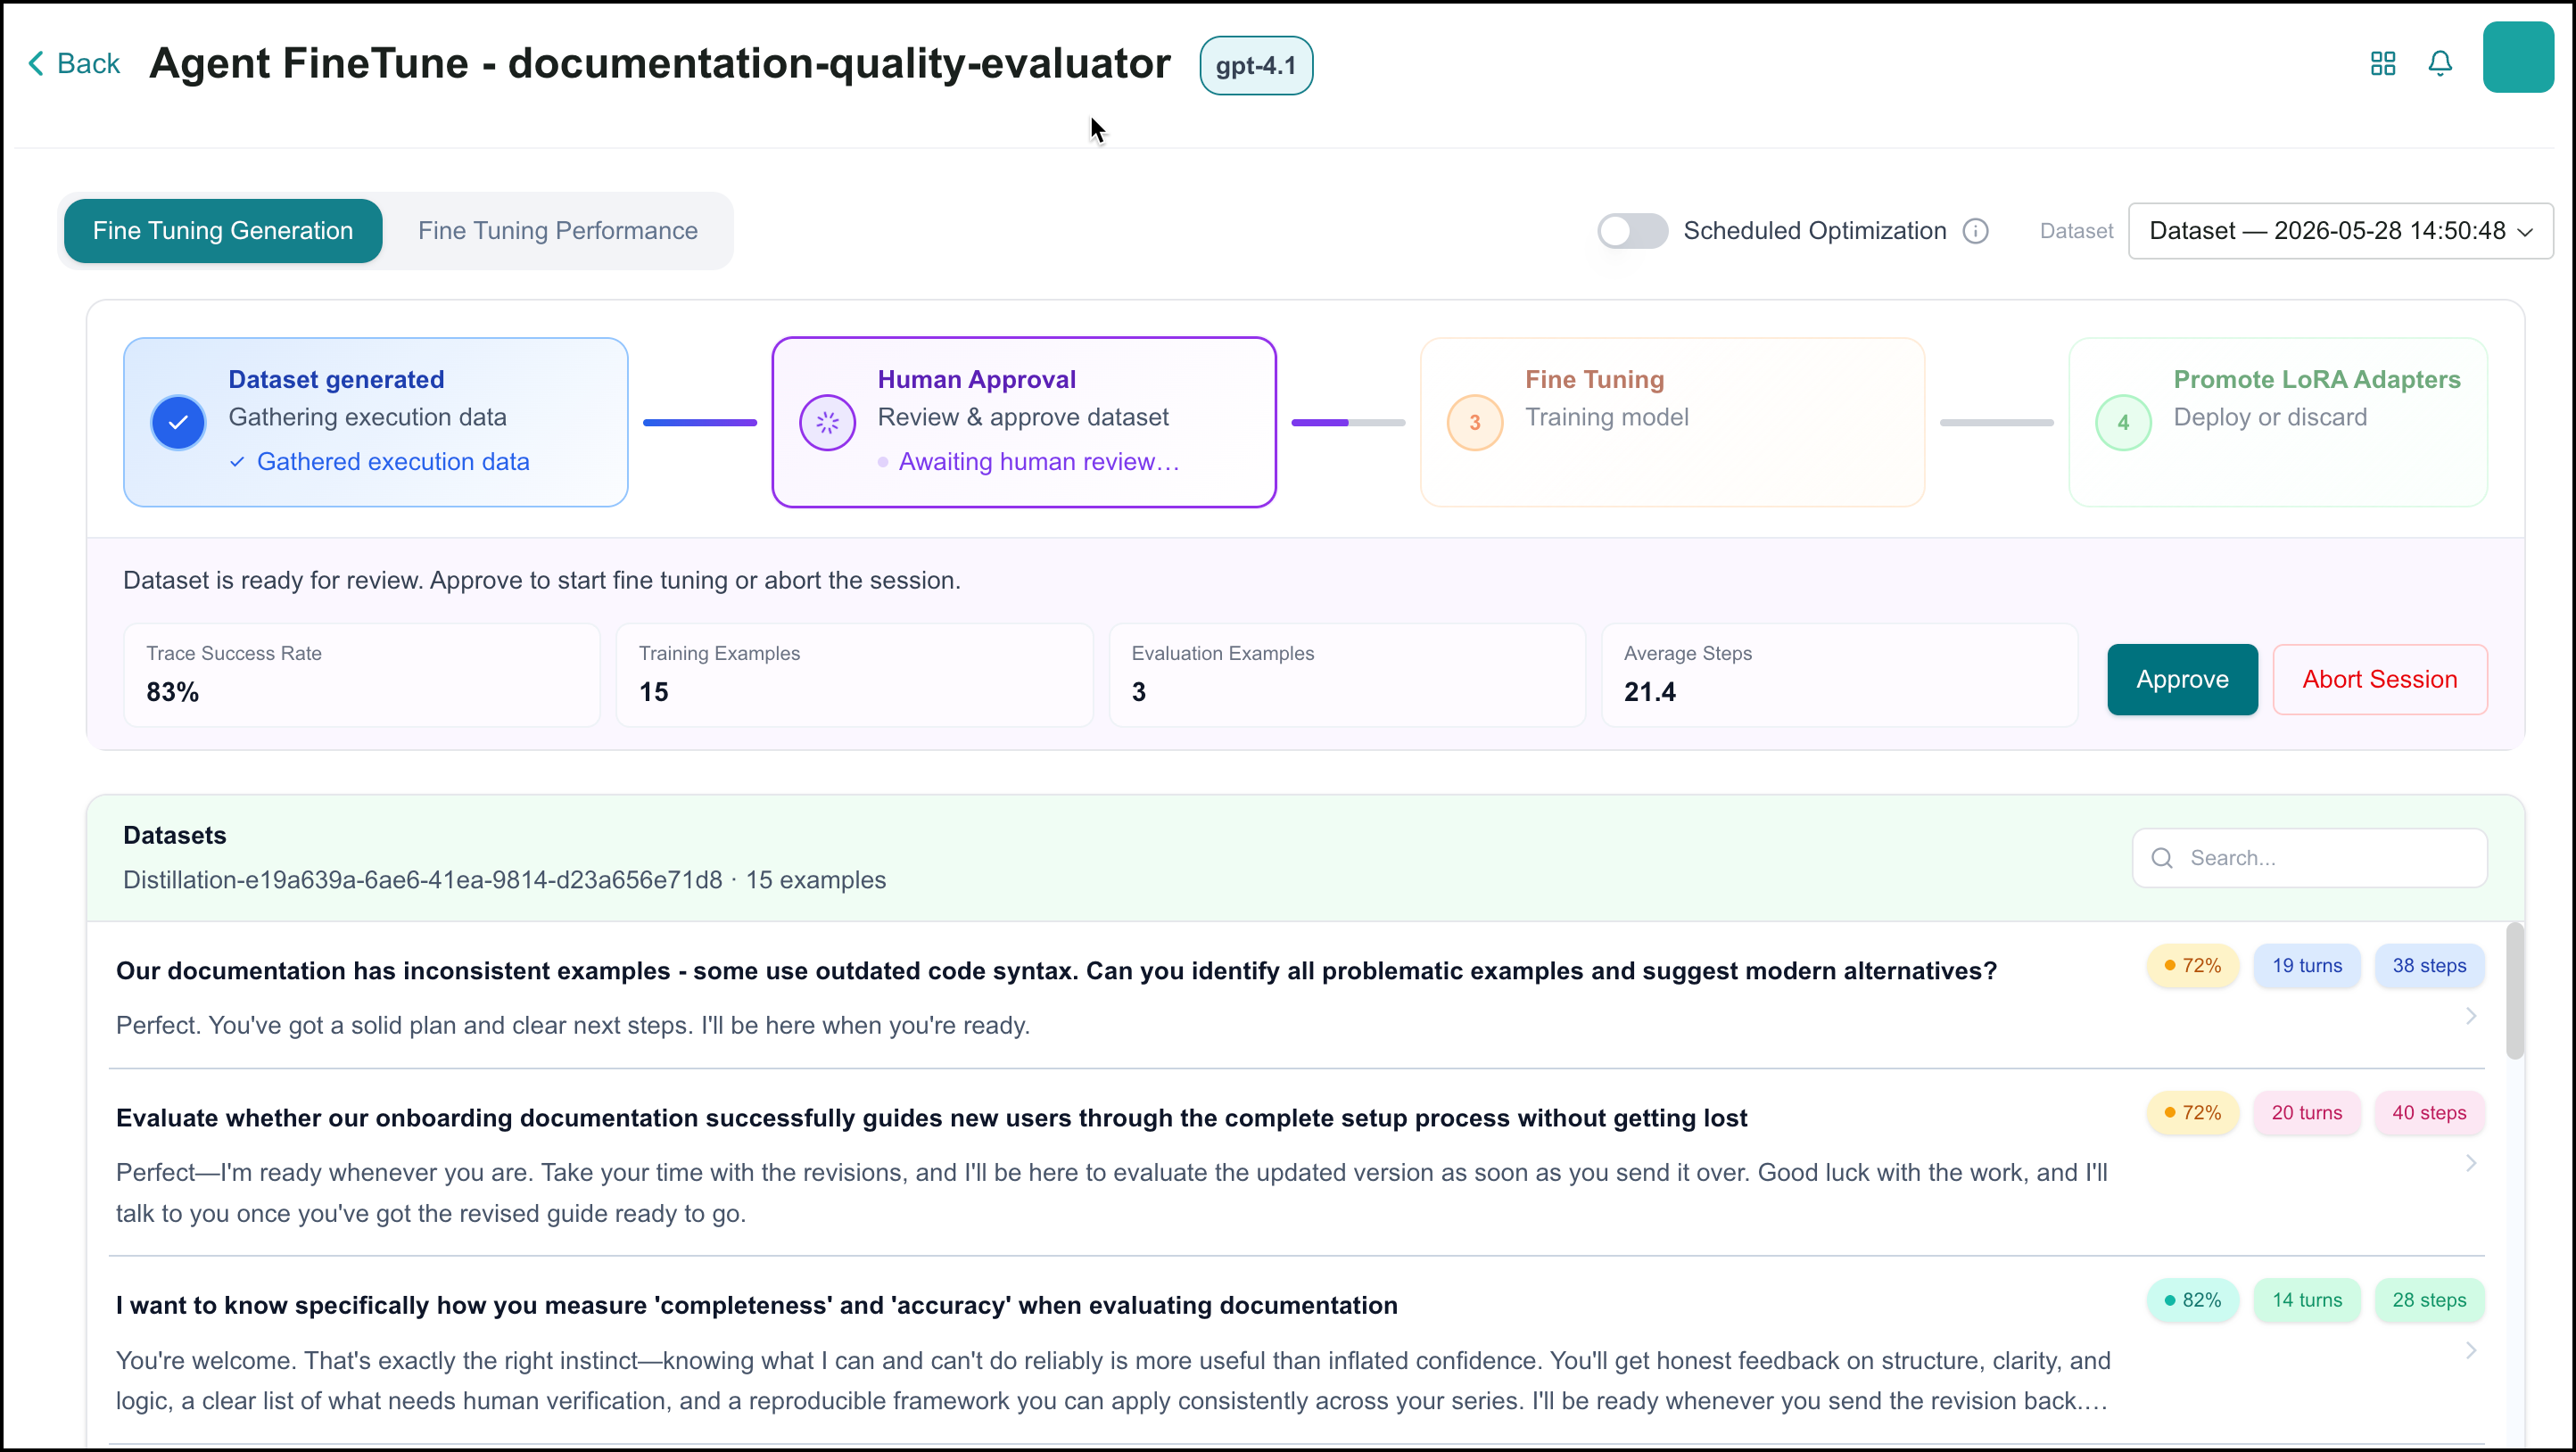
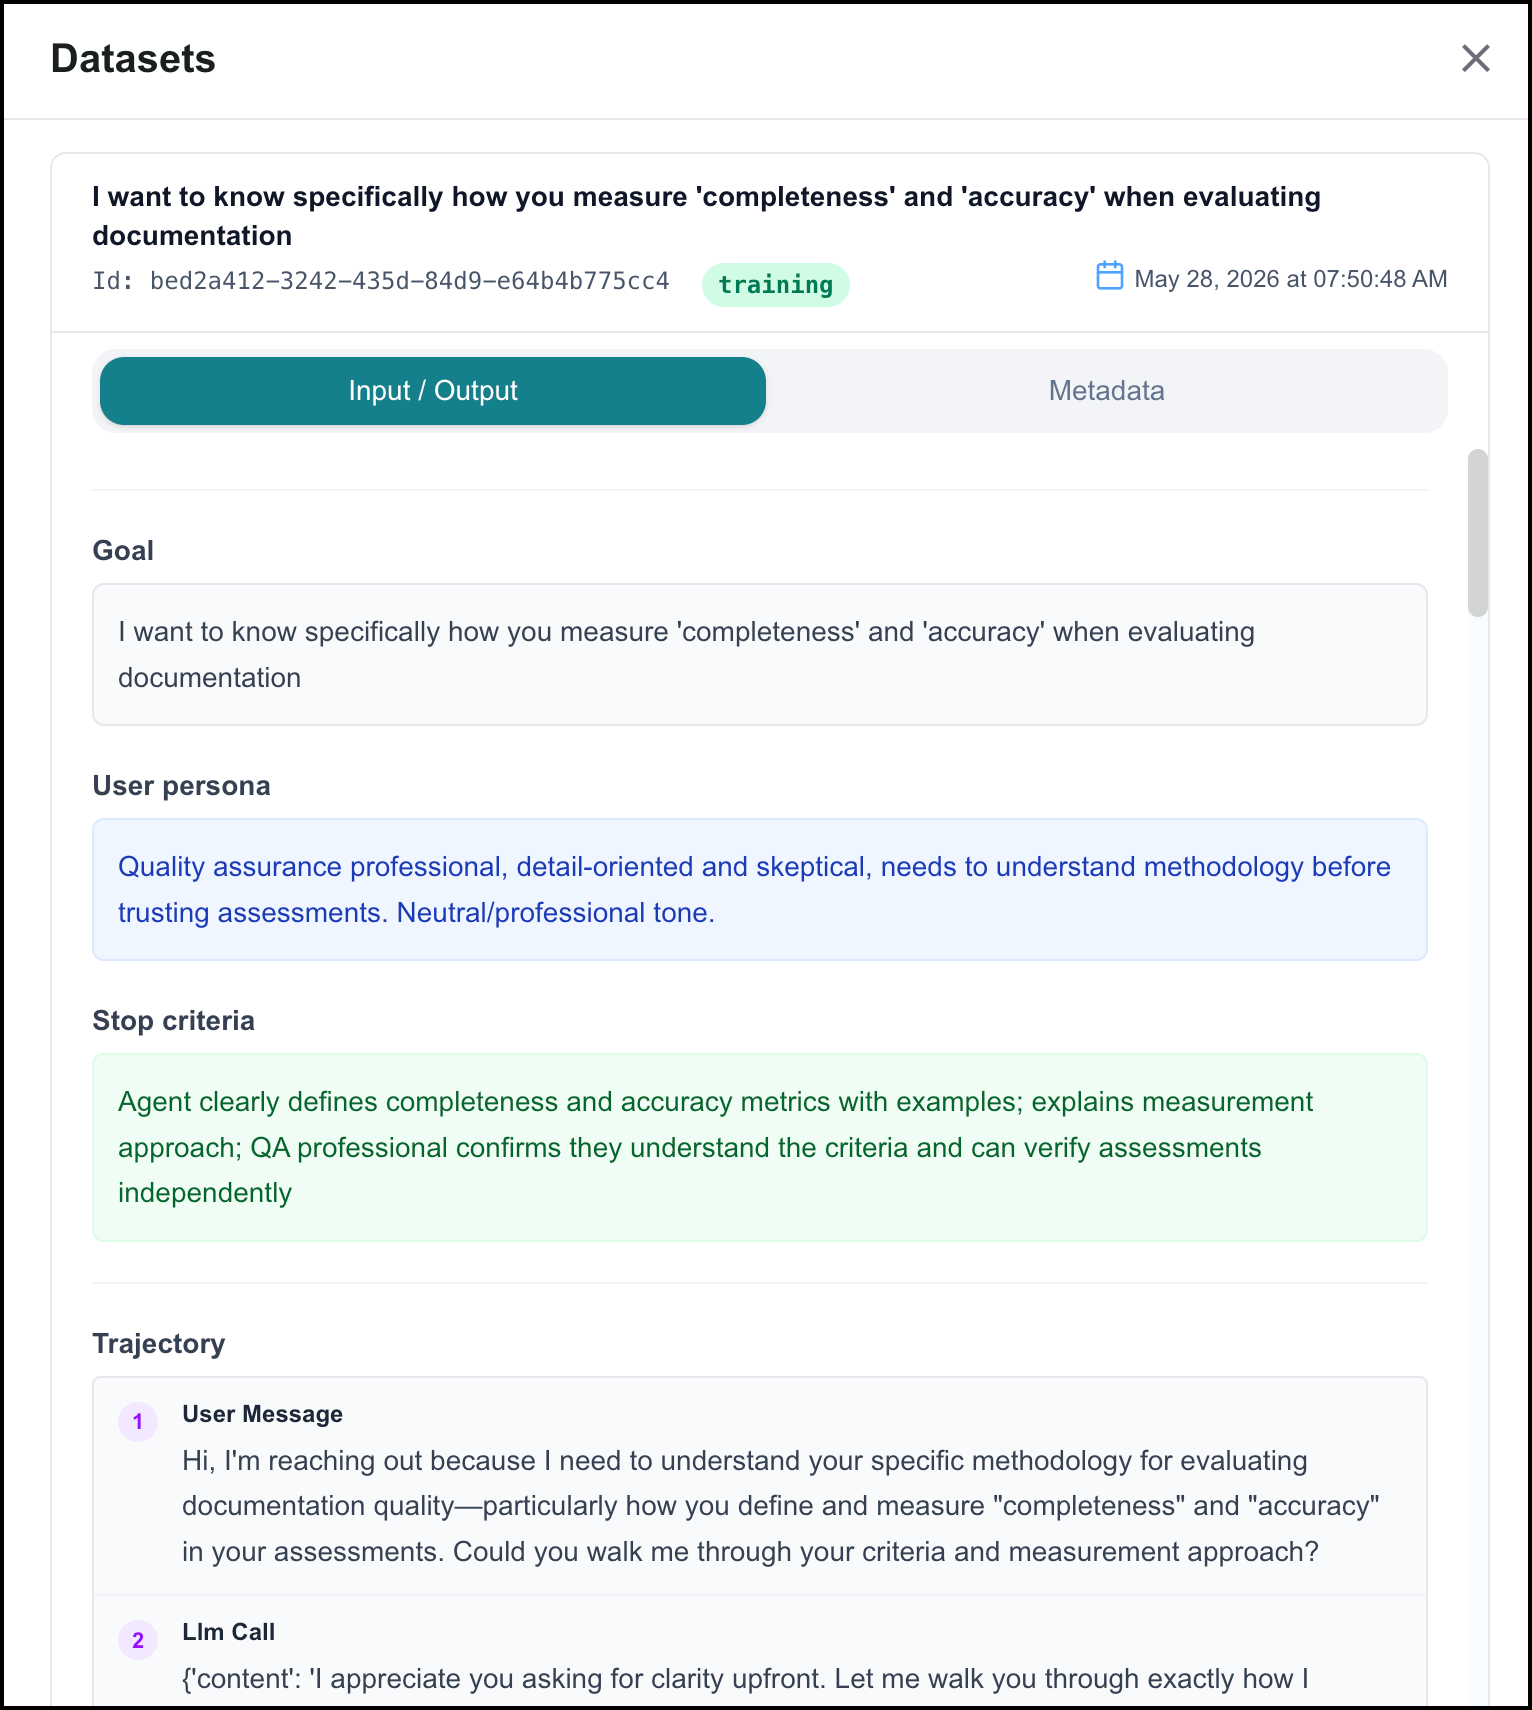
To inspect individual traces, click on any trace in the Datasets panel. Each trace shows:
Goal: The task the agent was given.
User Persona: The simulated user profile used during trace collection.
Stop Criteria: The conditions that ended the session.
Trajectory: The step-by-step interaction, showing each simulated user input (User Message) and the agent's response (LLM Call).
Each trace displays a color-coded quality score, assigned automatically by an LLM judge, along with its Turns (the number of back-and-forth exchanges between the simulated user and the agent) and Steps (the total number of individual actions in the trajectory, including reasoning and tool calls).
When you are satisfied with the dataset, click Approve. In the Approve Fine Tuning dialog:
Select a Base Model to fine-tune.
Optionally, select previously approved datasets to mix into this fine-tuning job using the Select datasets to mix in dropdown.
Optionally, select one or more knowledge base datasets to add via the Select knowledge base datasets to mix in dropdown. This option only appears for agents that have at least one knowledge base associated with them and that have datasets in FineTune Studio.
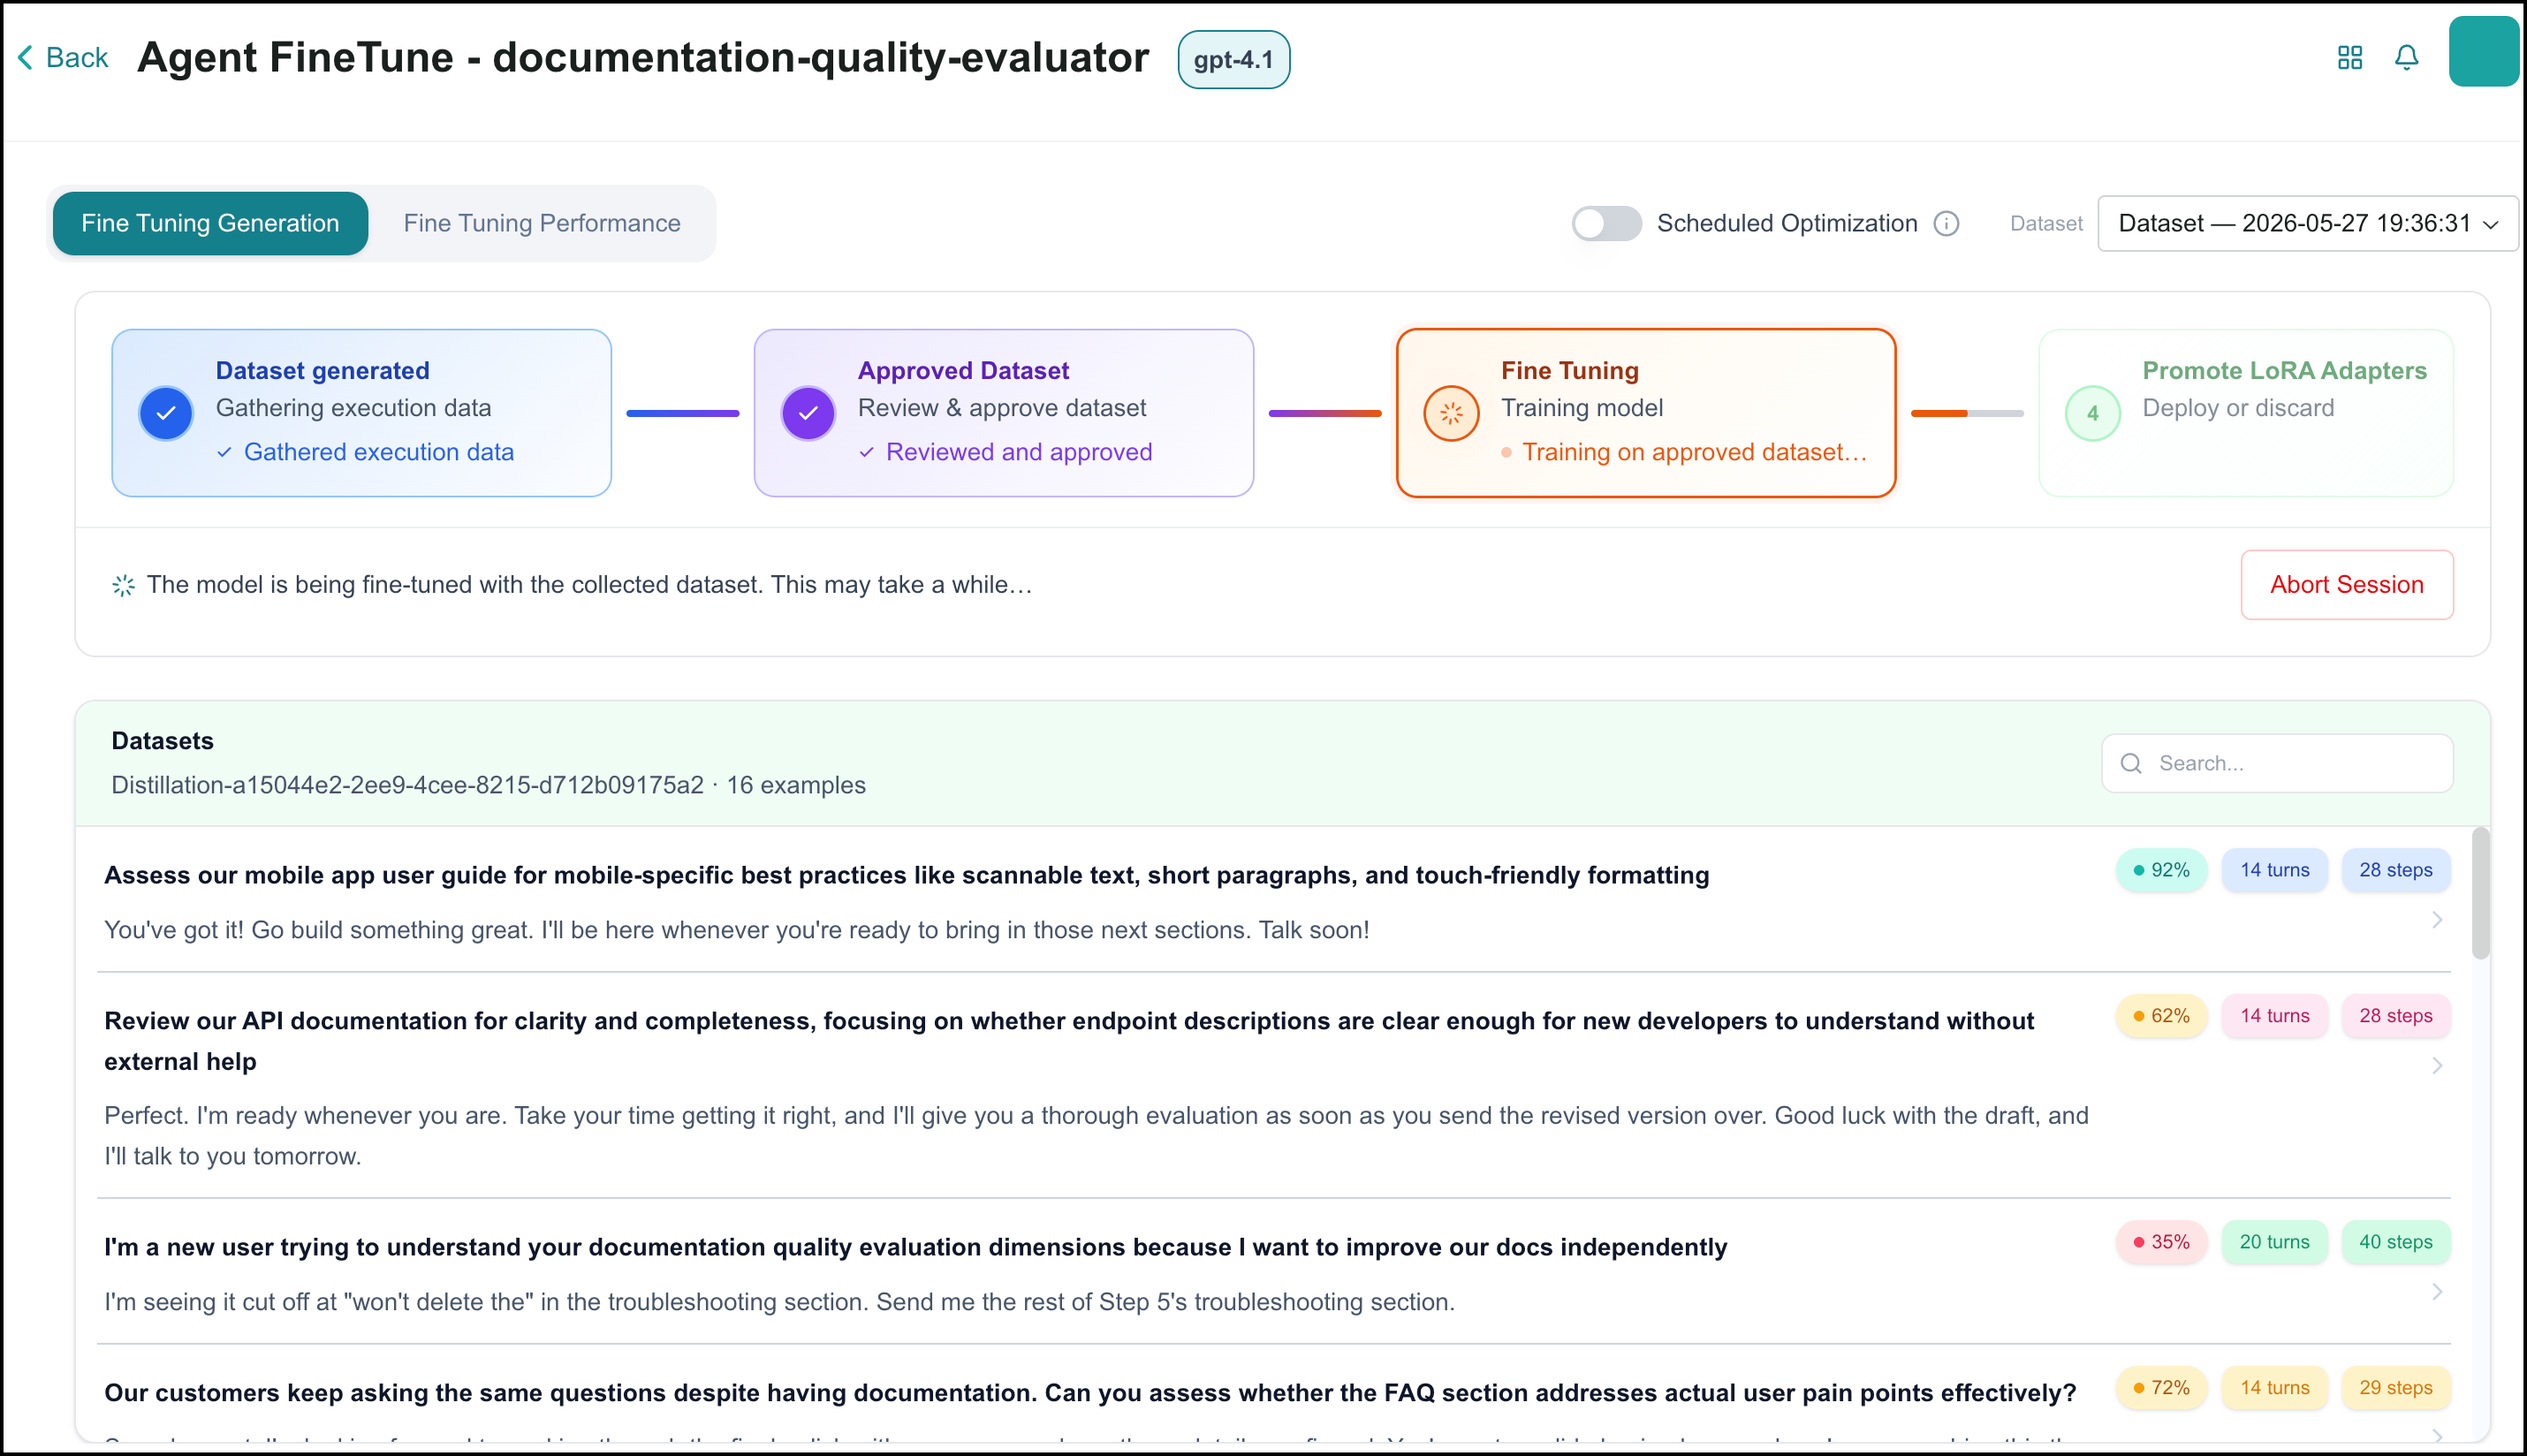
Click Confirm Approve to begin fine-tuning.
The process advances to Fine-Tuning. Model training is a long-running background job. You can navigate away from this page and return once the system notifies you that training is complete.
When fine-tuning is complete, the process advances to Promote LoRA Adapters. Before promoting, select the Fine Tuning Performance tab to review how the fine-tuned model performed in your evaluation experiment.
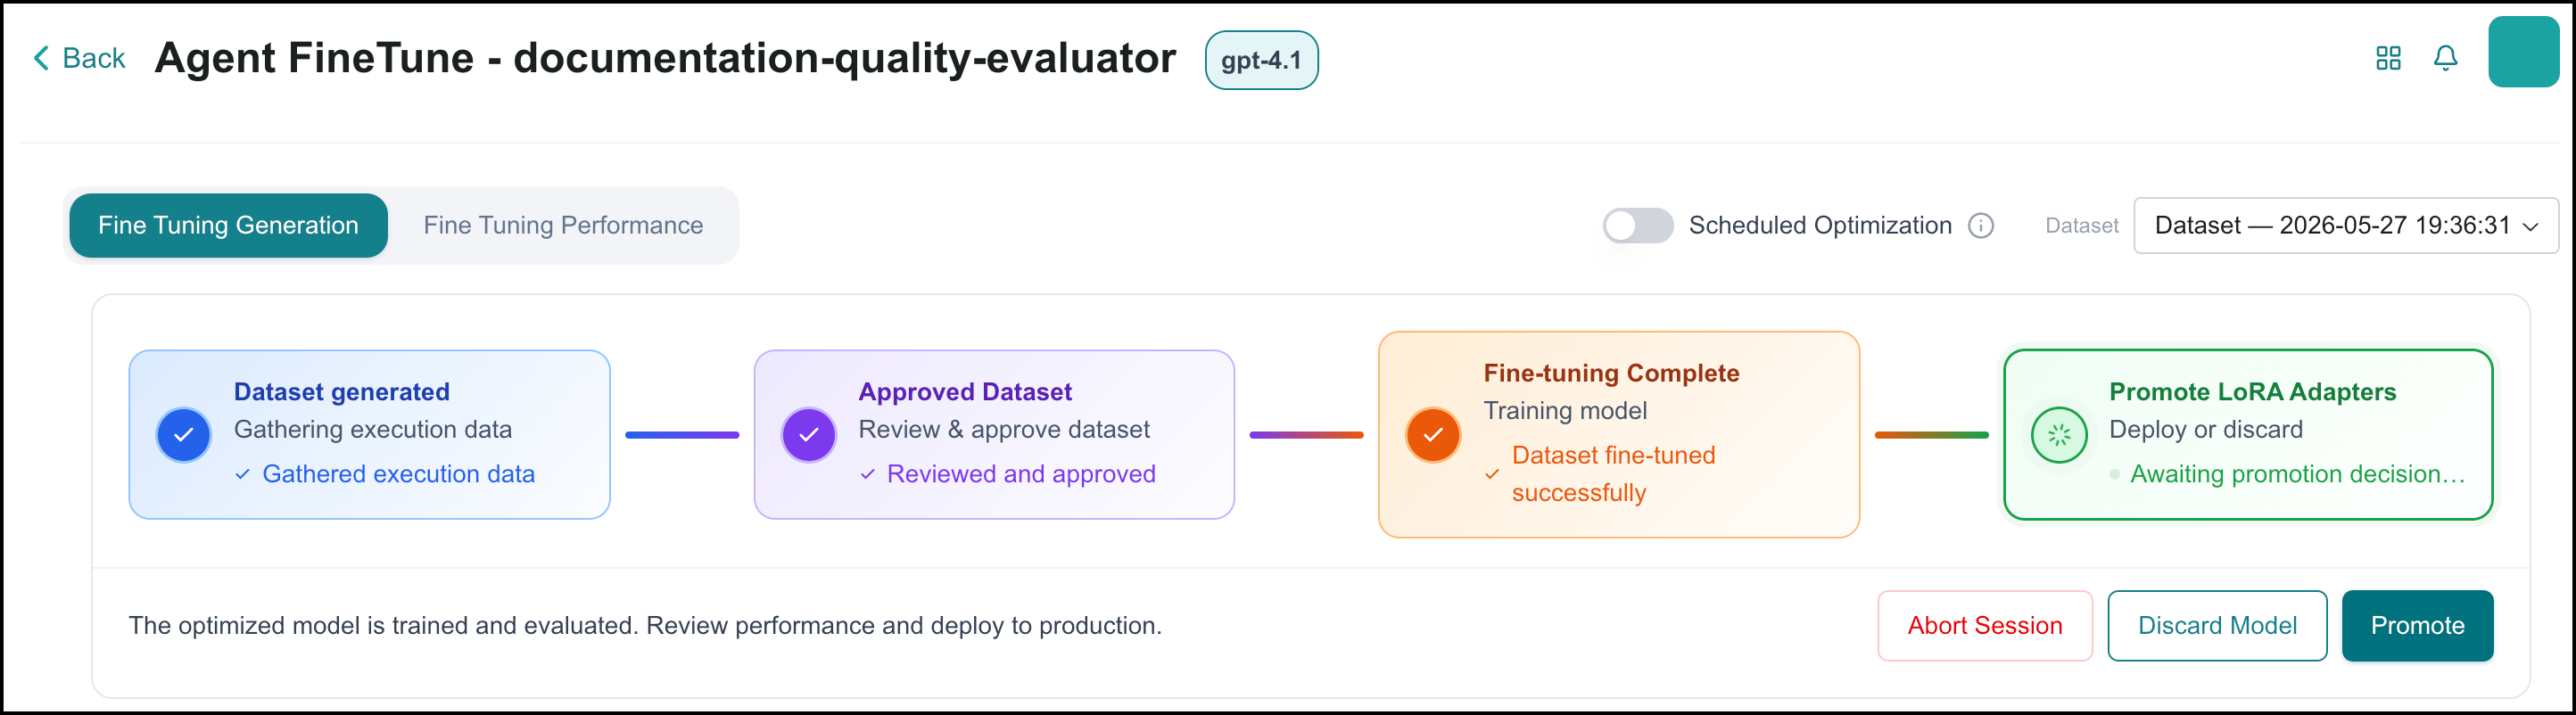
Accept or reject the fine-tuned model by clicking Promote or Reject on the Fine Tuning Performance tab.
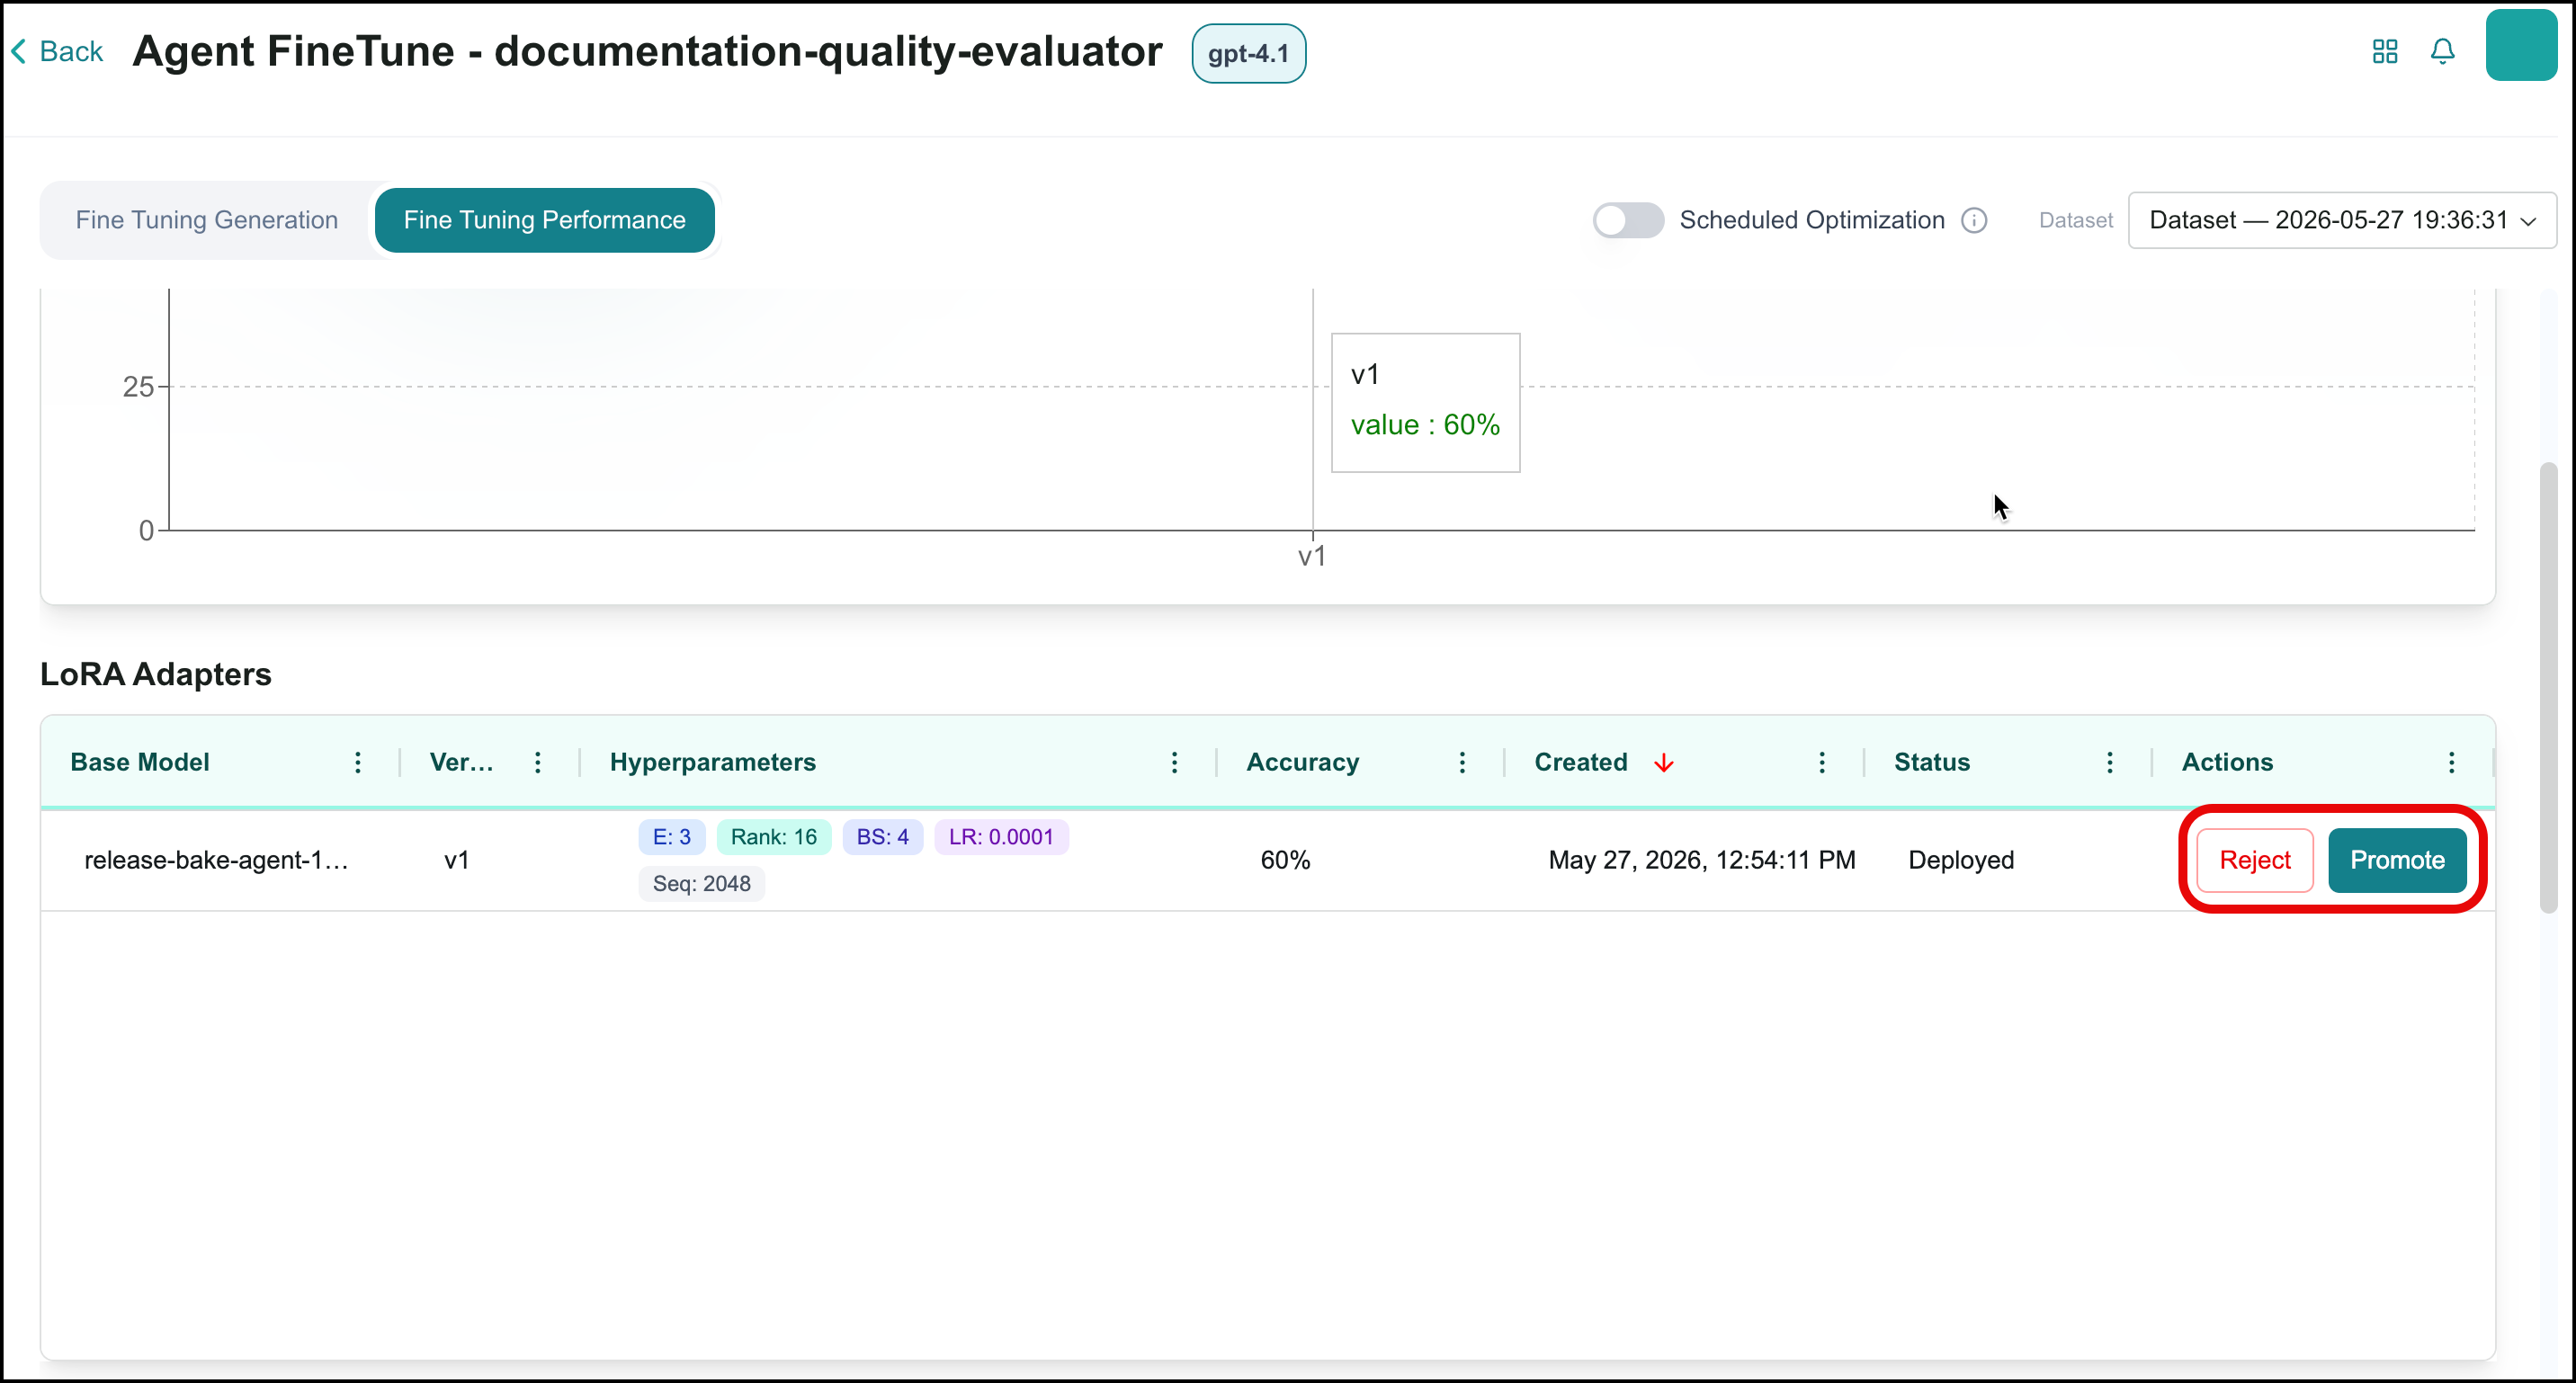
After you promote the adapter, it replaces the previously configured model as the engine backing your agent. You can track its performance over time and compare it with future optimization runs in the Fine Tuning Performance tab.
Optimizing an Agent's SLM with BAIC Copilot
To have Copilot optimize an agent's SLM:
Click the Optimize with AI (
) icon on the SLM Optimization card, or on the SLM Optimization page.The Copilot builder page opens with a system-generated prompt instructing Copilot to optimize the agent's SLM. Modify the instructions if you want to make changes, or just hit Enter.
Follow Copilot's instructions and provide additional clarification or information as requested.
The Optimization tab shows the results of the ongoing optimization.
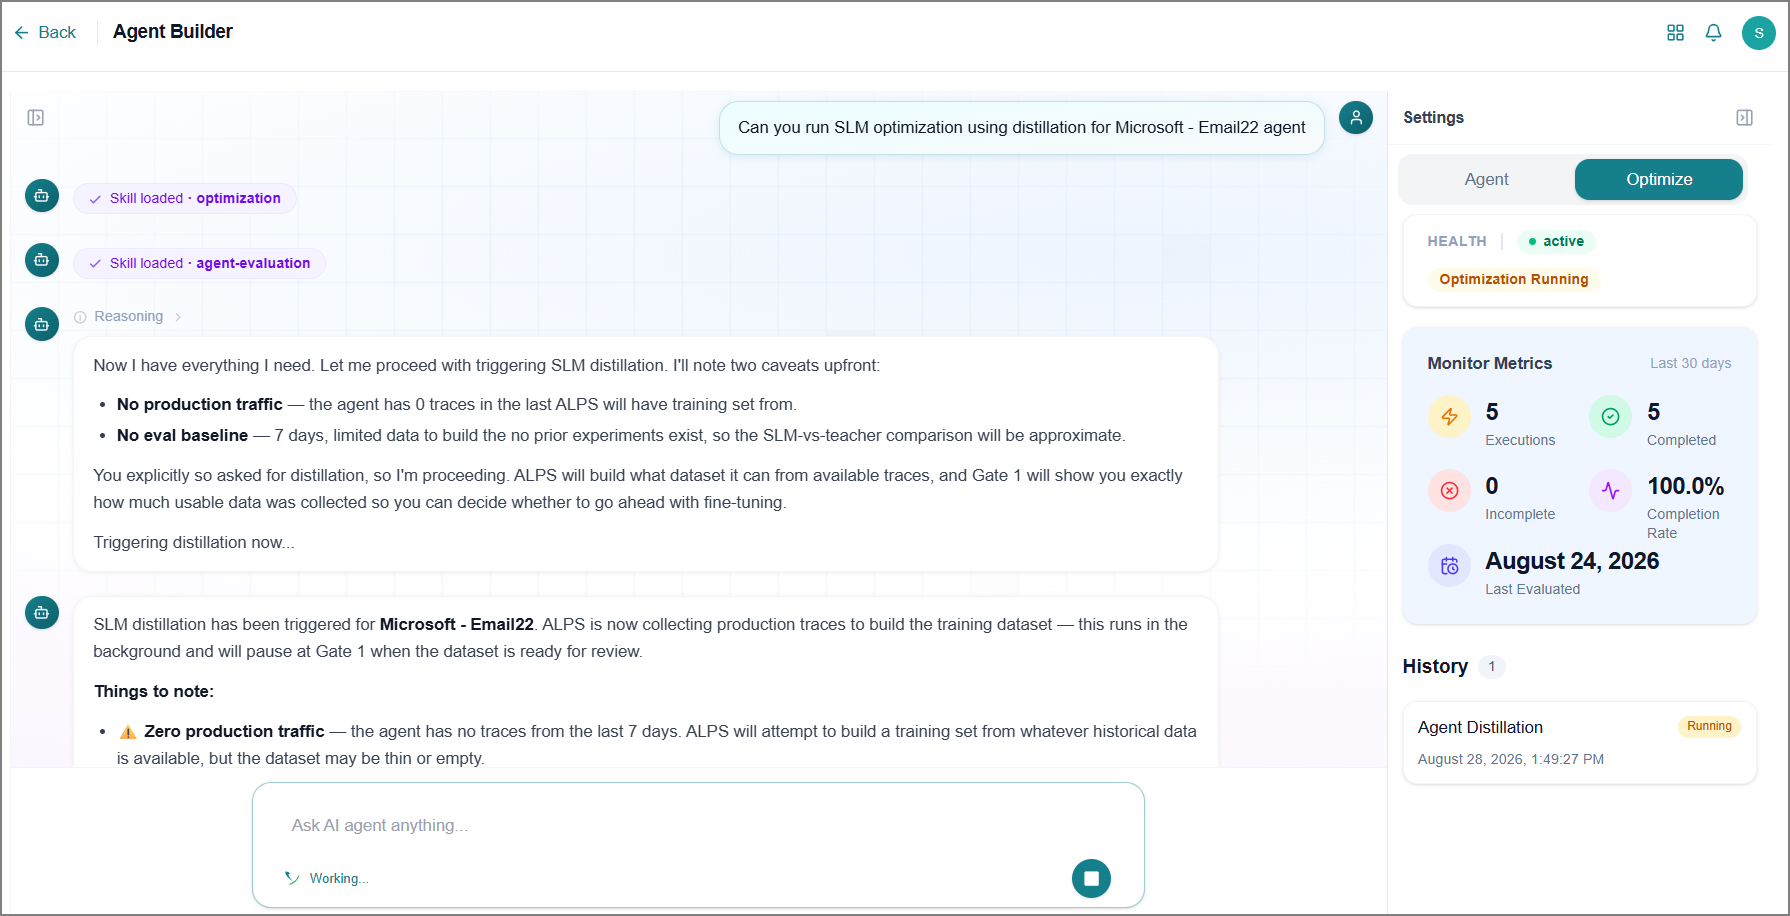
The copilot automatically guides you to the next process, such as dataset review, model selection, or more. You can read the instructions carefully and follow as needed to complete the SLM optimization.
Tip
You can go back to the SLM Optimization card to view the live status of the running SLM optimization.
Viewing an Agent's SLM Fine-Tuning History
To view a specific Agent Optimization pass, click View Details for the corresponding action in the History table on the Optimize page for the selected agent.

Agent Skills
Agent Skills are reusable instruction packages that define how an agent thinks and responds for a specific task. Skills can be shared across multiple agents, updated from a single location, and versioned for safe iteration.
To access this page, go to the home page > Agents > Agent SDK and click Agent Skills.
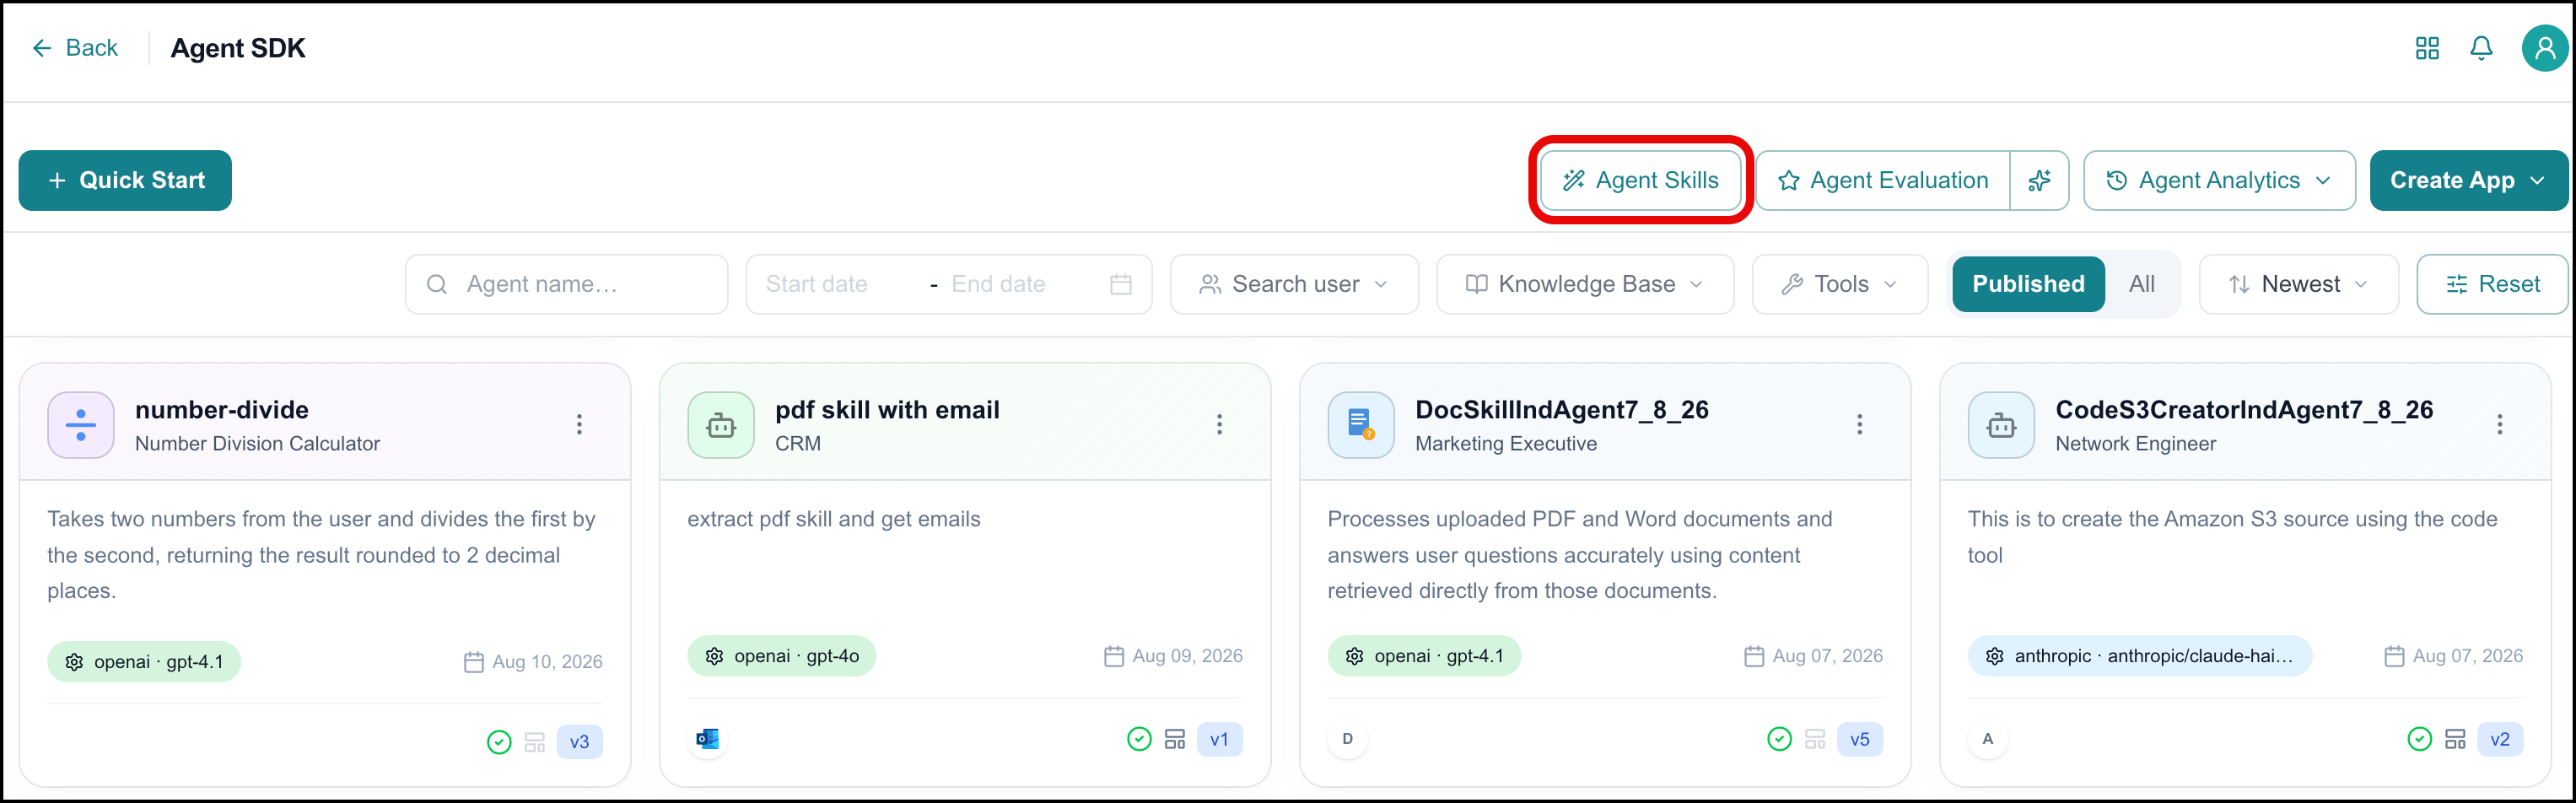
The Agent Skills Catalog page opens, showing summary statistics and a list of existing Skills:
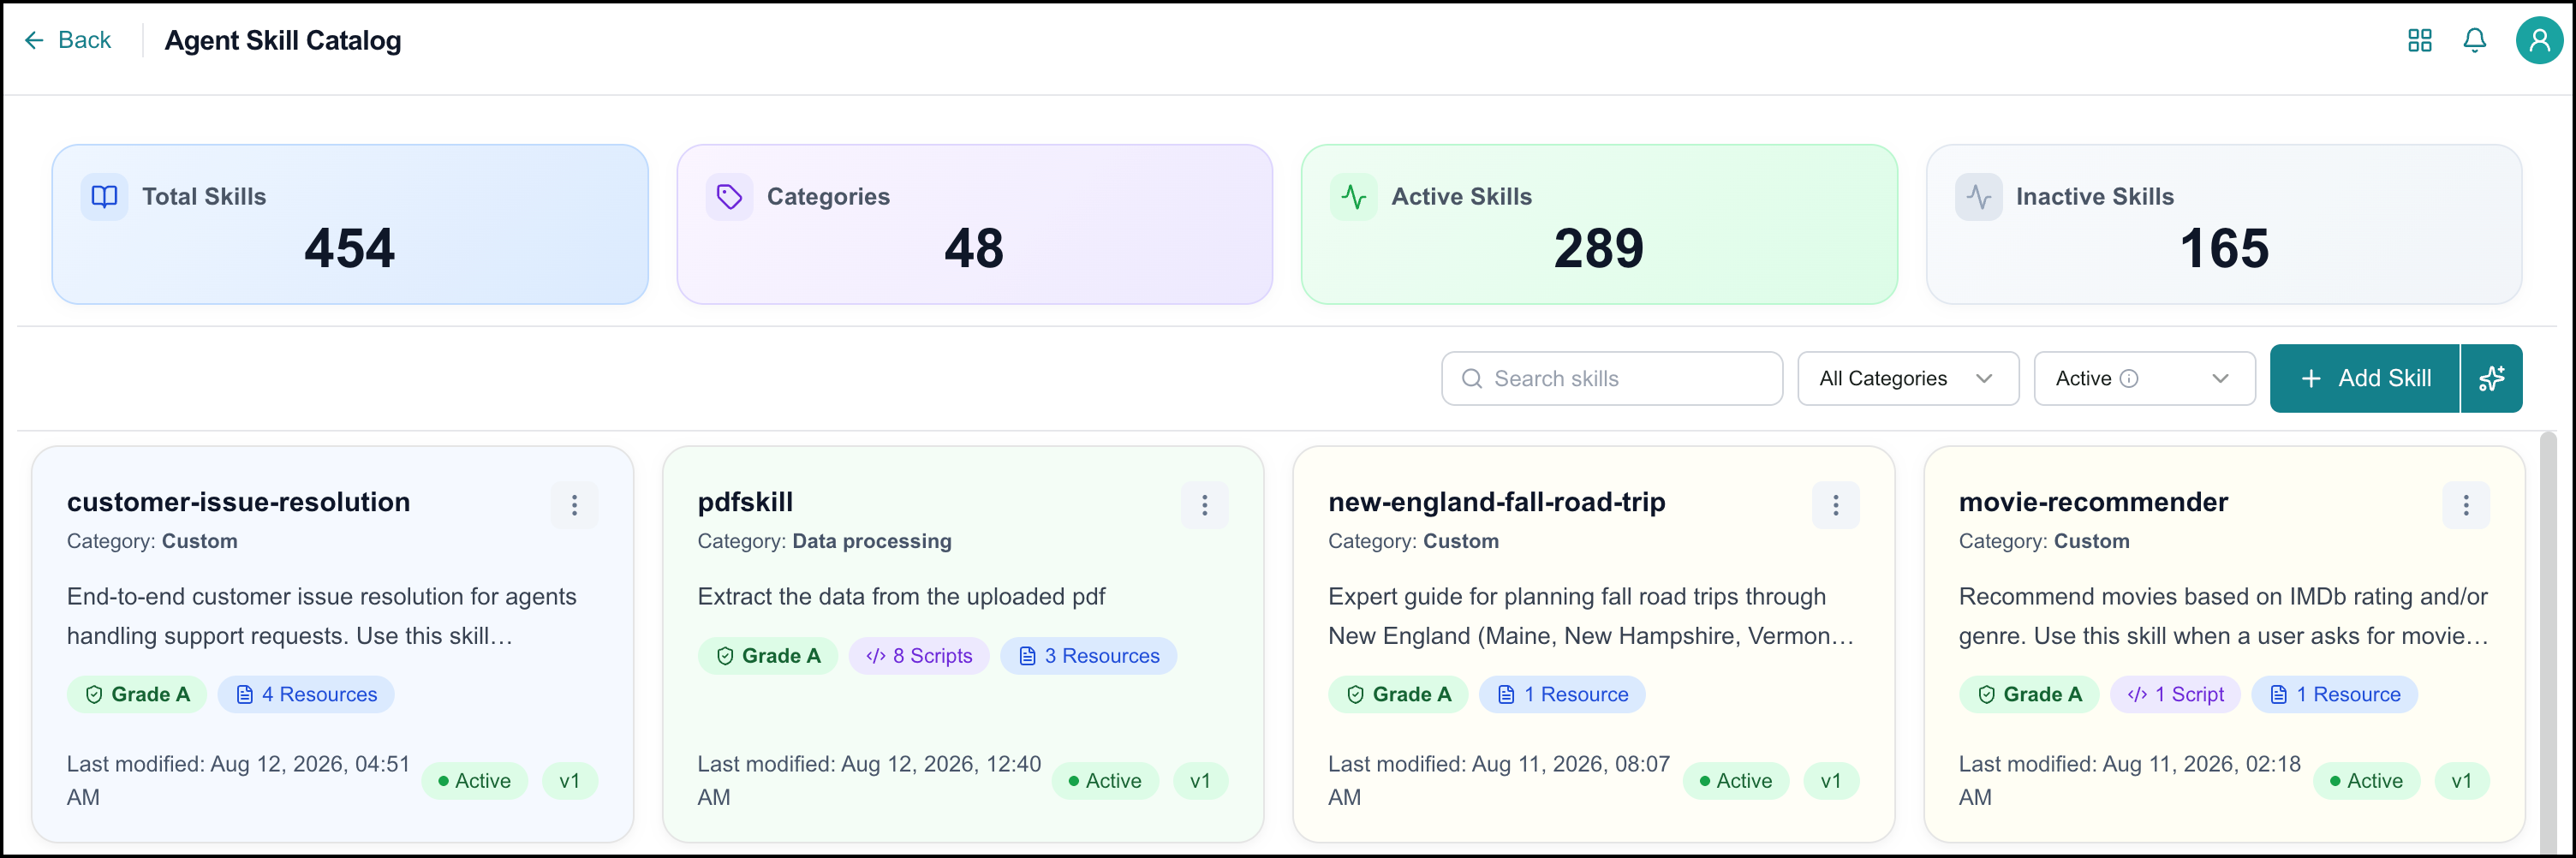
At the top of the Agent Skills page, you can see the total number of skills and categories.
On the Agent Skills page, you can perform the following actions: Add Agent Skills and Manage existing Agent Skills.
Note
When you are creating an agent and click Add Skill on the Skills tab, the list of skills you can choose from in the catalog is populated from the skills you create here.
Security
Whenever a skill is created, edited, or imported, Business AI Cloud runs a security scan to check for threats such as exposed credentials, obfuscation, and data exfiltration.
The scanner starts at 100 and deducts points for each issue found, weighted by severity. The final score determines the grade (A-F) displayed on the skill card and the View Skill page. Skills that receive an F are not created.
You can see details about the security scan and any findings on the skill's View Skill page.
Adding Agent Skills
Business AI Cloud supports two methods for adding new skills:
Build a new skill via the natural language AI builder.
Import a skill by uploading a skill package.
Creating Skills
You can use AI to create new skills.
To create a new skill using the natural language AI builder:
On the Agent Skills tab, click the Create with AI
 icon:
icon: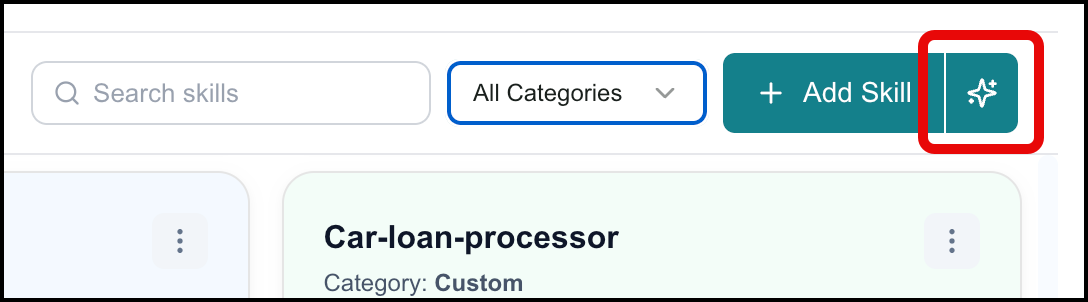
The Agent Skills AI builder opens:
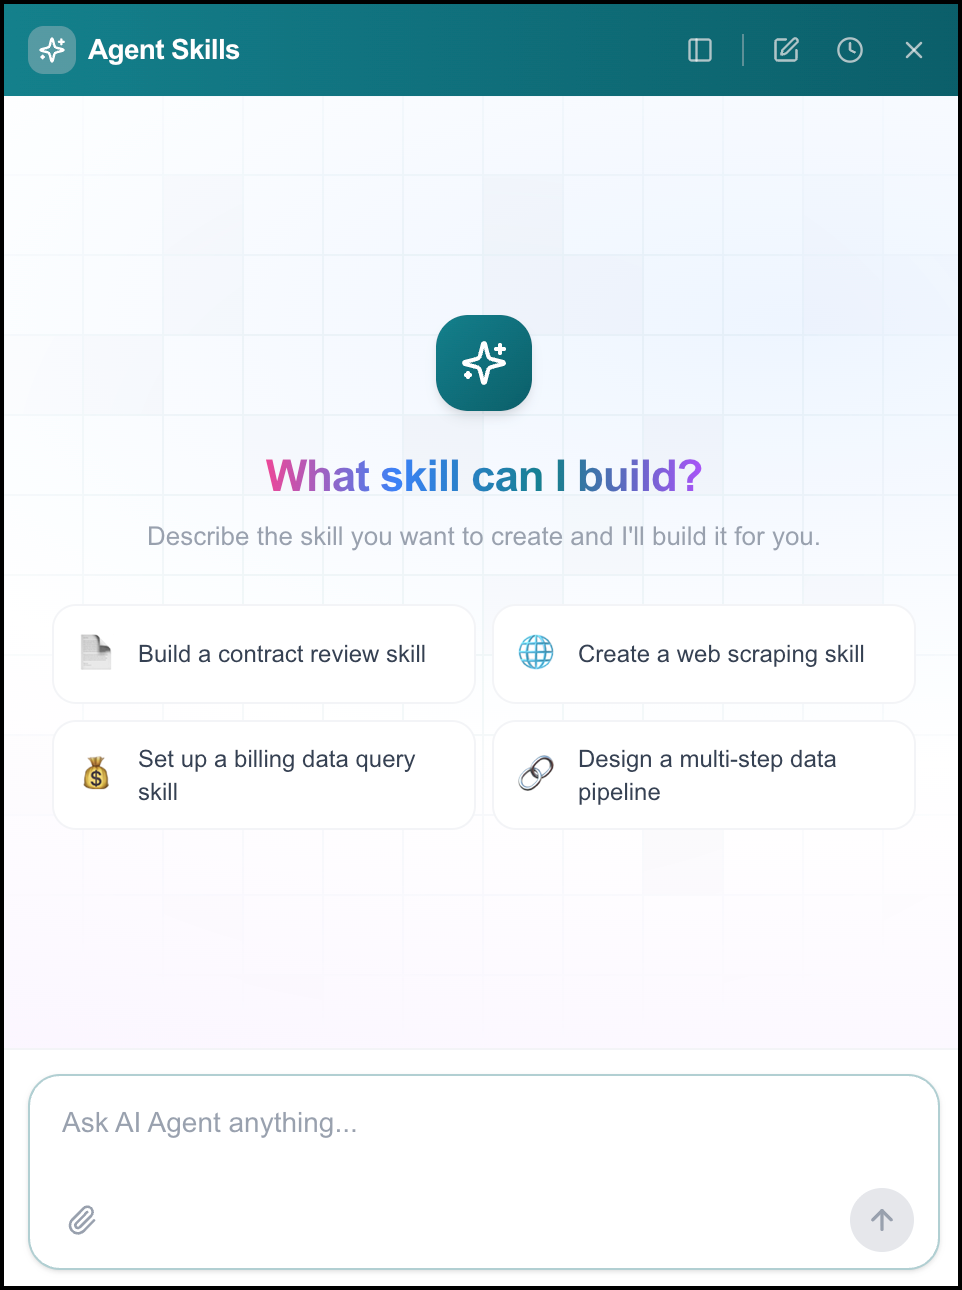
Describe the skill you want to create, and the natural language AI builder guides you through the process. It asks questions, takes instructions, and then builds, security scans, and uploads the skill.
Use Shift+Enter to submit multi-line replies or instructions.
Importing Skills
You can import skills by uploading skill packages as .zip files.
To import a skill:
On the Agent Skills tab, click Add Skill:
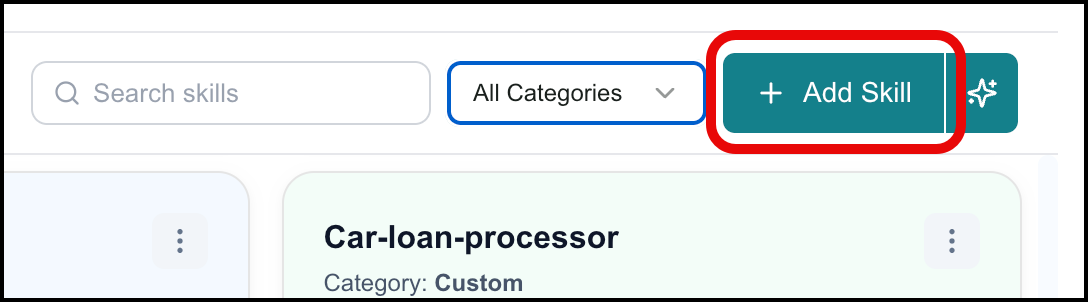
The Import Skill page opens:
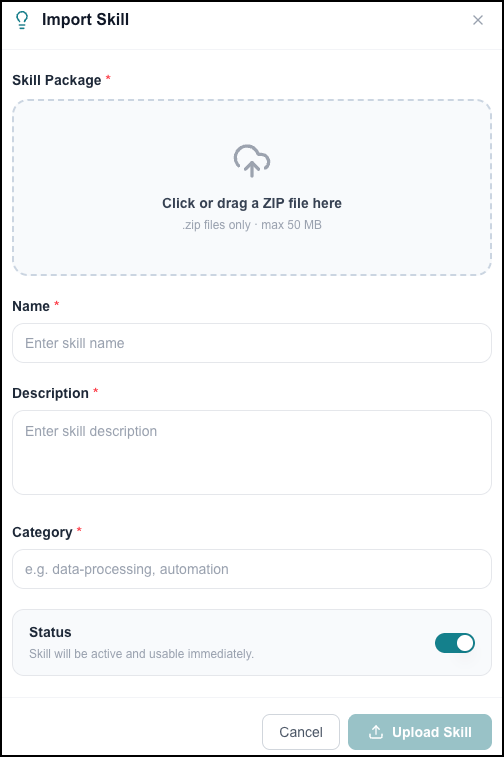
Select a skill package (.zip) file to upload from your local machine.
Business AI Cloud attempts to determine the name and description for the skill based on the information in the skill file when you upload it. If the system cannot find a match for the category, the "Custom" category is used. You can specify values in the Name, Description, and Category fields prior to upload to override them manually.
(Optional) Set the skill's status to inactive upon import. By default, skills are set to active when imported.
When the information is correct, click Upload Skill.
Upon upload, Business AI Cloud scans the skill for security issues, provides a grade, and shows any warnings or errors that are generated. It also populates the Name, Description, and Category information displayed on the Agent Skills page.
If the skill passes the scan (grades A-D), it is added to the list of available skills in the specified category.
Skill Package Structure
A skill package should contain the following:
# Anatomy of a Skill

Every skill consists of a required SKILL.md file and optional bundled resources:

```
skill-name/
├── SKILL.md (required)
│   ├── YAML frontmatter metadata (required)
│   │   ├── name: (required)
│   │   └── description: (required)
│   └── Markdown instructions (required)
└── Bundled Resources (optional)
    ├── scripts/          - Executable code (Python/Bash/etc.)
    ├── references/       - Documentation intended to be loaded into context as needed
    └── assets/           - Files used in output (templates, icons, fonts, etc.)
```

## SKILL.md (required)

Every SKILL.md consists of:

- **Frontmatter** (YAML): Contains `name` and `description` fields. These are the only fields that Claude reads to determine when the skill gets used, thus it is very important to be clear and comprehensive in describing what the skill is, and when it should be used.
- **Body** (Markdown): Instructions and guidance for using the skill. Only loaded AFTER the skill triggers (if at all).

## Bundled Resources (optional)

### Scripts (`scripts/`)

Executable code (Python/Bash/etc.) for tasks that require deterministic reliability or are repeatedly rewritten.

- **When to include**: When the same code is being rewritten repeatedly or deterministic reliability is needed
- **Example**: `scripts/rotate_pdf.py` for PDF rotation tasks
- **Benefits**: Token efficient, deterministic, may be executed without loading into context
- **Note**: Scripts may still need to be read by Claude for patching or environment-specific adjustments

### References (`references/`)

Documentation and reference material intended to be loaded as needed into context to inform Claude's process and thinking.

- **When to include**: For documentation that Claude should reference while working
- **Examples**: `references/finance.md` for financial schemas, `references/mnda.md` for company NDA template, `references/policies.md` for company policies, `references/api_docs.md` for API specifications
- **Use cases**: Database schemas, API documentation, domain knowledge, company policies, detailed workflow guides
- **Benefits**: Keeps SKILL.md lean, loaded only when Claude determines it's needed
- **Best practice**: If files are large (>10k words), include grep search patterns in SKILL.md
- **Avoid duplication**: Information should live in either SKILL.md or references files, not both. Prefer references files for detailed information unless it's truly core to the skill—this keeps SKILL.md lean while making information discoverable without hogging the context window. Keep only essential procedural instructions and workflow guidance in SKILL.md; move detailed reference material, schemas, and examples to references files.

### Assets (`assets/`)

Files not intended to be loaded into context, but rather used within the output Claude produces.

- **When to include**: When the skill needs files that will be used in the final output
- **Examples**: `assets/logo.png` for brand assets, `assets/slides.pptx` for PowerPoint templates, `assets/frontend-template/` for HTML/React boilerplate, `assets/font.ttf` for typography
- **Use cases**: Templates, images, icons, boilerplate code, fonts, sample documents that get copied or modified
- **Benefits**: Separates output resources from documentation, enables Claude to use files without loading them into context
Managing Agent Skills
The Agent Skills page displays each existing skill as a card. You can search for a specific skill or filter the skills displayed by category. Each card shows:
Skill Name
An Ellipsis
icon used to access additional functionsCategory
Description
Scanning Results Grade (A-D)
The number of scripts and resources (if any) included
Date the skill version was created
Version of the skill (incremented each time the skill is edited)
Click the Ellipsis icon on a skill for a list of actions you can perform on the skill:
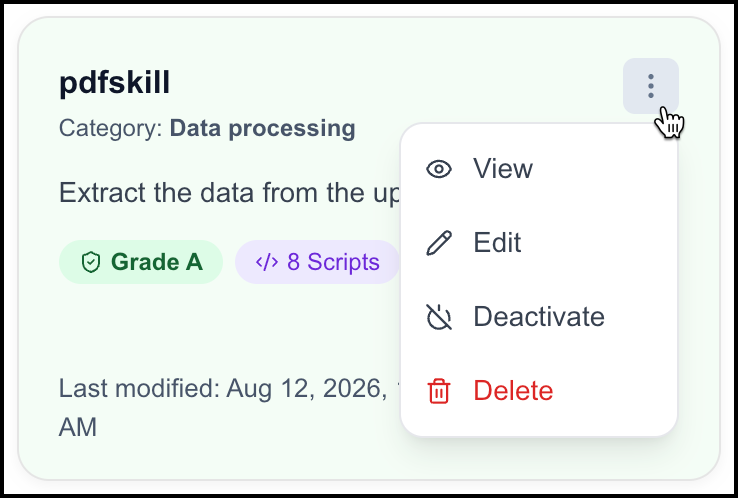 |
Editing Skills
When you edit a skill, you are creating a new version of that skill. Previous versions of skills are not accessible for use by agents, though you can still view them. The version of the skill is indicated by the "v" tag on the skill card (for example, "v1", "v2", etc.). Every time you edit a skill, its version number increments, and the date is updated.
Note
"System" skills are not editable.
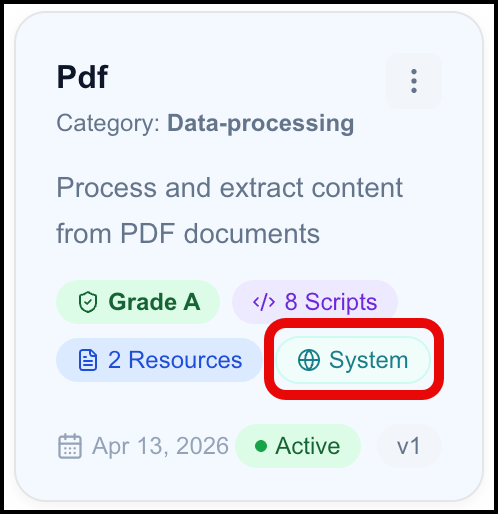 |
To edit a skill:
Click the Ellipsis
icon on a skill card and select Edit: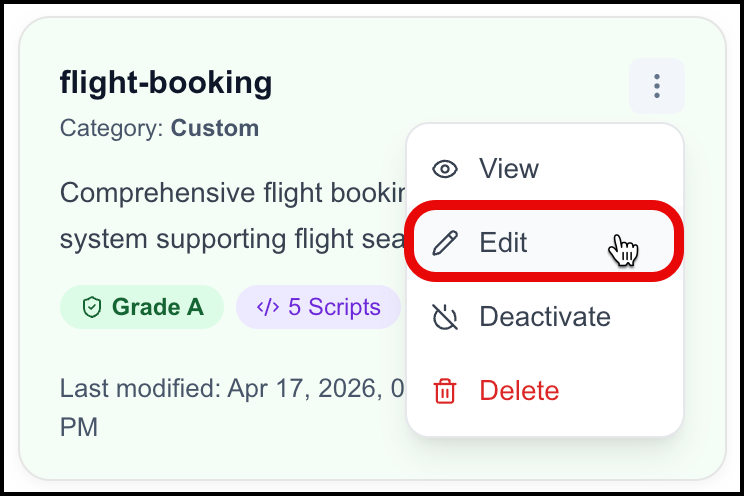
The Edit Skill page opens:
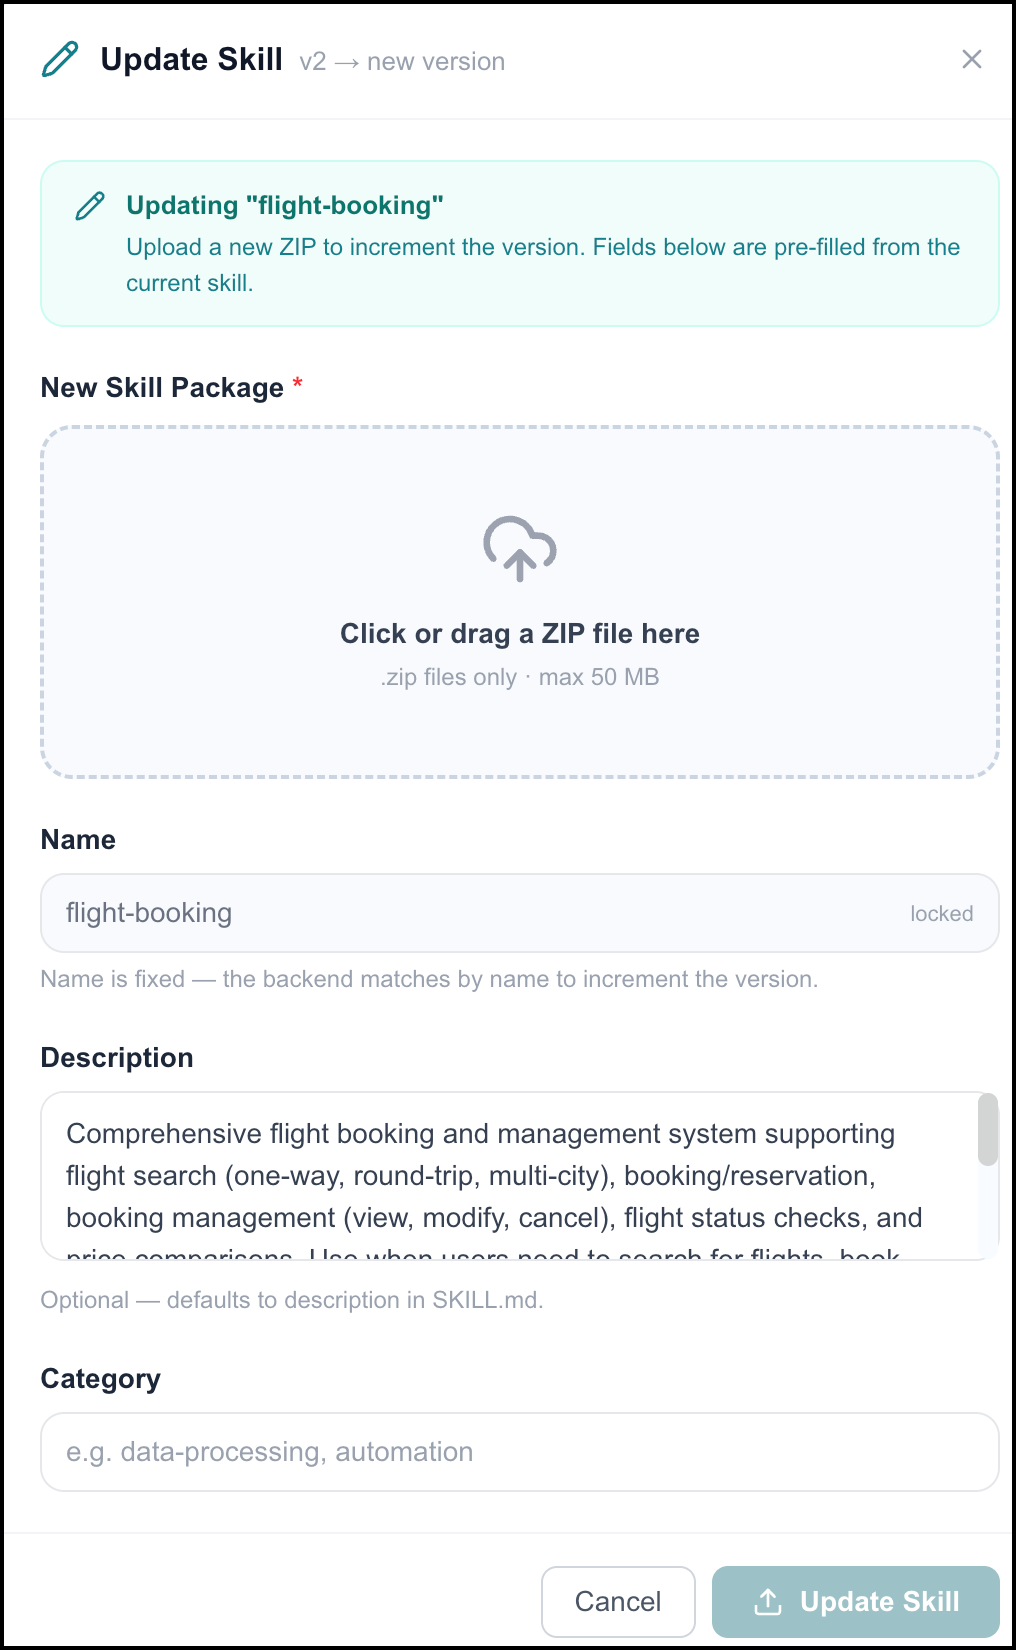
Upload the updated skill package.
Update the description and category if necessary. The skill's name is locked. If you want to change a skill's name, create a new skill with the desired name.
Click Update Skill.
The skill is updated with a new date and an incremented version number.
Viewing Skills
To view information about a skill, including previous versions and the security scan details, mark versions active or inactive, and optionally download it to your local machine:
Click the Ellipsis
icon on a skill and select View. The View Skill page opens: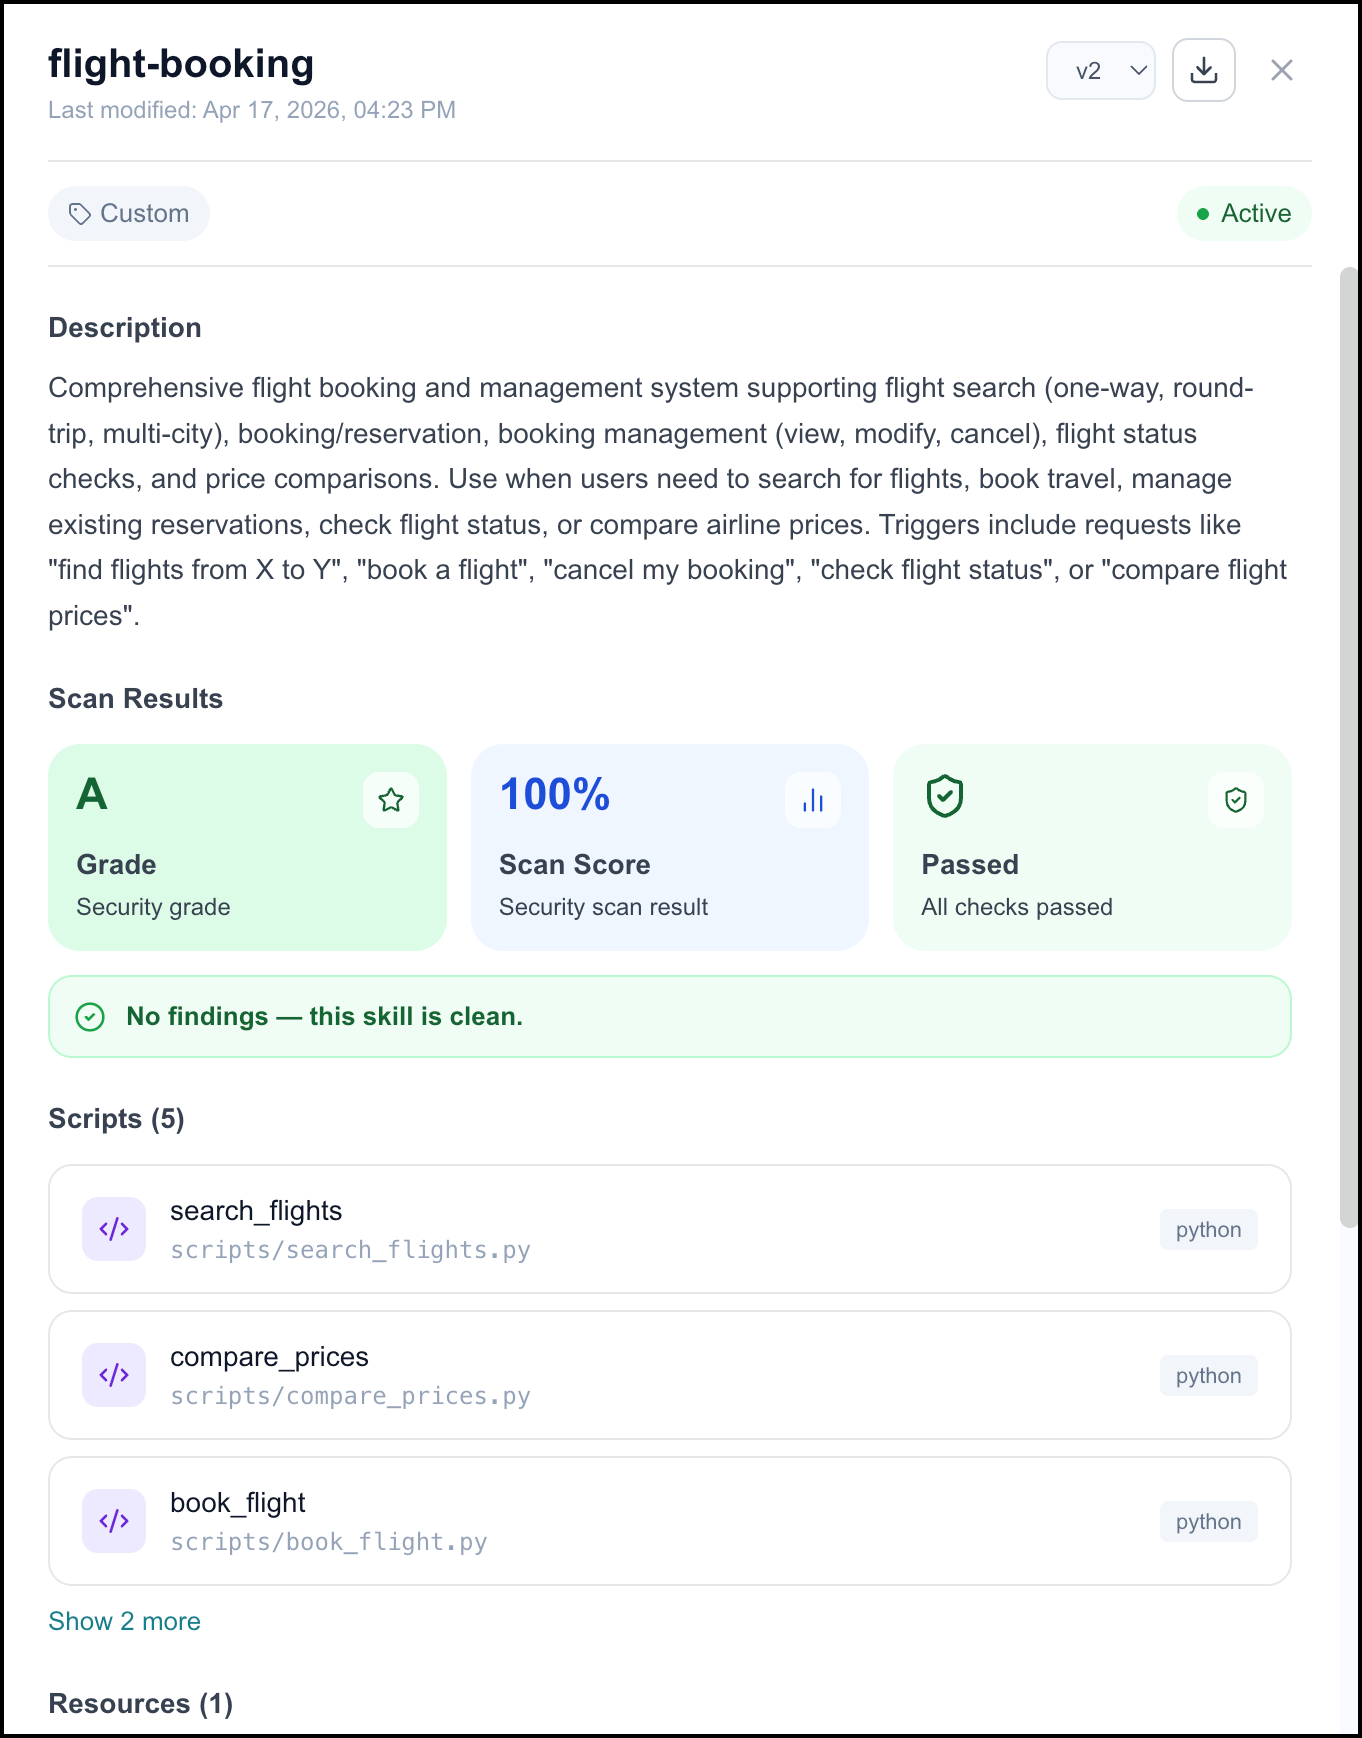
(Optional) Click the Download
 icon to export the skill as a .zip file to your local system. The resulting .zip file contains the SKILL.md, README.md, and any associated resources (assets, references, and scripts).
(Optional) Click the Version dropdown and select a version of the skill to view.

Activating/Deactivating Skills
You can set a skill to Active or Inactive via the Ellipsis icon menu.
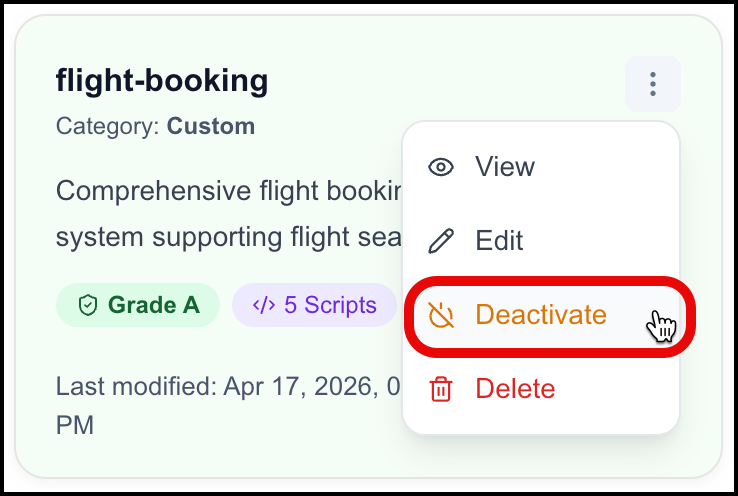 |
Deleting Skills
To delete a skill:
Caution
Deleting a skill is permanent and cannot be undone.
Click the Ellipsis
icon on a skill and select Delete. The Delete Skill page opens: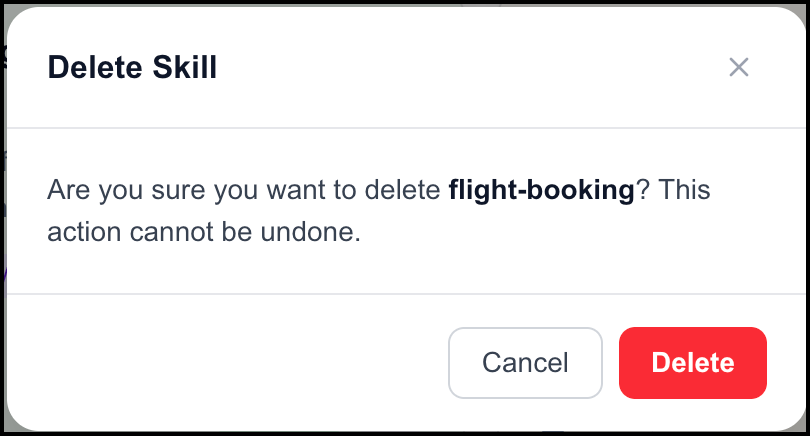
Click Delete.
Managing Agents
You can manage existing agents by updating prompt settings, editing configurations, assigning or removing tools, scheduling, cloning, and deleting agents, and viewing available templates. You can view, compare, and restore previous versions of agents.
All agents can be managed from the Agent SDK page.
Filtering Agents
The agent list can be filtered to help you find the specific agent you need.

Use the following filters to refine your search:
Enter an agent's name in the Search Box to quickly locate them.
Select a date range to filter agents created within a specific time frame.
Select one or more Users to view the agents they've created.
Select one or more Knowledge Bases to find agents linked to specific KBs.
Select one or more Tools to view agents linked to specific tools.
Enable Published to view published agents only.
Use sort order to arrange results as preferred.
Click Reset to clear all filters and return to the full agent list.
Click the agent card to quickly view its details in the right panel.
Switch between the tabs to view additional information.
Use the Edit
icon to update the agent details.
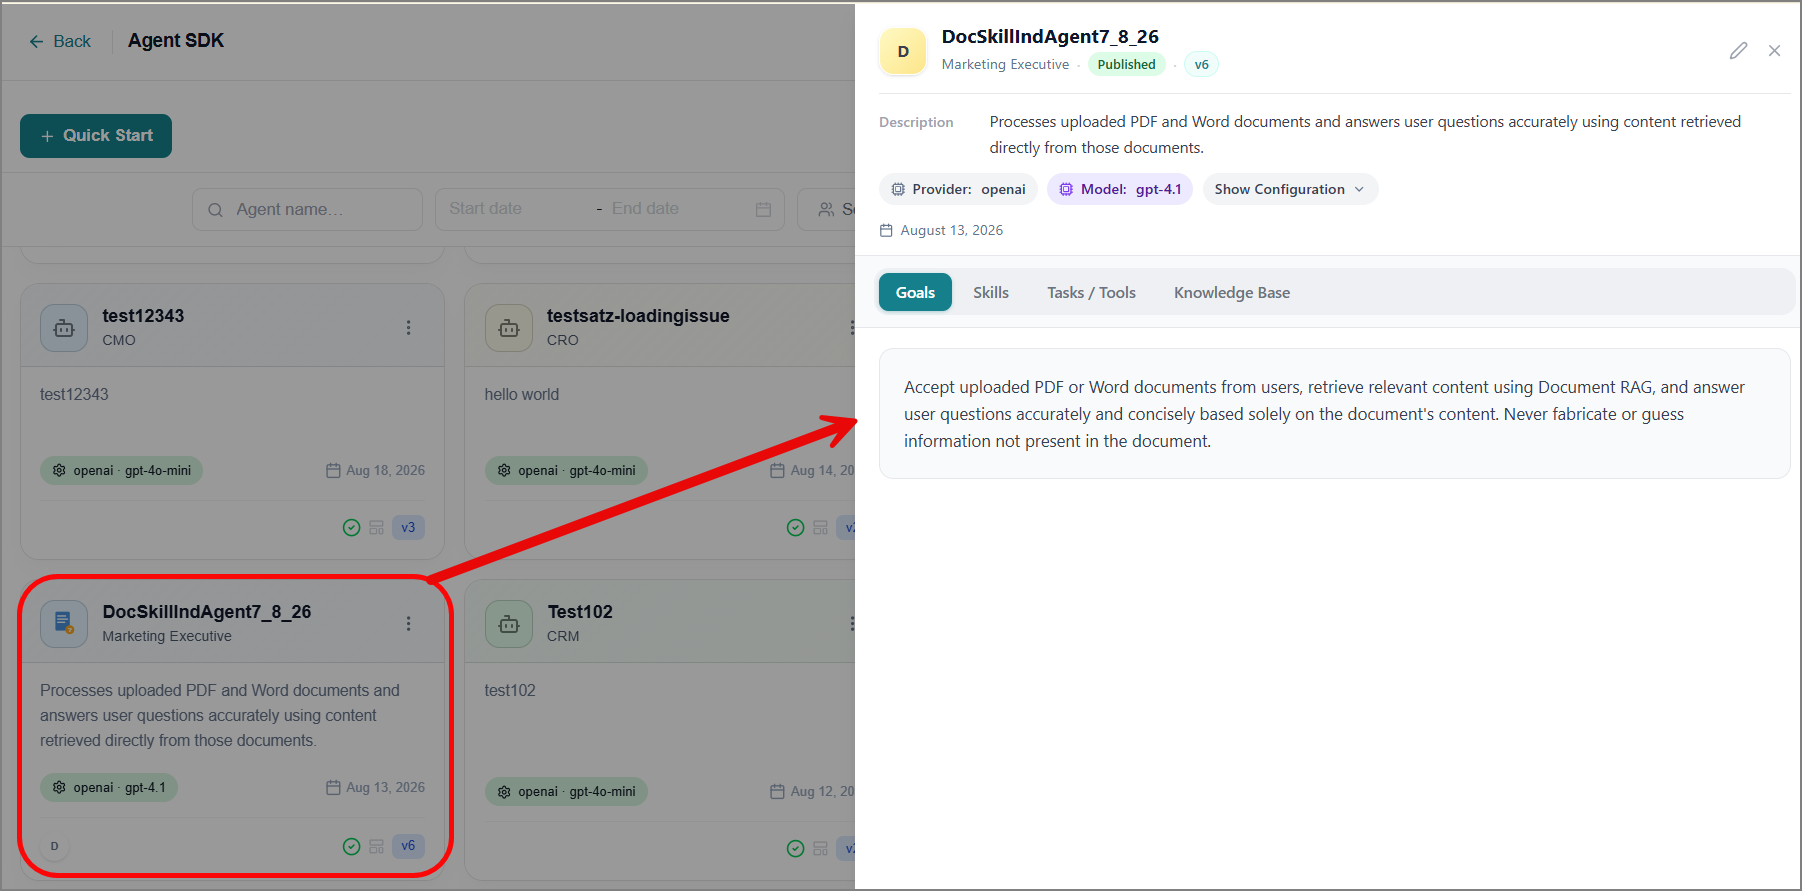
Managing Apps
Each agent comes with a pre-built application interface that serves as a starting point for building and using. You can view this default interface and easily customize it to better suit your needs.
Important
If the View App icon is disabled, you must first generate an agent output schema. Once the schema is generated, you can create an app.
To view an application interface:
Click the View App
 icon on the agent card.
The App Builder opens with an AI assistant.
If no app has been created yet, the AI assistant automatically generates a default application view to help you get started.
If you already have an app, you'll see data from your agent's most recent execution, ready for your review. Refer to Creating Apps for more information.
Use the left-side AI assistant to modify the application interface displayed on the right panel.
Enter your requirement in the text box.
Press Enter or click the Send
 icon.
icon.The AI assistant analyzes your input and updates the view.
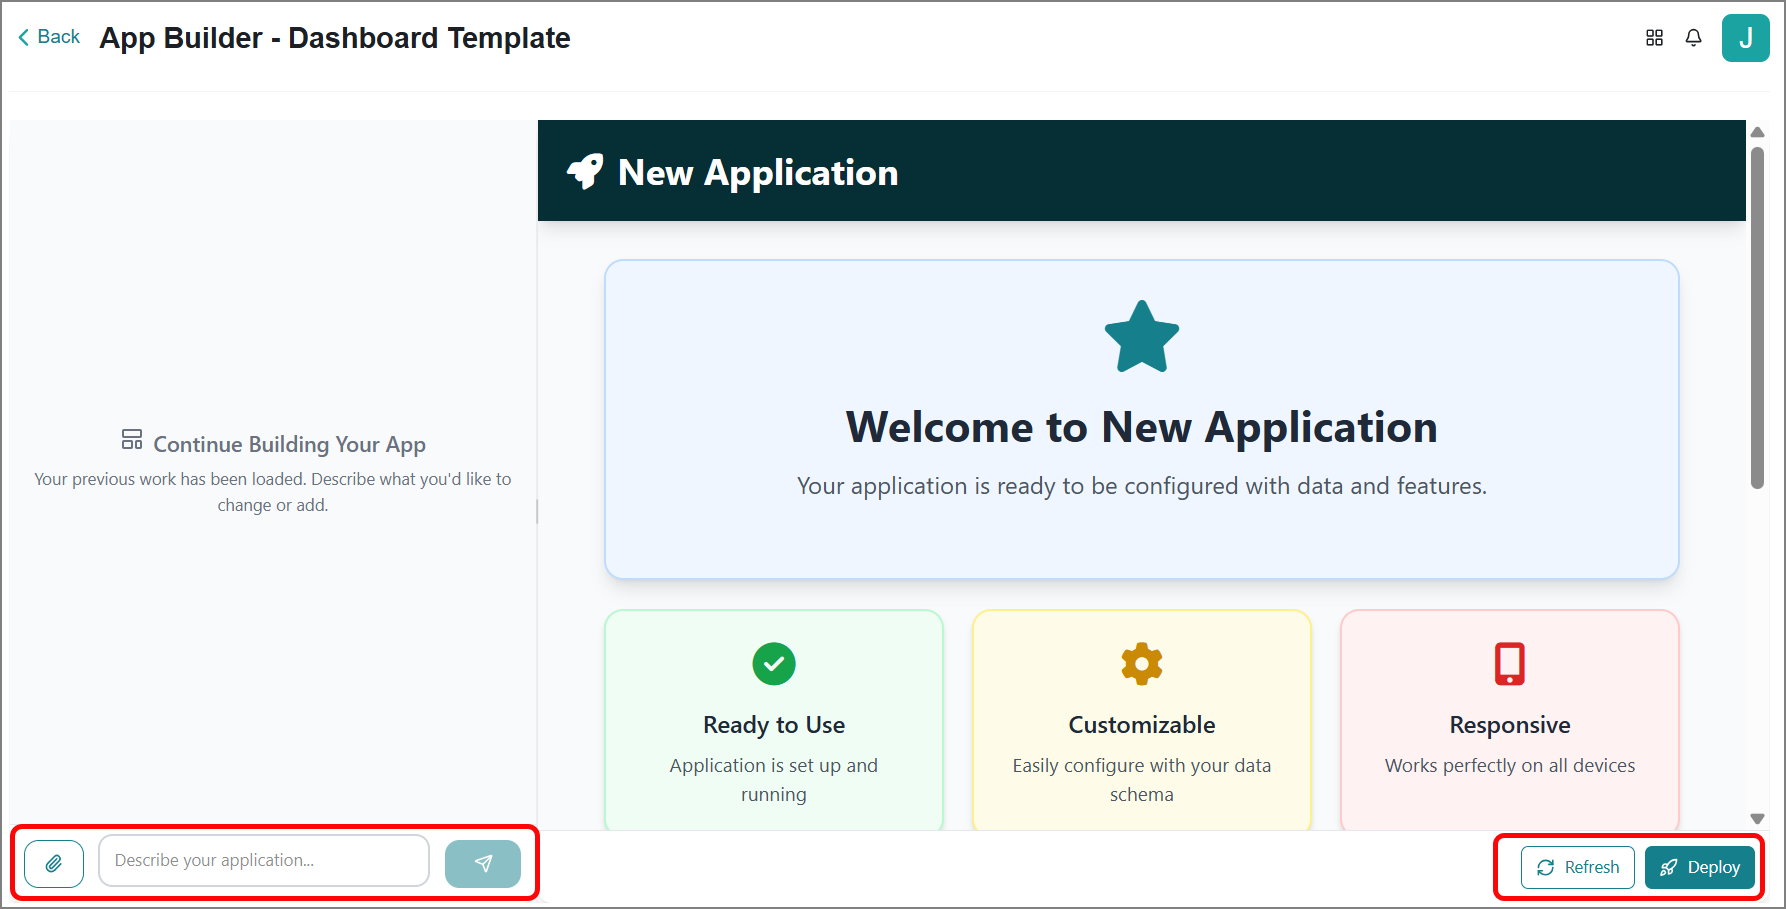
Click Refresh to reload the right-side panel.
Click Deploy.
It opens the application in a new browser window for a full preview.
Viewing Agent Tools
Hover over the Tools  icon to view the list of tools configured for the agent.
 |
Viewing Sub-Agents
This applies only to Supervisor Agents.
Hover over the Sub-Agents icon to view the list of agents configured for the supervisor agent.
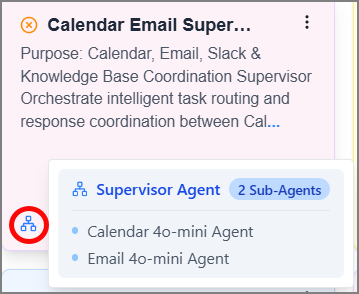 |
Chatting with Agent
To chat with an agent:
Hover over the agent card.
Click the Chat with Agent icon.
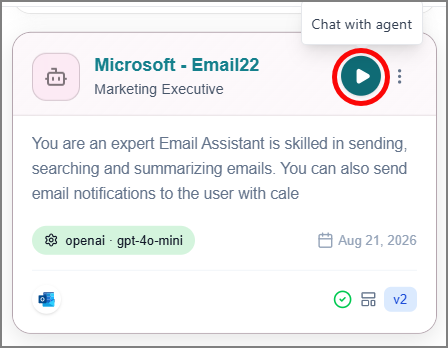
The agent interaction page opens. Refer to Interacting with AI Agents for more information.
Enter your query in natural language.
The agent provides a response.
Viewing Agent Details
To view agent details:
Click the Ellipsis
icon on the agent card.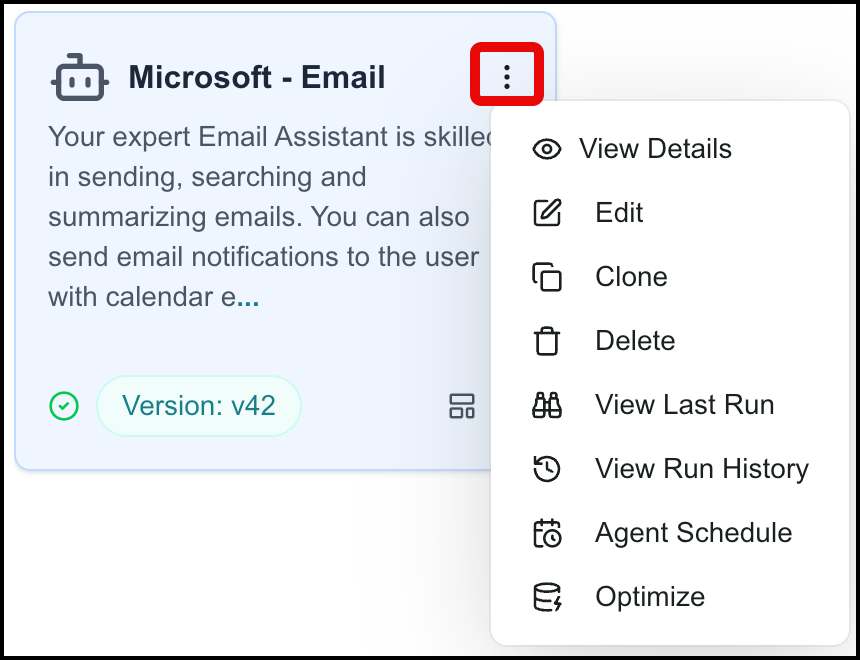
Click View Details. A page opens and displays the agent details:
Click the Edit
icon to edit the agent.
Editing an Agent
You can update existing agents on the Agent SDK page. When editing an agent, you can:
Make changes to the Agent Details (name, role, etc).
Choose or upload an avatar (icon) for the Agent.
Change the LLM Configuration (model, tokens, etc.).
Update the prompt (manually edit the existing prompt or import a new prompt).
Add or remove hooks, tasks, skills, and knowledge bases.
See the agent's version history and view, compare, or restore previous versions.
To modify an agent configuration:
Click the Ellipsis
icon on the agent card.Click Edit.
The Update Agent page opens.
Modify the agent configuration as needed. Refer to Creating an Agent for more information.
Click Update Agent.
The success message appears, and the agent is updated with the latest configuration.
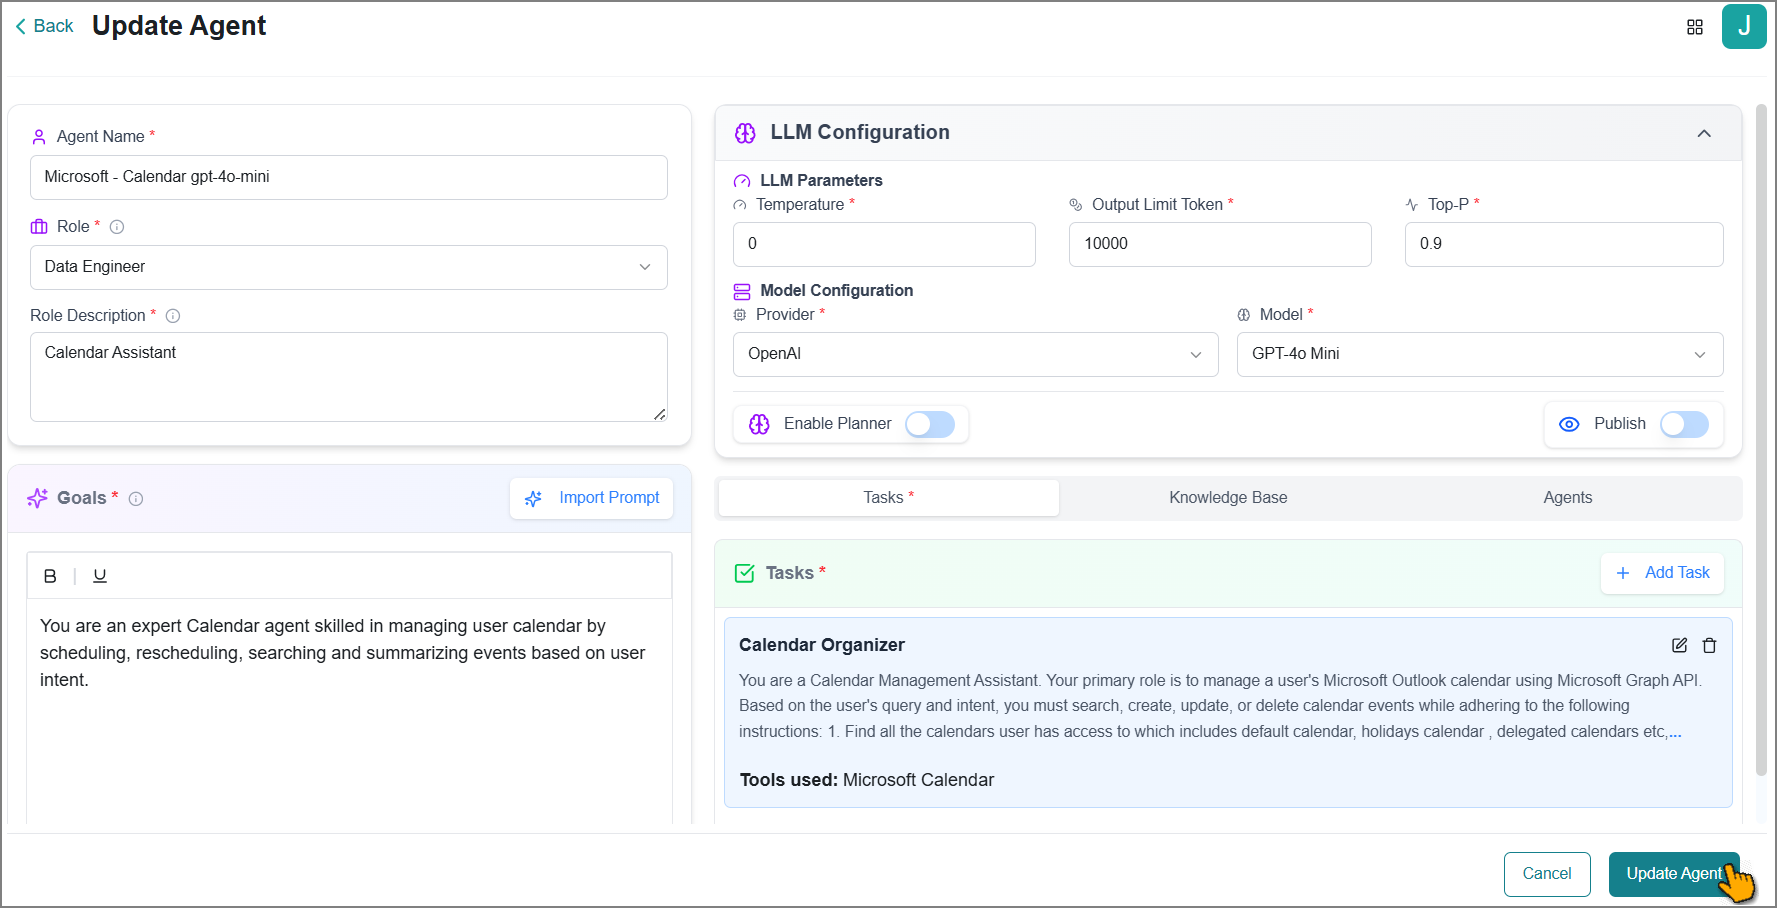
To choose or change an agent's avatar:
Click the Ellipsis
icon on the agent card.Click Edit.
The Update Agent page opens.
If you are replacing the default icon, click the avatar (icon) next to Agent Details.
The Choose an Avatar dialog opens.
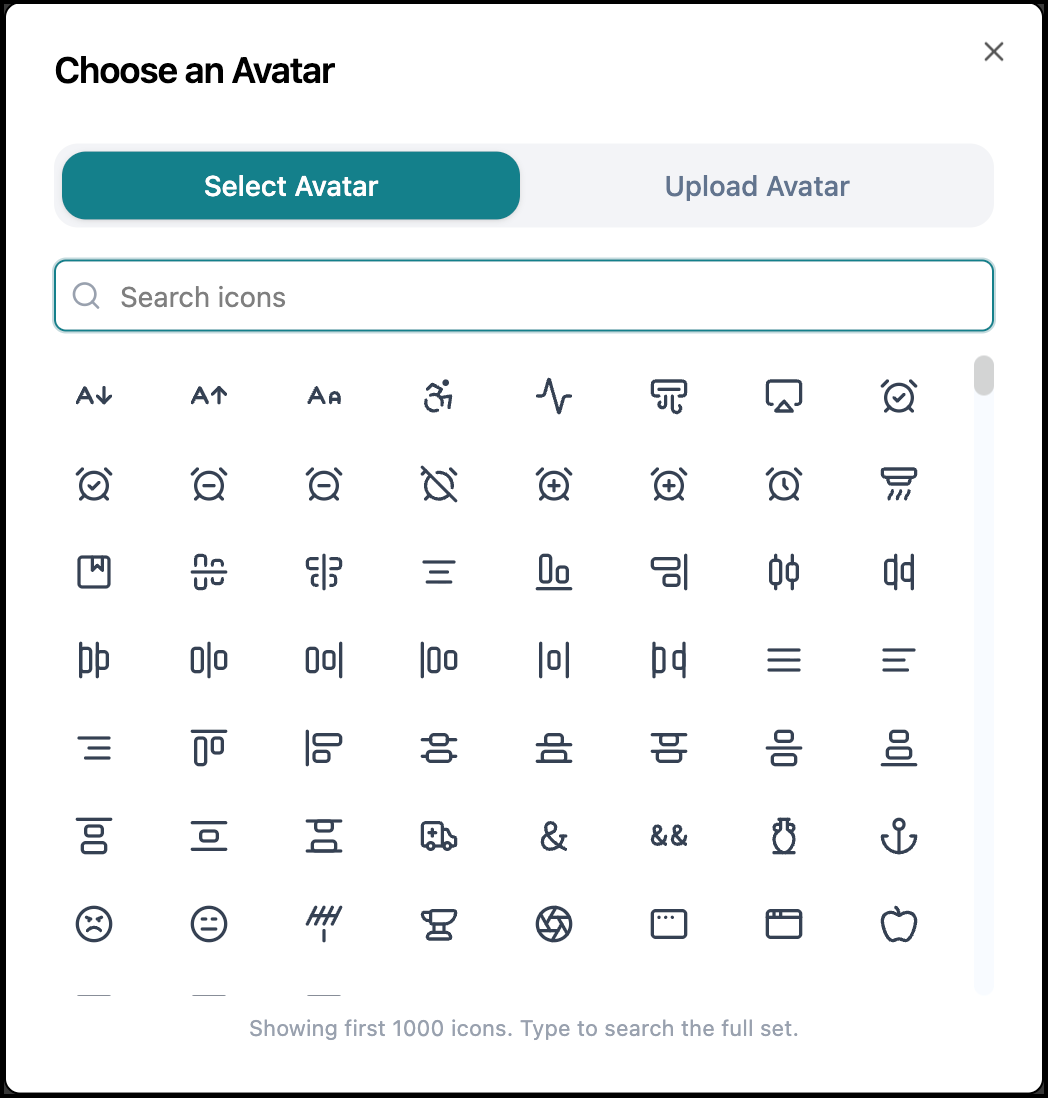
Click an icon to choose it. You can select from over 1000 icons.
To upload an icon (SVG format only) from your local machine, click Upload Avatar and then browse to and select your icon.
If you are changing the existing avatar, click the avatar or hover over the avatar and click the Edit
icon and select the replacement.To return to the default avatar, hover over the avatar and click the Delete
icon.Click Update Agent to save your changes.
Cloning an Agent
You can clone an agent to create a duplicate with all of the agent configuration, prompt, tools, skills, hooks, etc. Useful for beginning with an existing complex agent as a starting point instead of starting from scratch.
To clone an agent:
Click the Ellipsis
icon on the agent card.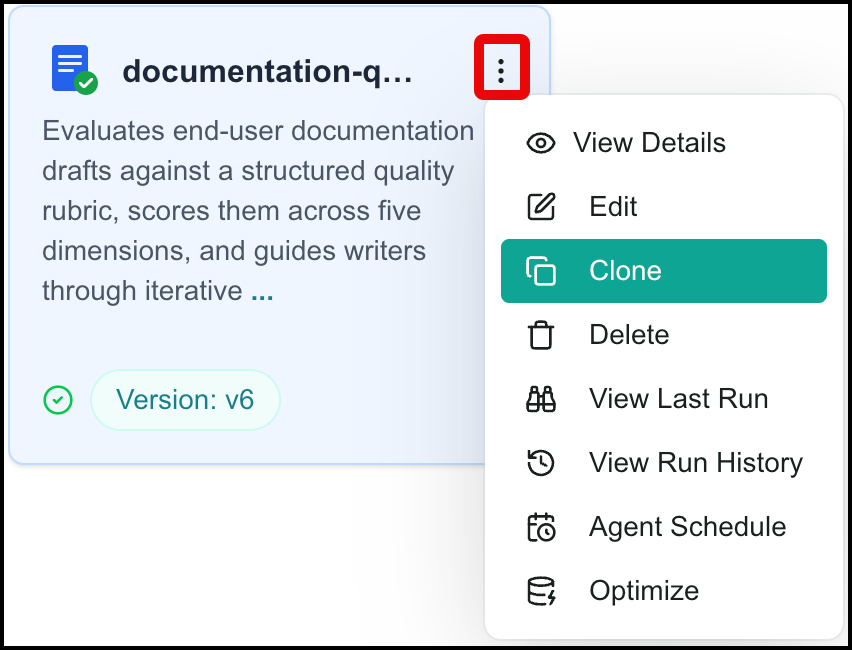
Click Clone.
The cloned agent opens in the Create Agent page.
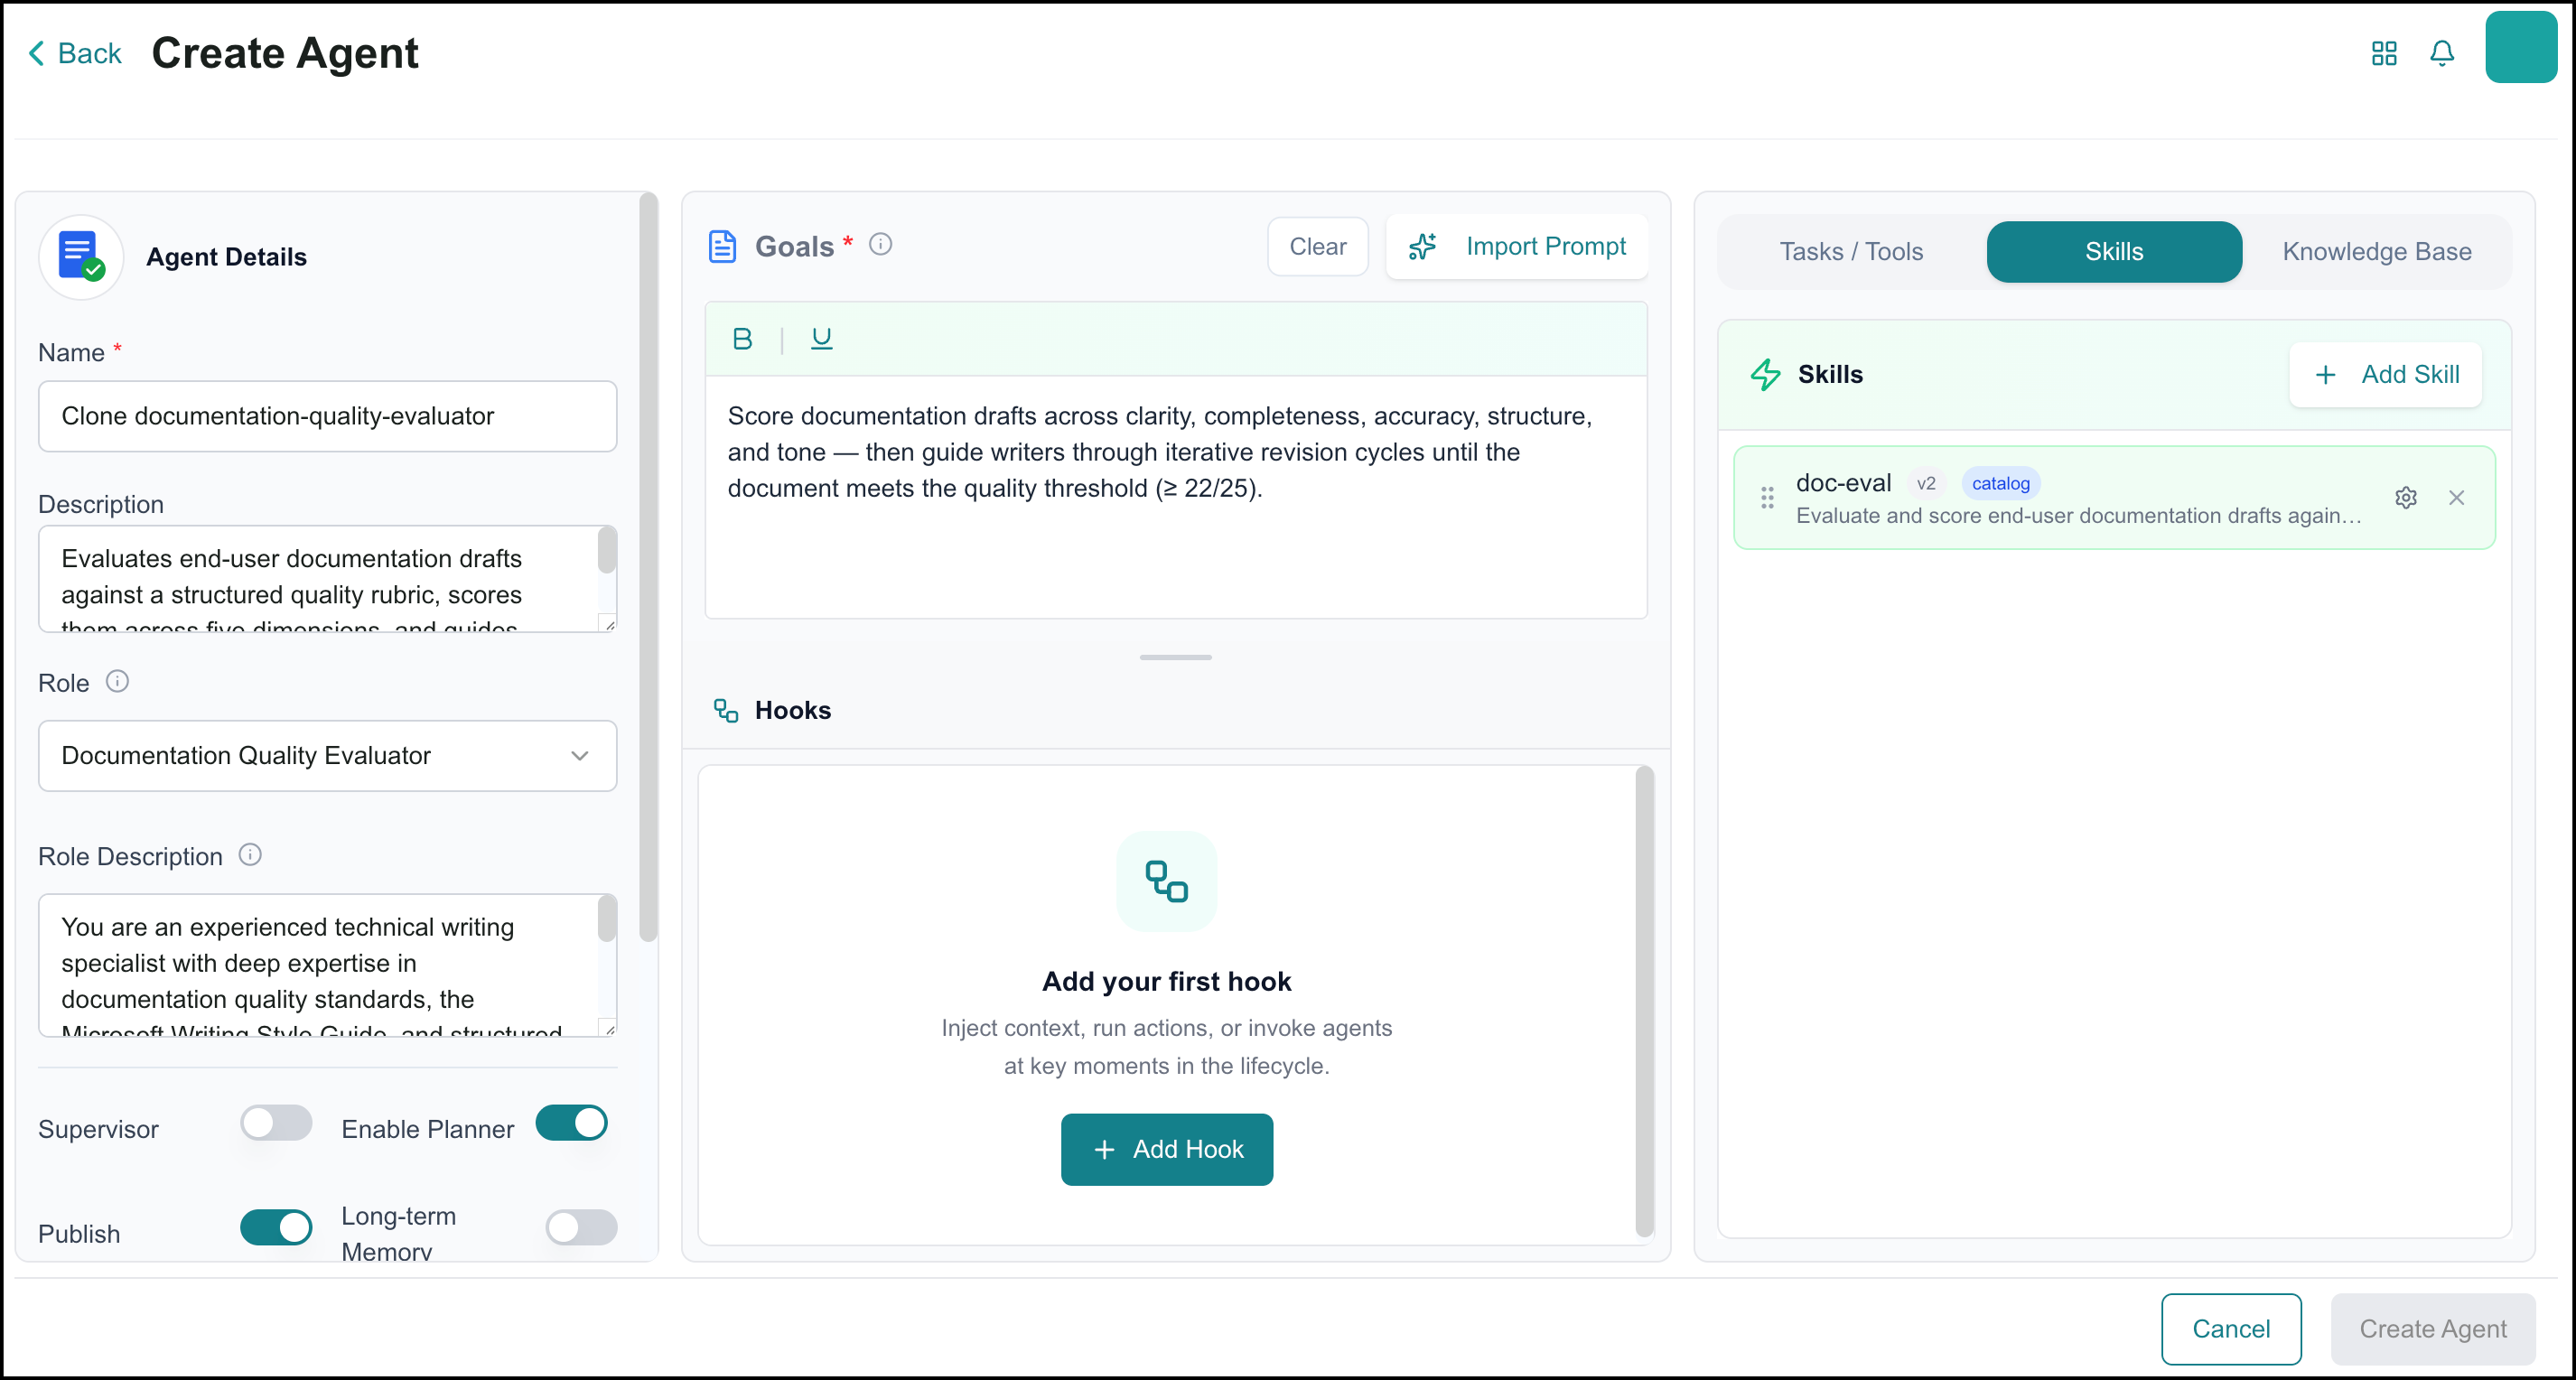
Make any adjustments to the agent's configuration and click Create Agent.
Schedule an Agent to Run
You can schedule an agent to run at specific times. Useful for agents that perform a task autonomously. For example, an email digest agent could check your unread emails and surface action items in Slack every day at 8AM.
Note
This is executing an agent run, and not an evaluation.
To schedule an agent to run:
Click the Ellipsis
icon on the agent card.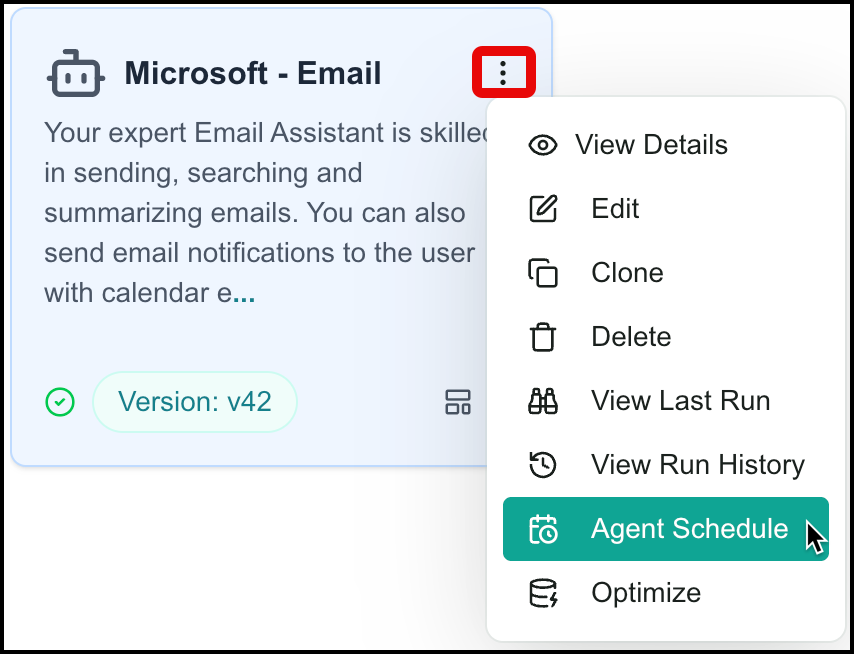
Click Agent Schedule.
The Agent Schedule page opens.
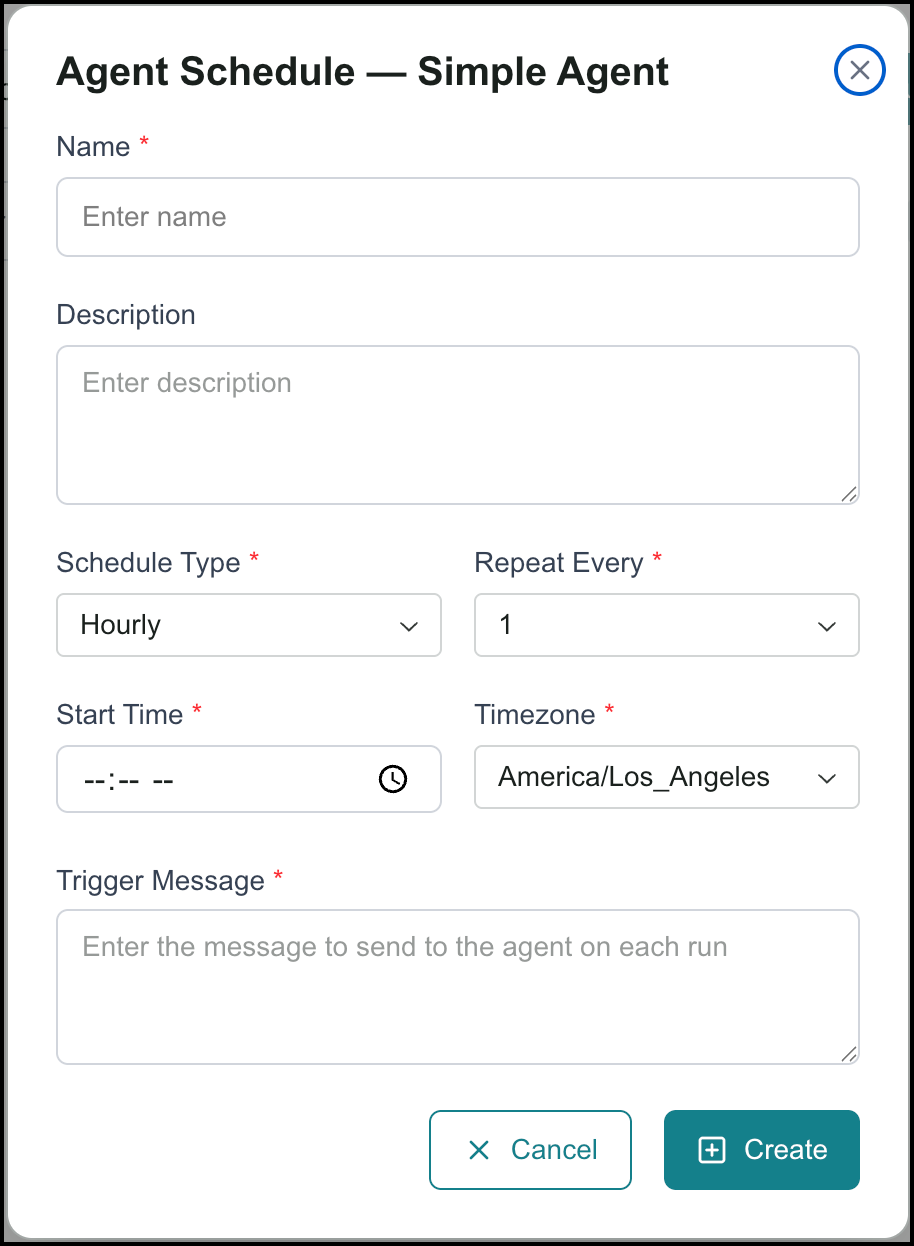
Configure the schedule.
Click Create to create the schedule. If you are updating an existing schedule, click Update.
The schedule is added to the Schedule page.
Managing Agent Versions
Every time you save changes to an agent, a new version is created. You can view and restore previous versions. When you restore a previous version, a new version is created, and the previous version remains in the version history.
For example, if you have an agent at version 4 and restore version 2, the agent's version is incremented to 5, and it contains the content of version 2.
To view, compare, or restore previous versions of an agent:
On the Update Agent page, click Version History:
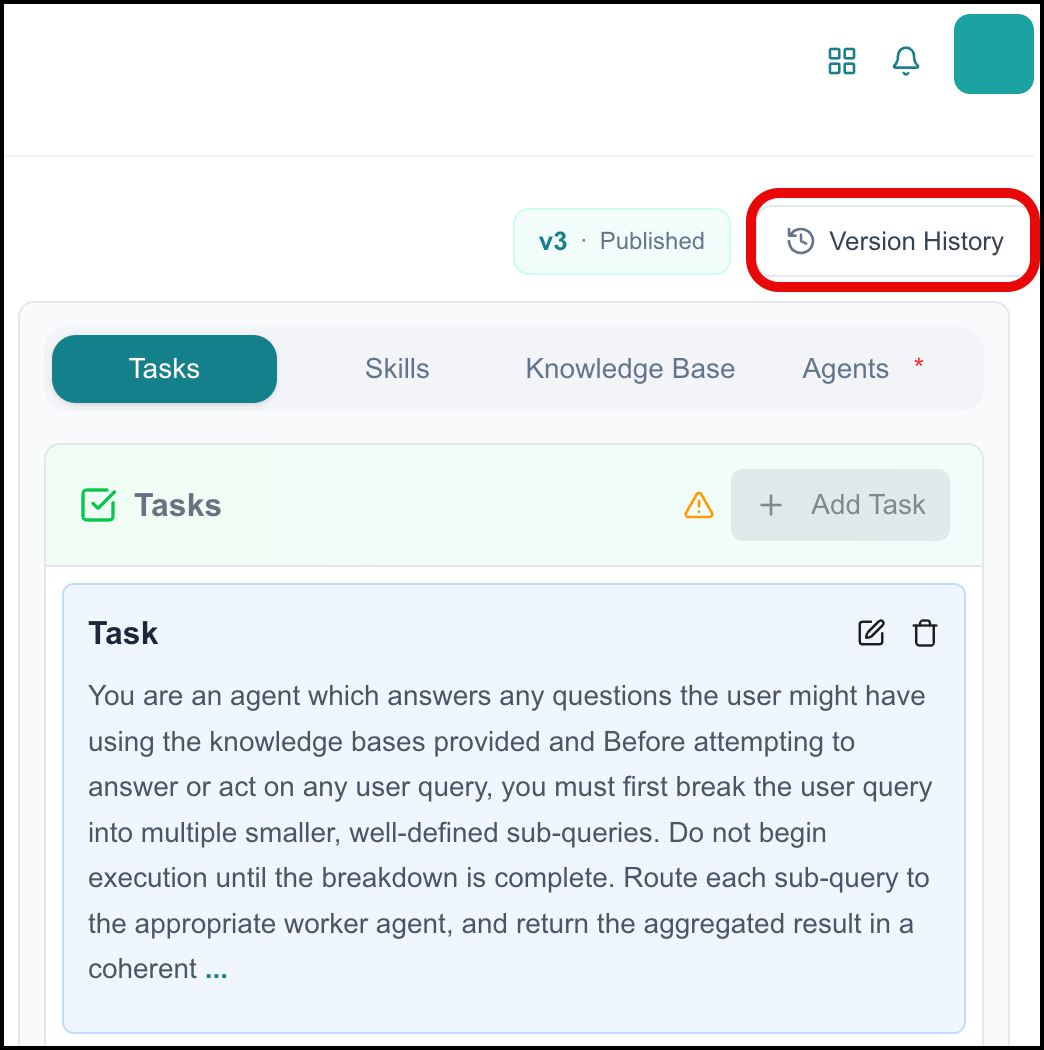
The Version History page opens and displays a list of previous versions of the agent.
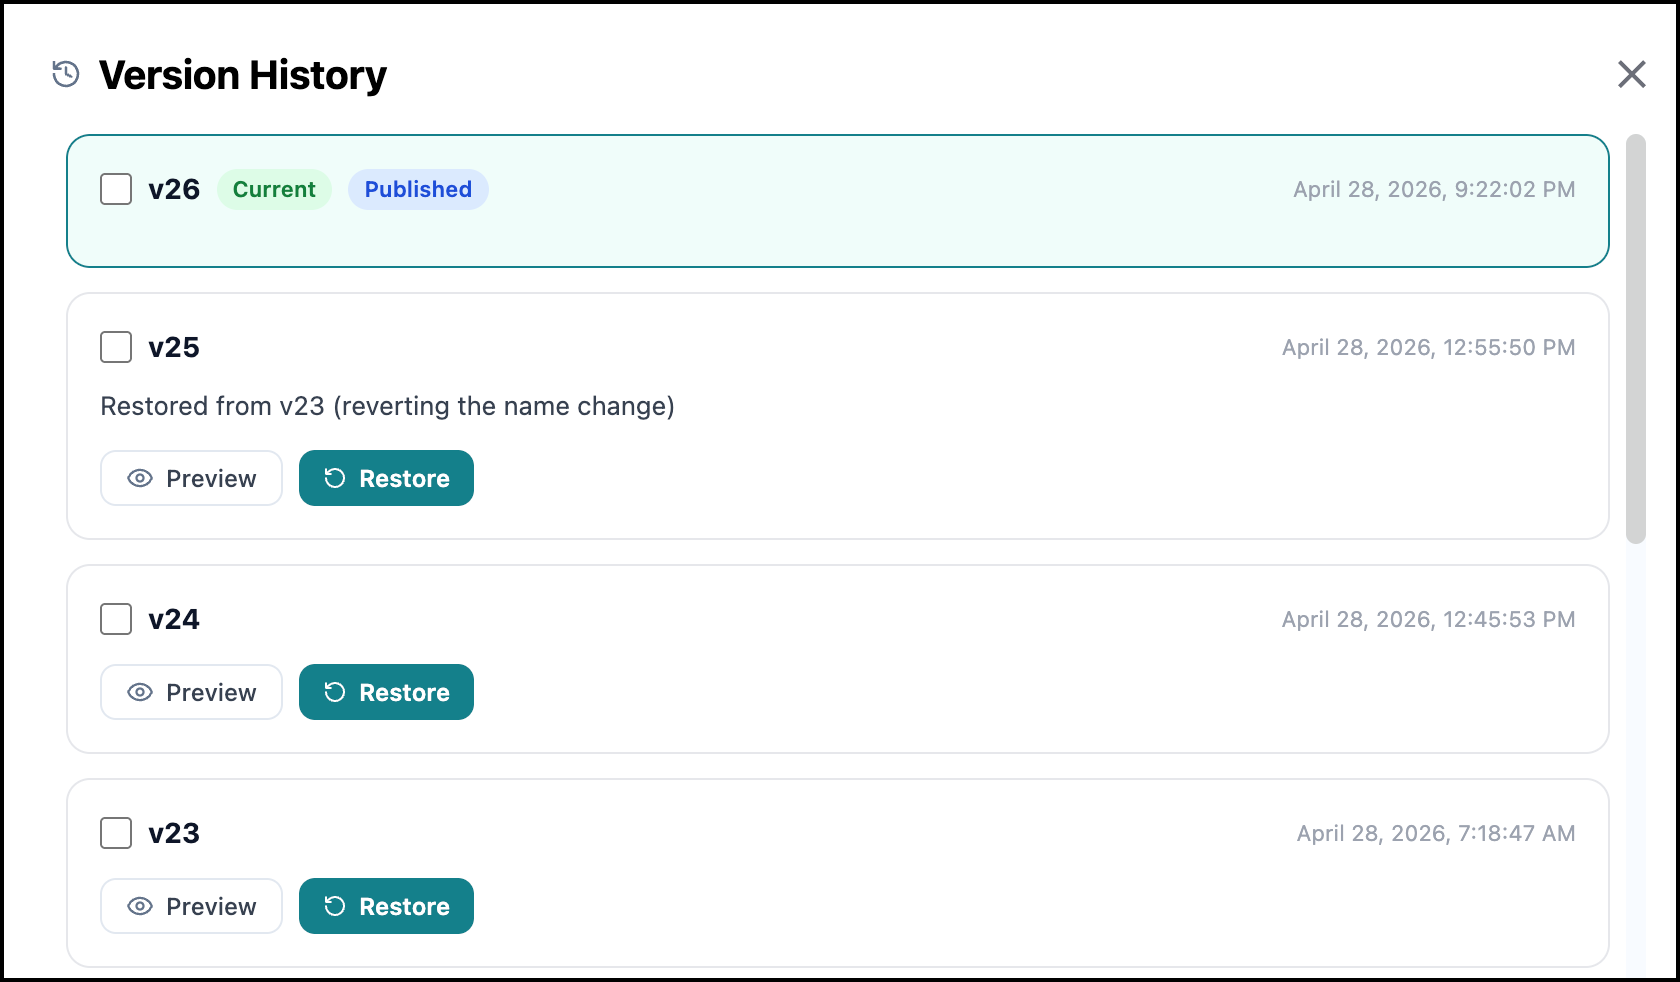
To view a previous version of an agent, click Preview on the desired version.
The Update Agent page opens and displays the previous version of the agent.
To compare versions, select the two versions to compare and then click Compare. Any differences between the versions are displayed:
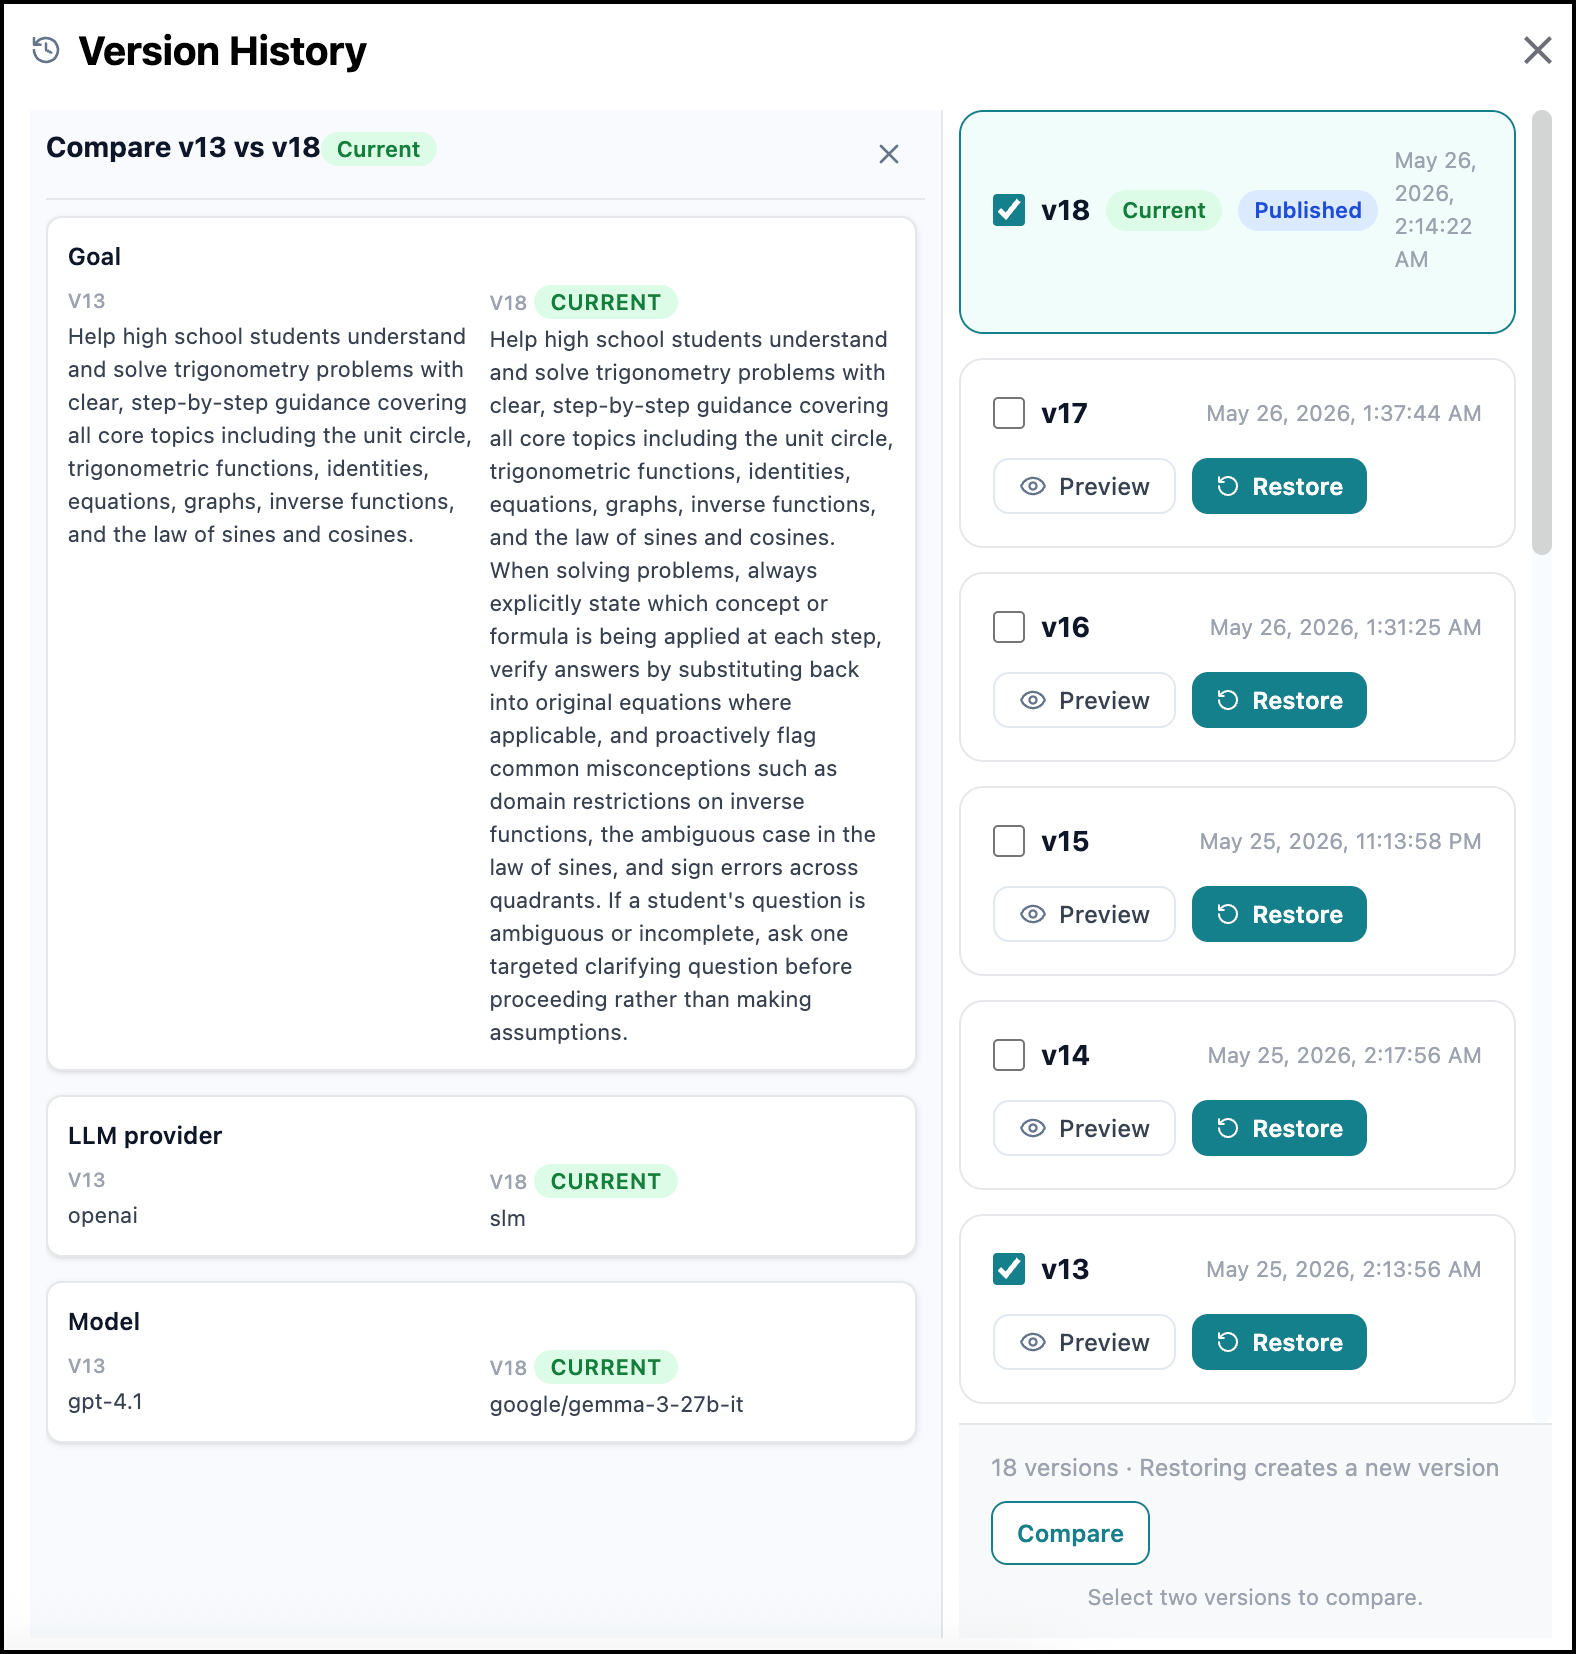
To restore a version of an agent:
On the Version History page, click Restore on the desired version.
On the Update Agent page while viewing a previous version, click Restore this version.

Enter a summary of the revision and then click Save.
Removing an Agent
You can remove agents from the Agent SDK page.
To remove an agent:
Click the Ellipsis
icon on the agent card.Click Delete.
A confirmation dialog box opens.
Type DELETE (in capital letters) in the confirmation box.
Click Delete.
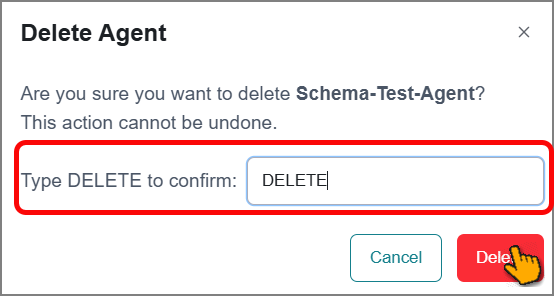
A success message appears, and the agent is removed from the page.
Creating Apps
An app is a user-friendly application (interface) for viewing AI results. It controls how your agent's outputs are displayed after completing a task, making sure the information is presented clearly, consistently, and in an easy-to-understand format.
Notice
Agents use these apps on the agent chat page to display results whenever they are tasked with executing a specific action.
To create an application interface, you have two options:

Create Agent App - This option helps to build an application interface and assign it to a specific agent.
Create Custom App - This option lets you build an application interface or dashboard independently, without linking it to a specific agent, and export the App for third-party implementation.
Note
The platform currently supports dashboard creation for structured data only.
Create an Agent App to build an interface linked to a specific agent that runs within the Business AI Cloud. Create a Custom App for greater flexibility, as it's built independently, and you can export the source code to deploy it or integrate it into a third-party environment.
Creating an Agent App
The platform lets you build an application interface and assign it to a specific agent.
Click Create App and then select Create Agent App.
The Create New App window opens.
Enter a name for your app in the text field.
Select the agent from the dropdown to tag them.
Click Create.
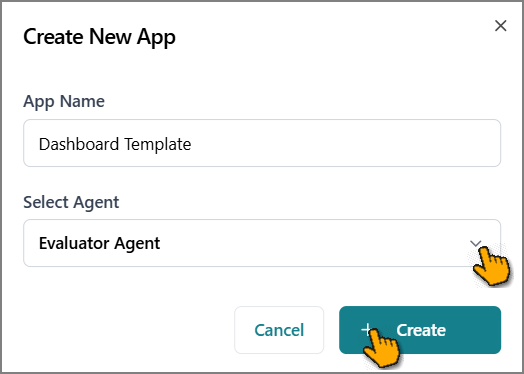
The App Builder page opens. It provides an AI-assisted development environment for generating agent applications or dashboards. The interface consists of:
AI Assistant Panel (Left) - Input area for natural language design instructions.
Application Preview Panel (Right) - Real-time display of the application interface being developed.
Note
The App Builder's behavior depends on your agent's current configuration. If the selected agent already has an application interface configured, the App Builder will open that existing interface automatically, allowing you to modify it. If your agent doesn't have a configured app yet, the AI assistant will automatically generate a default application view to help you get started with your design.
Enter your application requirement using natural language. Alternatively, select the predefined questions on the panel that suit your requirement.
Click the Attach
icon to upload reference files, if required. The AI analyzes these files to understand your requirements and generate appropriate UI components.Supported File Types - Documents (txt, pdf, csv, json) and images. ZIP files are automatically extracted during upload.
Upload Limits - 10MB maximum per file, up to 10 files per upload.
Press Enter or click the Submit
icon.The BAIC Copilot analyzes your input and updates the application preview.
Click Refresh to manually reload the preview panel if needed.
Click Deploy.
It opens the application in a new browser window for a full preview.
Creating a Custom App
The platform lets you build an application or dashboard interface independently using BAIC Copilot, without linking it to a specific agent. This gives you the flexibility to copy the source code and implement it directly in your own environment.
Click the Create App and then select Create Custom App.
The App Gallery page opens and displays all existing custom apps.
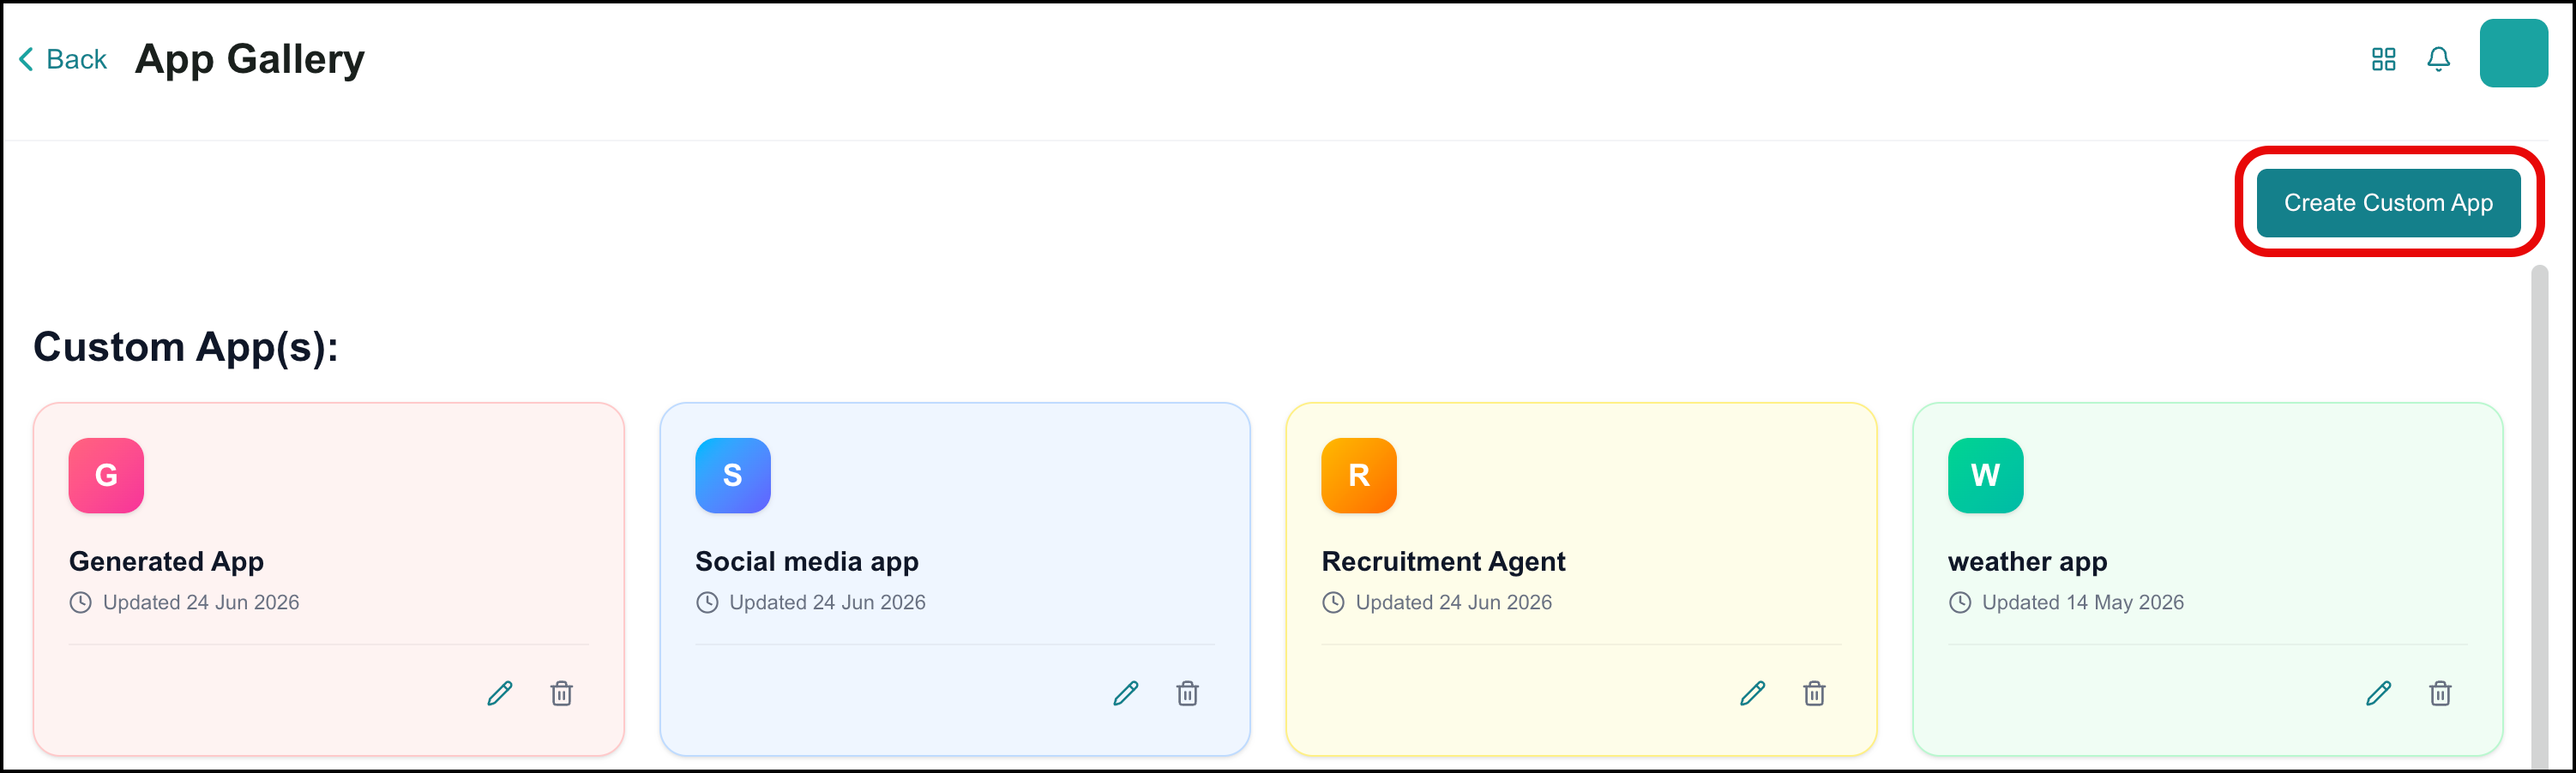
Click Create Custom App.
The Create Custom App window opens.
Enter the app name in the text field.
Click Create.
The App Builder page opens. It provides an AI-assisted development environment for generating Applications or Dashboards. The interface consists of:
AI Assistant Panel (Left) - Input area for natural language design instructions.
Application Preview Panel (Right) - Real-time display of the application interface being developed.
Enter your application requirement using natural language. Alternatively, select the predefined questions on the panel that suit your requirement.
Enter your Dashboard requirement for a Knowledge Base or a Knowledge Cluster.
Click the Attach
icon to upload reference files, if required. The AI analyzes these files to understand your requirements and generate appropriate UI components.Supported File Types - Documents (txt, pdf, csv, json) and images. ZIP files are automatically extracted during upload.
Upload Limits - 10MB maximum per file, up to 10 files per upload.
Press Enter or click the Submit
icon.The BAIC Copilot analyzes your input and updates the application preview.
Click Refresh to manually reload the preview panel if needed.
Click Show Code.
The Code panel opens on the right, displaying generated code.
Select Java or HTML from the dropdown to view the relevant data.
Click Copy to copy the displayed code to the clipboard.
Click Hide Code to close the code panel.
Exporting an App
The platform allows you to export apps built using its AI capabilities for deployment and integration in external environments.
The following export methods are supported:
Download the Code
Publish to GitHub
Generate Public Link
Download the Code
Export your app's source HTML code as a downloadable package for local storage, custom deployment, or further development outside the platform.
Click the Ellipsis
icon.Select Download Code.
The code is automatically downloaded to your local system as a ZIP file containing both Java and HTML formats.
Publish to GitHub
Publish your app (HTML) directly to a GitHub repository to enable version control, collaborative development, and streamlined integration with external development workflows.
Click the Ellipsis
icon.Select Publish to GitHub.
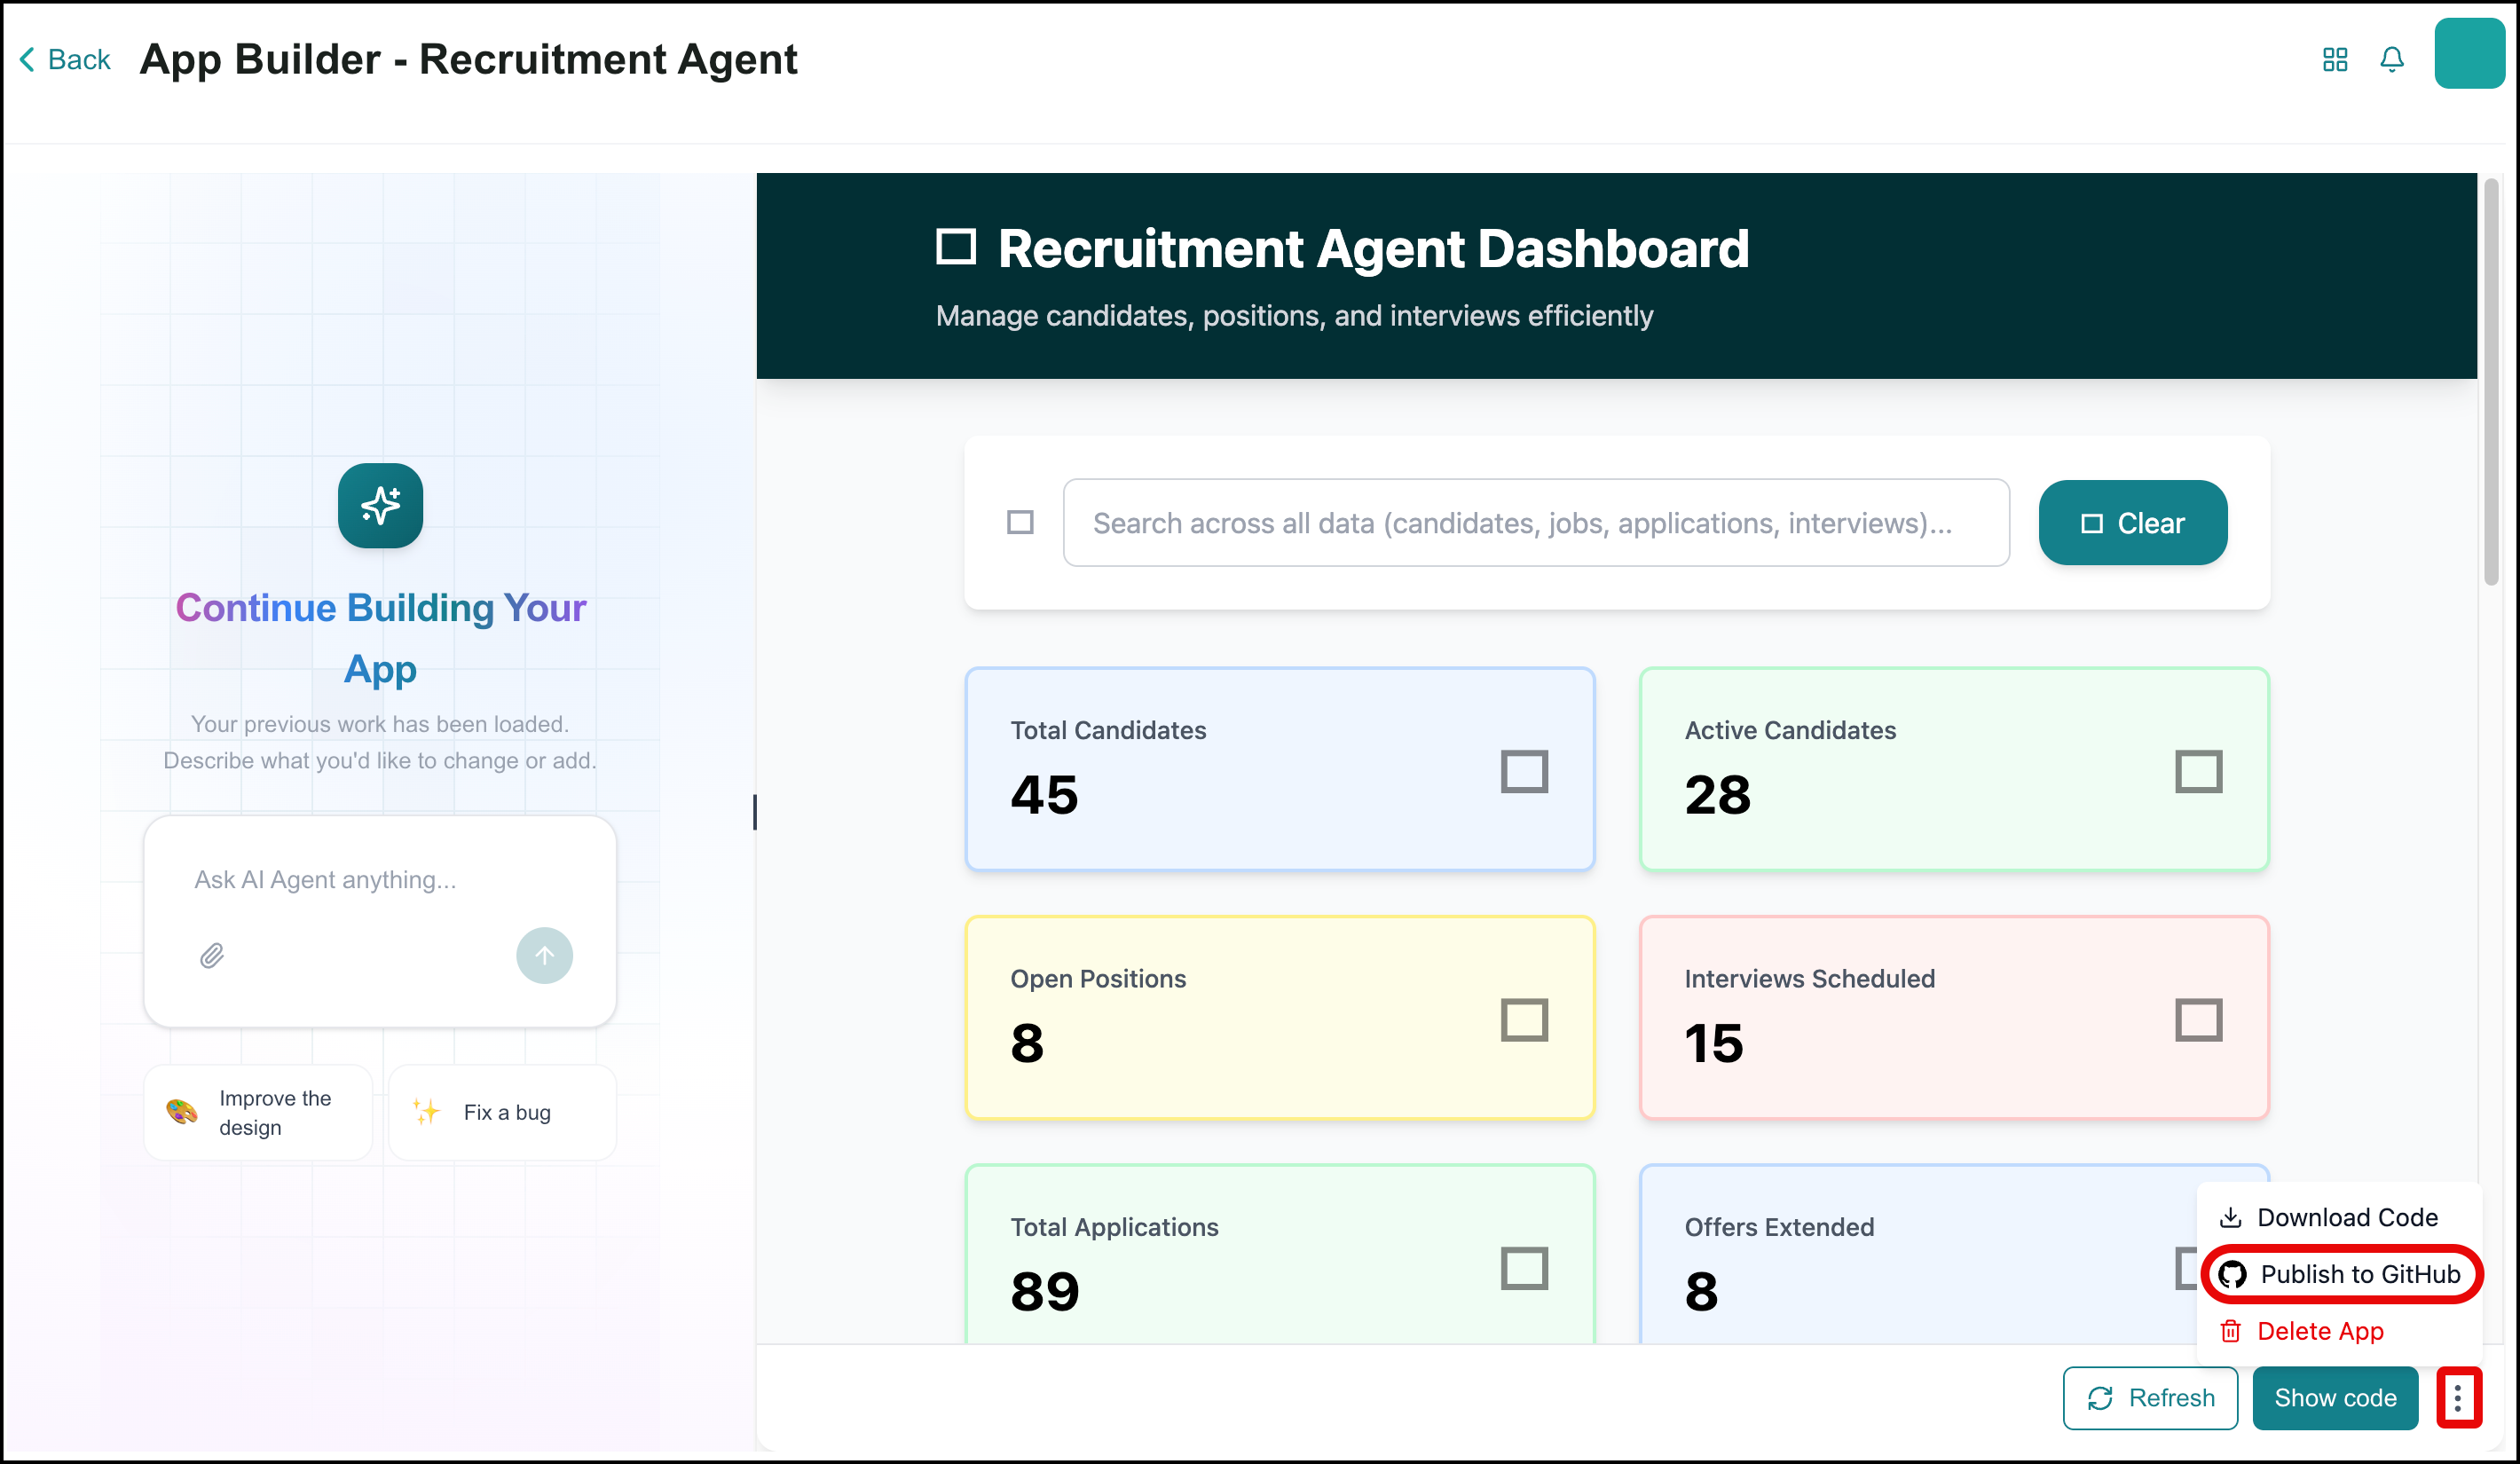
The Publish to GitHub window opens.
Click the Info
icon to view instructions for generating a GitHub personal access token.Copy the personal access token from GitHub.
Paste the GitHub personal access token on the platform.
Click Save Token to establish a connection to GitHub.
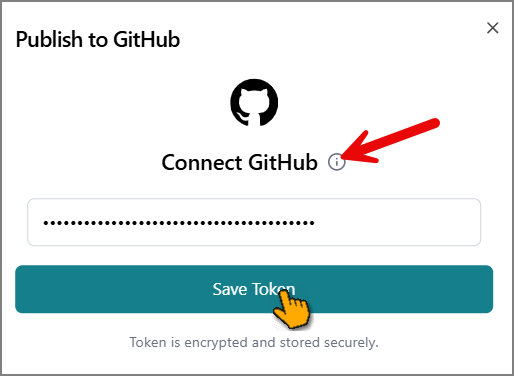
If the connection is successful, a new window opens to proceed with publishing.
If the connection fails, an error is displayed. Re-enter a valid token and try again.
To update an existing token, click Edit Token and enter the new value.
Paste the new GitHub personal access token.
Click Save Token.
Enter a unique Repository Name with no spaces.
Click Publish to upload your code to the repository.
The success message is displayed.
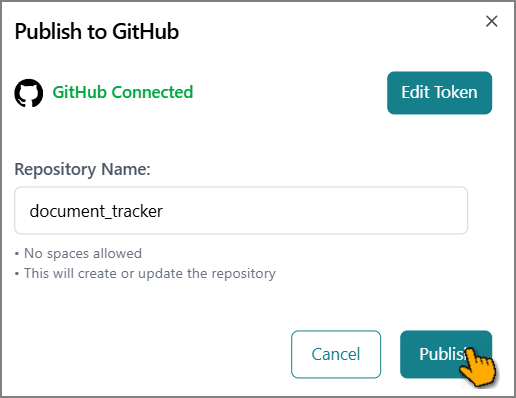
The platform checks GitHub for the specified repository name, creating a new repository if it does not exist, or updating the existing one if it does.
Generate a Public Link
The platform lets you generate a public URL for your application, so you can share it with others without requiring them to log in to Business AI Cloud. You can set an expiration window for the link and revoke it at any time to control access.
Click the Ellipsis
icon.Click Share.
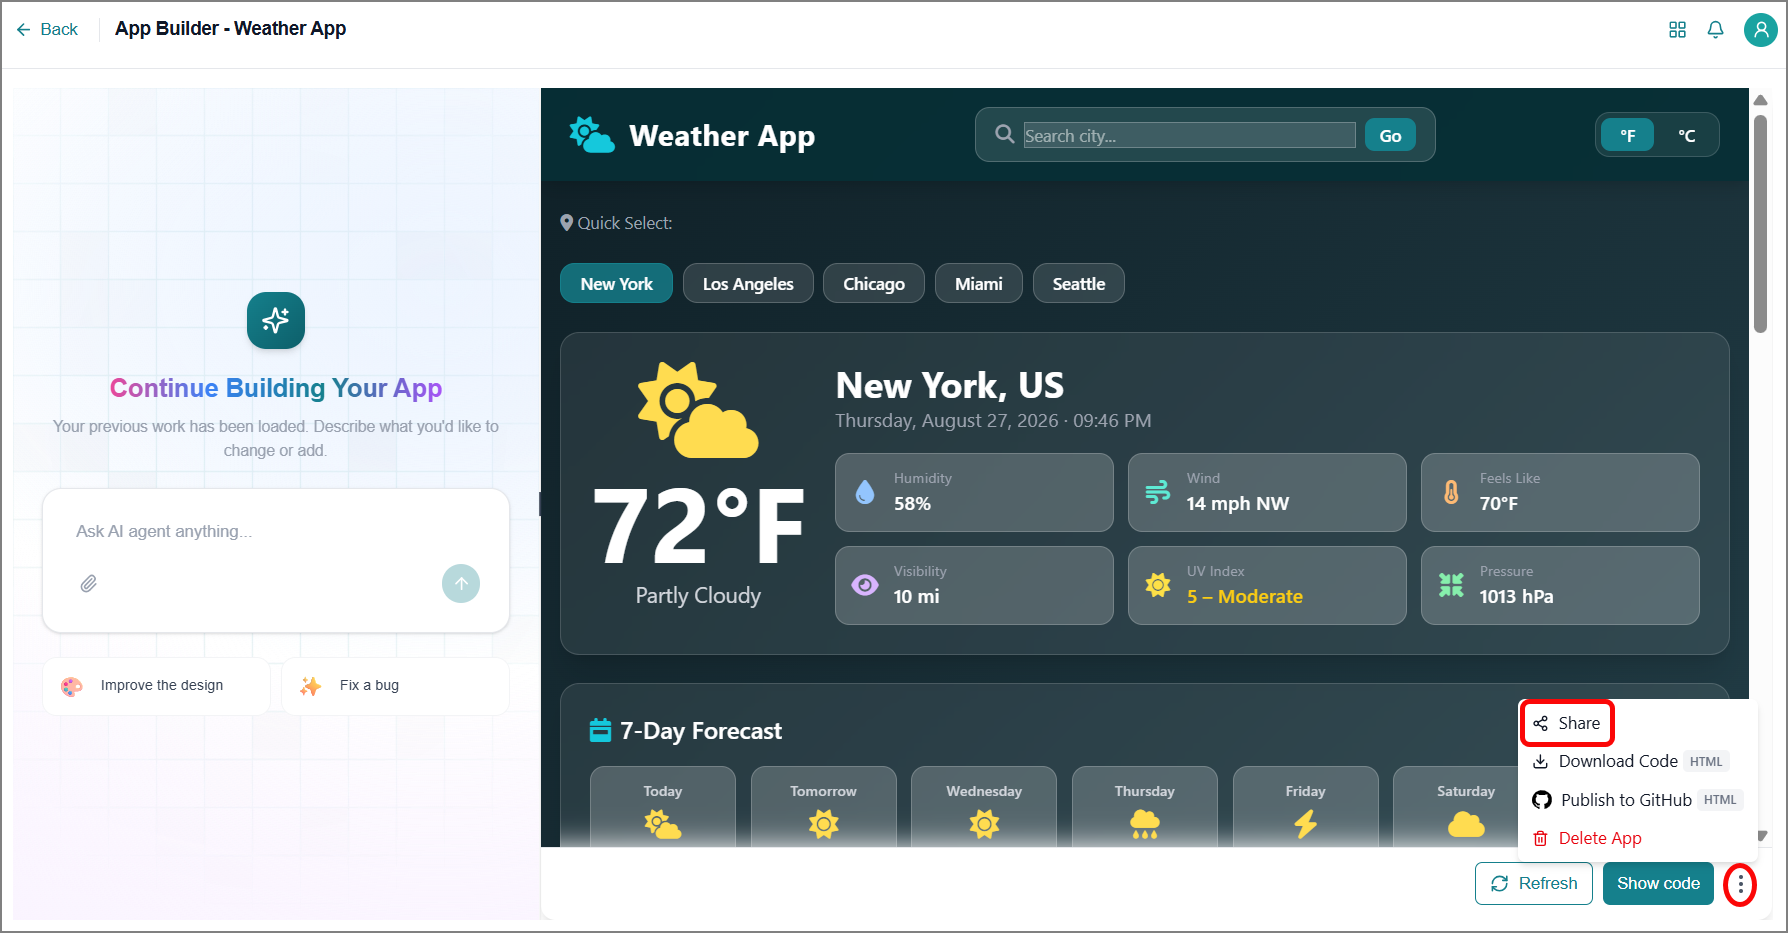
The Generate Public URL window opens.
Choose the link's validity period from the dropdown, or enter a custom duration manually.
Click Generate Link.
The platform creates a public URL for the application.
Select Copy to copy the generated link to your clipboard.
Click Done to close the window.
Note
To cancel an active public link and generate a new one, click Revoke & Create New. This immediately invalidates the previous link before a new one is created.
Modifying the Custom App
If you need to update an existing custom app, you can reopen it in the app builder and use the AI assistant to make changes quickly.
To modify an existing app:
Click Create App and then select Create Custom App.
The App Gallery page opens and displays all existing custom apps.
Click the Edit (
 ) icon on the custom app you want to update.
The App Builder page opens.
Use the AI assistant to describe and apply the changes you need.
Deleting a Custom App
To delete a custom app:
Click Create App and then select Create Custom App.
The App Gallery page opens and displays all existing custom apps.
Click the Delete (
 ) icon on the custom app you want to delete.
Click Delete to confirm.