RAG Evaluation
RAG Evaluation is the process of testing and measuring how well a knowledge base performs with its paired SLM. The platform compares SLM-generated responses against your ground truth data, assessing whether they are accurate, contextually relevant, and grounded in the knowledge base. Use these evaluation results to validate the model's readiness before deploying the knowledge base to production.
The platform lets you test your KB using different configurations, including how content is processed, stored, and retrieved. This flexible approach gives you the freedom to experiment, compare results, and fine-tune your setup until it performs exactly the way your business needs.
Key Capabilities
Interactive Evaluation Dashboard - Monitor and analyze KBs' performance metrics using a user-friendly interface with advanced filtering and search capabilities.
Ground Truth Validation - Auto-generate or upload question–answer pairs or SQL queries to benchmark the language model’s responses against known correct outputs and assess factual accuracy.
KB Search Model Comparison - Run multiple search methods side by side and identify which one performs best for your KB.
Human-in-the-Loop Review - Incorporate manual review workflows to enable domain experts to score, refine, or approve responses for higher accuracy and trust.
Guardrails Enforcement - Apply guardrails to enforce content safety, tone consistency, and business-specific constraints during inference. Guardrails help ensure that your inputs and AI-generated outputs comply with and align with company guidelines.
Model Experimentation - Enable real-time testing of SLM outputs using actual queries, helping teams measure response accuracy and make ongoing improvements to model performance.
To test a KB's RAG pipeline:
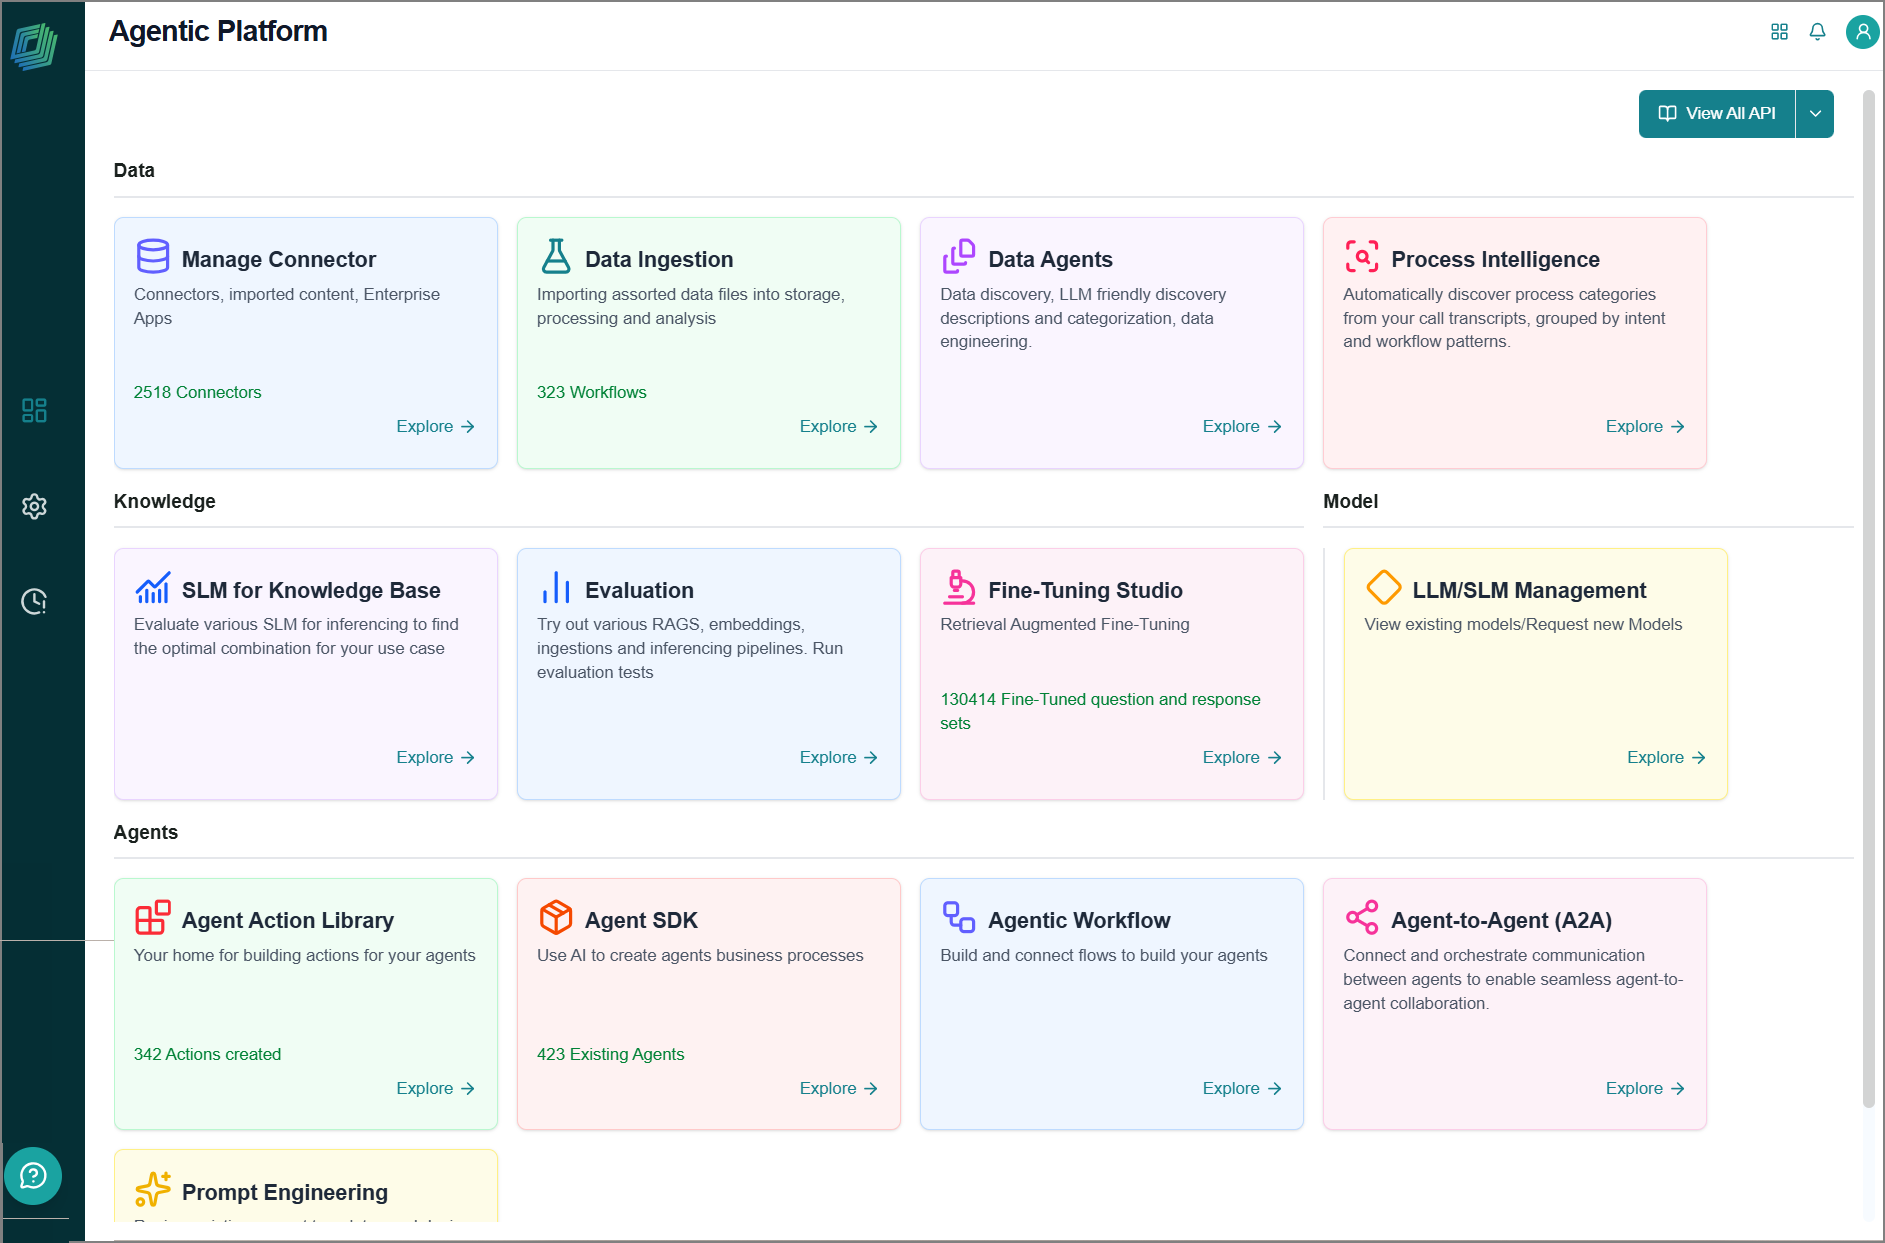
Go to the home page > Knowledge > Evaluation.
The Evaluation page opens and displays all KBs, organized by category for easy navigation and selection.
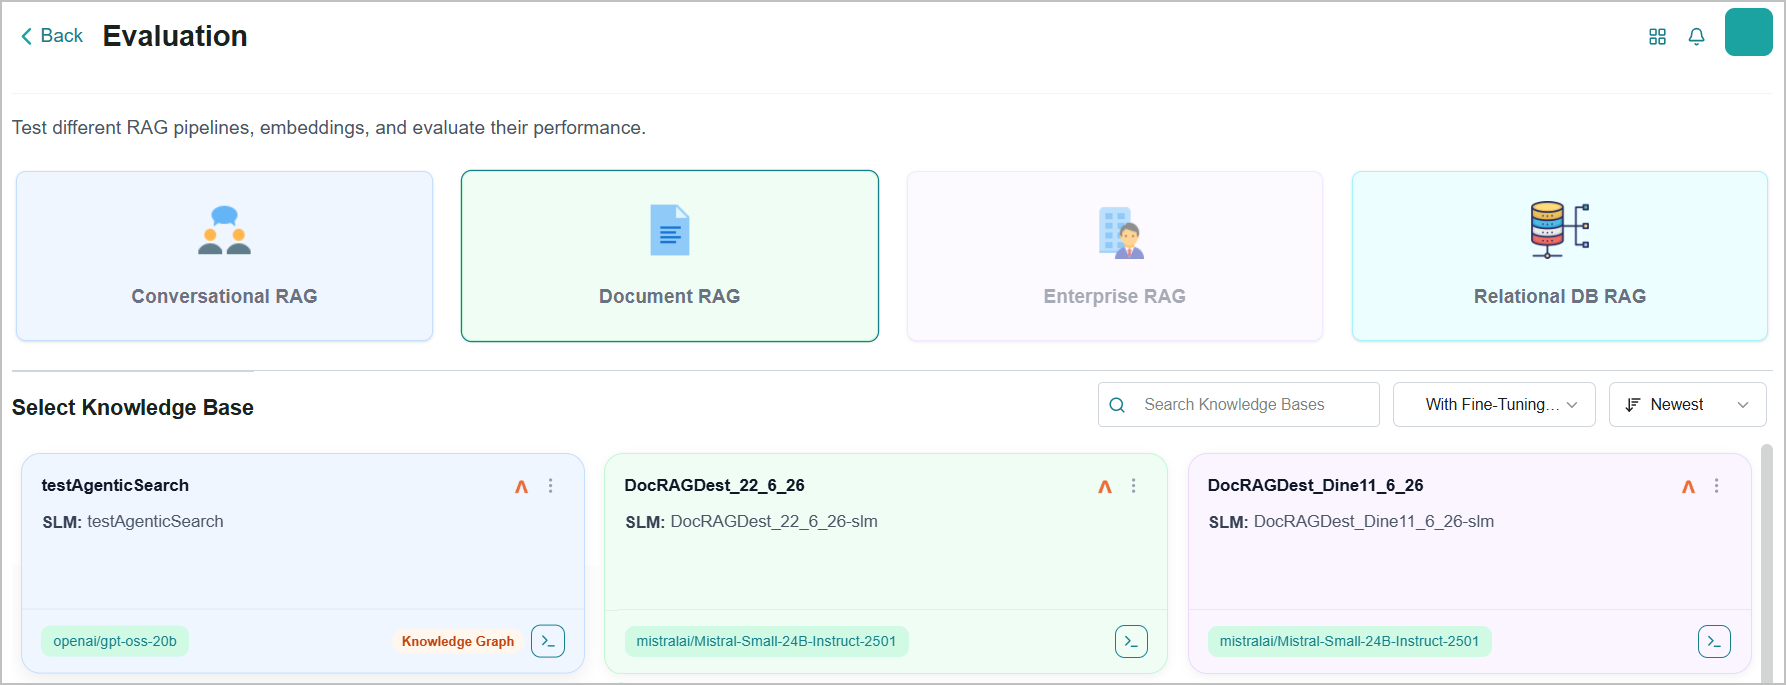
Select a category to filter your existing knowledge bases:
Conversational RAG - Under development, coming soon!
Document RAG
Enterprise RAG - Under development, coming soon!
Relational DB RAG
The associated KBs are listed below.
Apply one or more of the following filters to locate a specific KB:
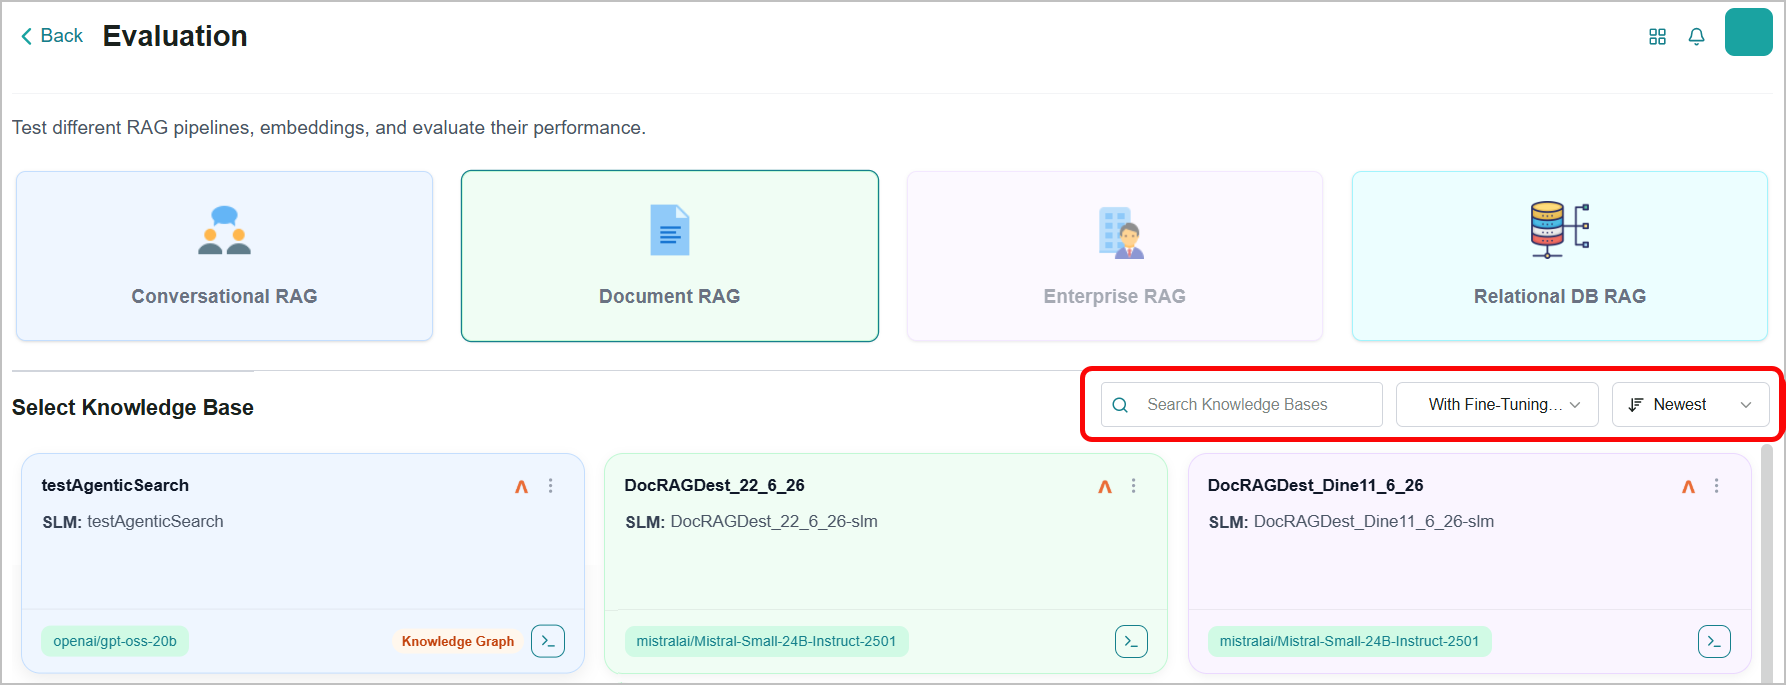
Search box - Enter a KB name or keyword to perform a text-based search across the list.
Fine-tuning Data dropdown - Filter KBs by fine-tuning data availability status.
Sort Order - Rearrange the KB list by the dropdown category.
If required, you can update the KB details. Refer to Managing a Knowledge Base for more information.
From the filtered card view, select the KB.
The next page opens with the following tabs:
You can switch between the tabs to view test results.
The platform automatically selects the following evaluation methods based on your data type, such as structured, semi-structured, or unstructured, to accurately assess model output quality:
Accuracy - Is the factual content correct?
Verifies whether factual claims in the response are correct based on trusted source material. Inaccuracies may include incorrect dates, figures, entities, or relationships.
Answer Completeness - Does the response fully address the user's question, including sub-questions?
Evaluates whether the answer covers all required elements. Partial or fragmented answers can lead to misunderstanding or follow-up questions.
Answer Relevance - Does the response directly address the user's question?
Checks how well the answer stays focused on the user's actual question. A relevant answer avoids unnecessary information and makes sure the main question is clearly addressed.
Context Precision - Are the most relevant data ranked highest in retrieval?
Ensures the quality of the retrieval ranking by measuring whether data that are actually useful for answering the query appear at the top of the retrieved results.
Context Recall - Are all important contextual cues from the source accurately represented?
Ensures that critical information from the retrieved context is included and correctly reflected in the response.
Faithfulness - Are the statements directly supported by the retrieved data?
Evaluates how closely the response aligns with the source content. Excessive paraphrasing, blending, or abstraction may reduce traceability and interpretability.
Semantic Similarity - How closely does the generated answer align with the intended meaning of the ground truth answers?
Measures whether the response conveys the same concepts and information as the expected answer, even if the exact wording differs.
Managing a Knowledge Base
You can manage a few aspects of your KBs from this page, ensuring efficient utilization and optimal performance across your platform.
Document
To edit a Document RAG:
Click the Ellipsis
 icon on the KB to view more options.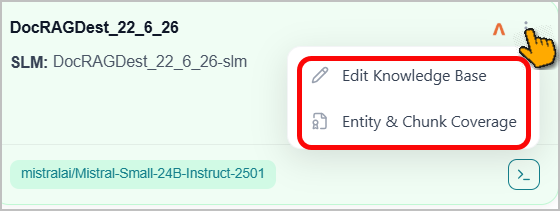
Click Edit Knowledge Base.
The Edit Knowledge Base window opens.
Modify the KB name and description as needed.
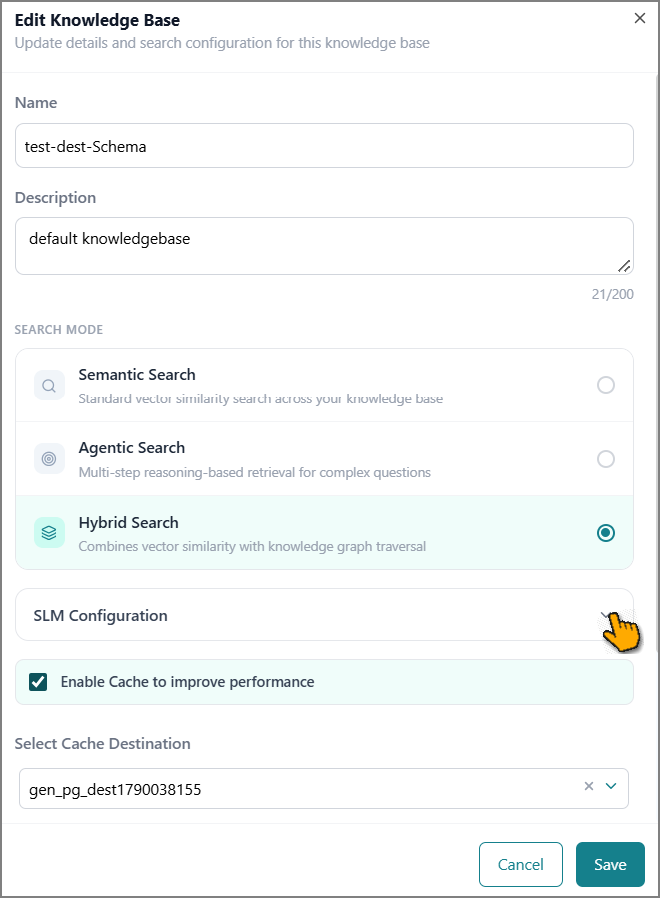
Select a Search Mode to control how AI agents retrieve information from this KB:
Semantic Search - The default search mode. Agents search for content based on meaning and context. Two optional enhancements are available with this mode:
Apply Entities - Enables agents to use global entities defined during Data Preparation for this source.
Agentic Search - Advanced search mode for complex questions. Instead of a single lookup, agents reason through multiple steps to build an answer. Select this setting to allow agents to use the Knowledge Graph for the KB.
Note
When you enable Agentic Search, a Knowledge Graph text appears on the KB card, indicating that the KB is configured for Knowledge Graph-driven search.
Hybrid Search - A smarter way to search that narrows down the right files first, then looks inside them for the answer. Agents use the Knowledge Graph to identify the files most relevant to your question, then search only within those files rather than across the entire knowledge base.
Important
The Agentic Search and Hybrid Search options are enabled only when the Knowledge Graph is created for the KB in the data workflow.
Click SLM Configuration to expand.
The default values are already available; you can update them if needed.
Tip
Use the info
 icon to view more information about the settings.
Select the checkbox to save Q&A caches and improve KB performance.
Select the same or a different vector destination from the dropdown to store the cache.
Click Save to apply the changes.
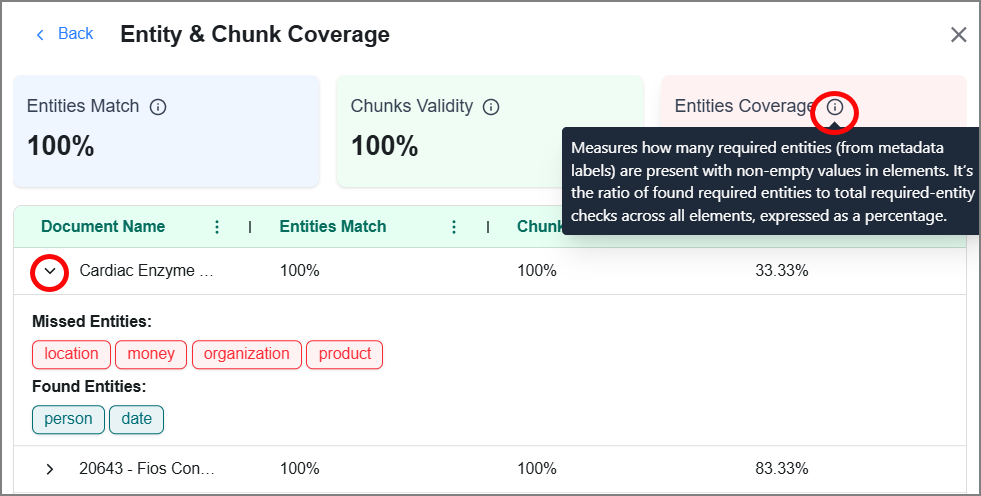
To view global entities and chunks that match the files in the Document RAG KB:
Click the Ellipsis
icon on the KB to view more options.Click Entity & Chunk Coverage to view the data quality metrics on the right panel.
Click
to view information about insight measurement methodology.Click > to expand the document and reveal the complete entity breakdown.
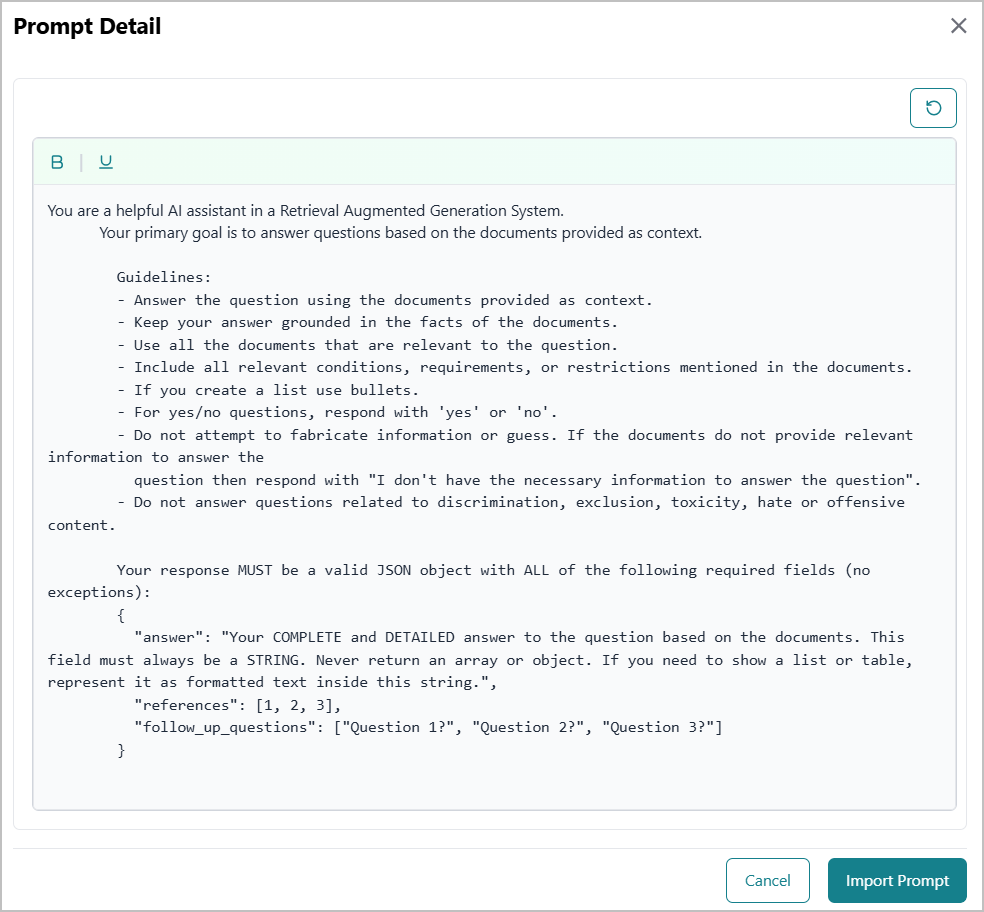
To review the Document RAG KB prompt, click the Prompt  icon on the KB card.
The Prompt Detail page opens, displaying the current prompt.
 |
To update the prompt, refer to Updating a Prompt for more information.
Viewing a Knowledge Graph
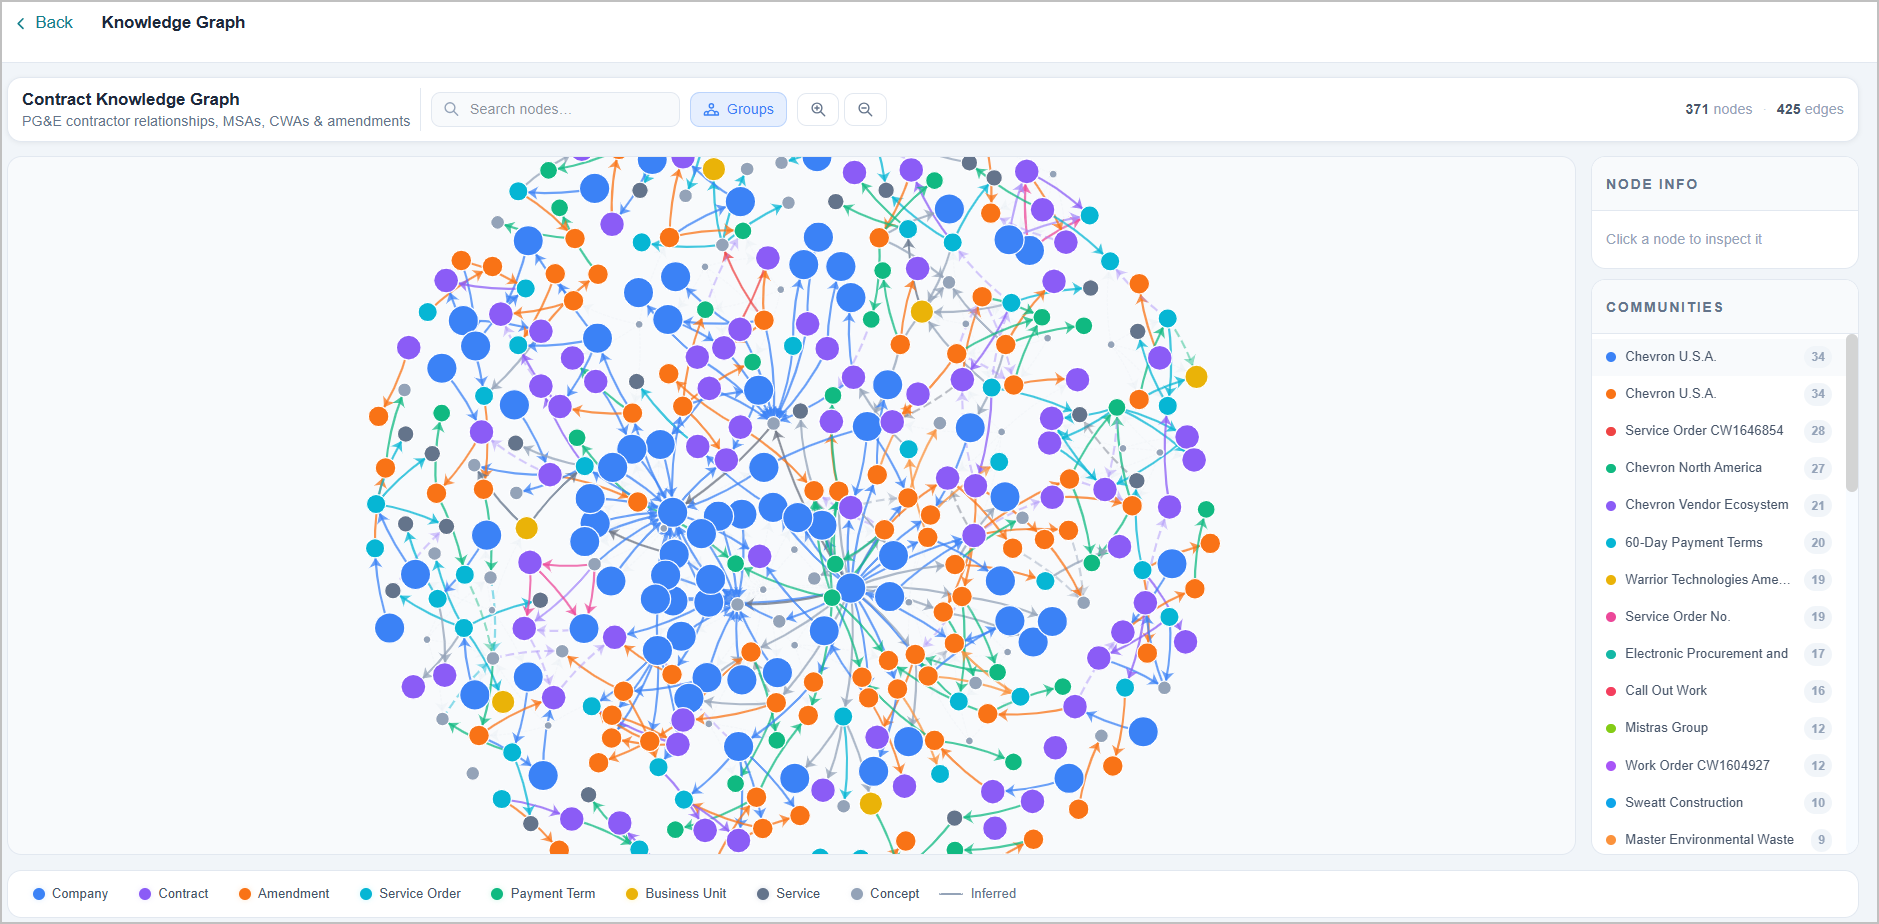
The Knowledge Graph gives you a visual map of how information in your knowledge base is connected. You can use it to explore relationships between topics, entities, and data points that the platform has automatically identified.
To view the KB Knowledge Graph:
Important
The Knowledge Graph option is available only when Agentic Search is enabled for the KB. To enable Agentic Search, refer to Modifying a Knowledge Base.
Click the Knowledge Graph option on the specific KB.
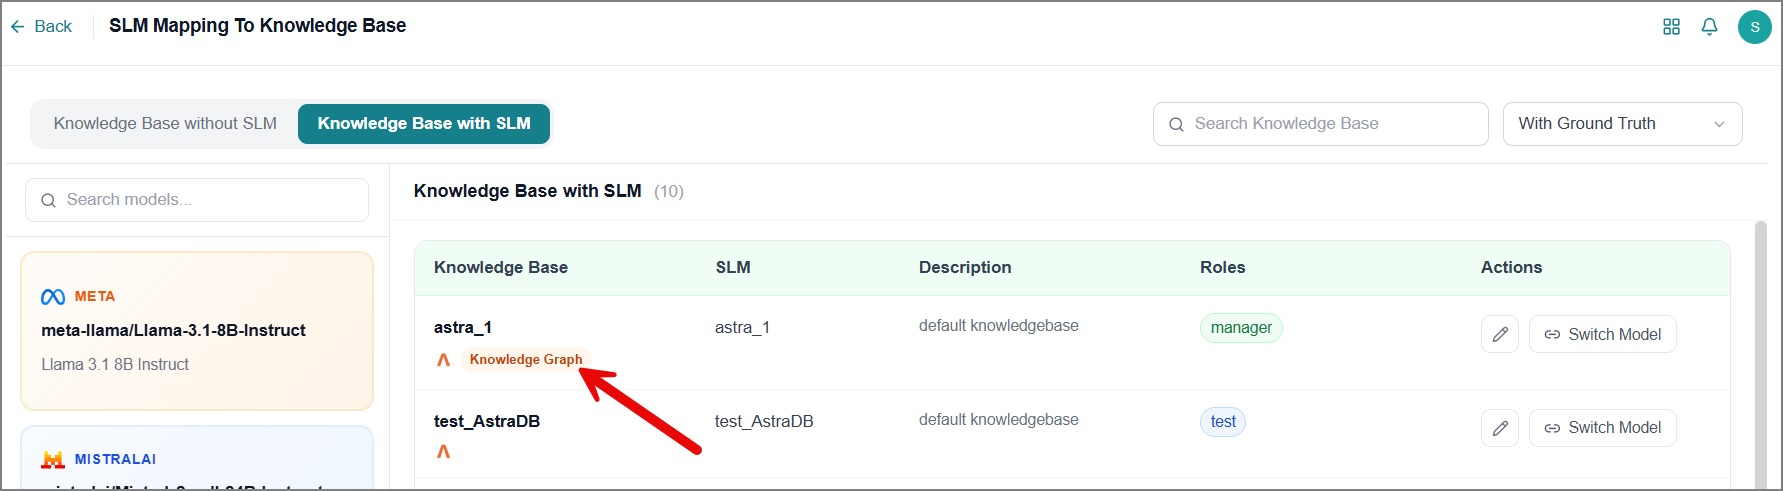
The Knowledge Graph page opens.
Relational DB
To manage a knowledge base in the Relational DB:
Click the Ellipsis
icon on the KB to view more options.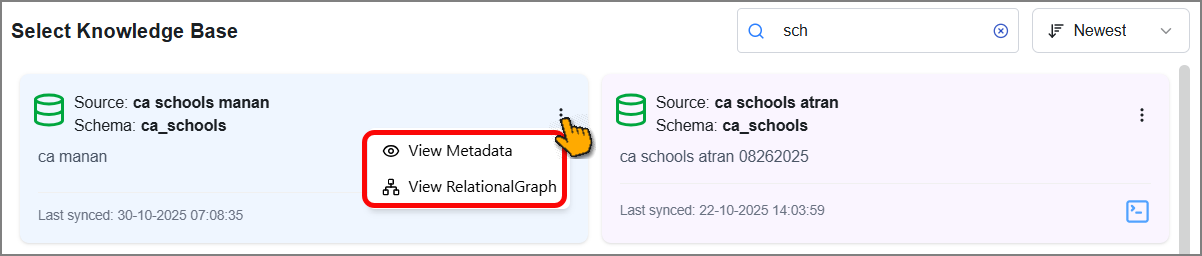
Click View Metadata or View Relational Graph to view more information about the KB's metadata.
Running an Evaluation
This feature enables you to evaluate your AI system’s performance by comparing your ground-truth Q&A pairs against responses generated by your SLM across multiple sources, including Vector Knowledge Bases, Knowledge Graphs, and Augmented Answer pipelines. Leveraging the Business AI Cloud evaluation framework, the platform systematically analyzes all response variants and presents them side-by-side, along with their matching scores. This comparative view allows you to quickly identify inconsistencies, measure accuracy, and assess overall answer quality with clarity and confidence.
Ground Truth Data
The Evaluation page helps you measure how well your Knowledge Base answers questions. It does this by comparing a set of reference questions and their expected answers, called the ground truth, with the responses the paired SLM generates for the same questions.
Important
Without ground truth data, the evaluation cannot run. Ground truth is the reference standard that the platform uses to score model responses.
Ground truth data can be created in two ways:
Manually - You write the questions and correct answers yourself.
Automatically - The platform's AI generates ground truth for you based on your Knowledge Base content.
Importing Ground Truth Manually
Important
Before starting the evaluation process, you'll need to create ground truth samples using the default template available on the platform. You can download the template to ensure your samples are formatted correctly. Refer to Step 2 for detailed instructions on downloading the template.
Unstructured Data - Ground truth samples include benchmark questions with their verified answers.
Structured Data - Ground-truth samples include benchmark questions with verified SQL queries required to answer them, along with supporting contextual information.
Click Ground Truth.
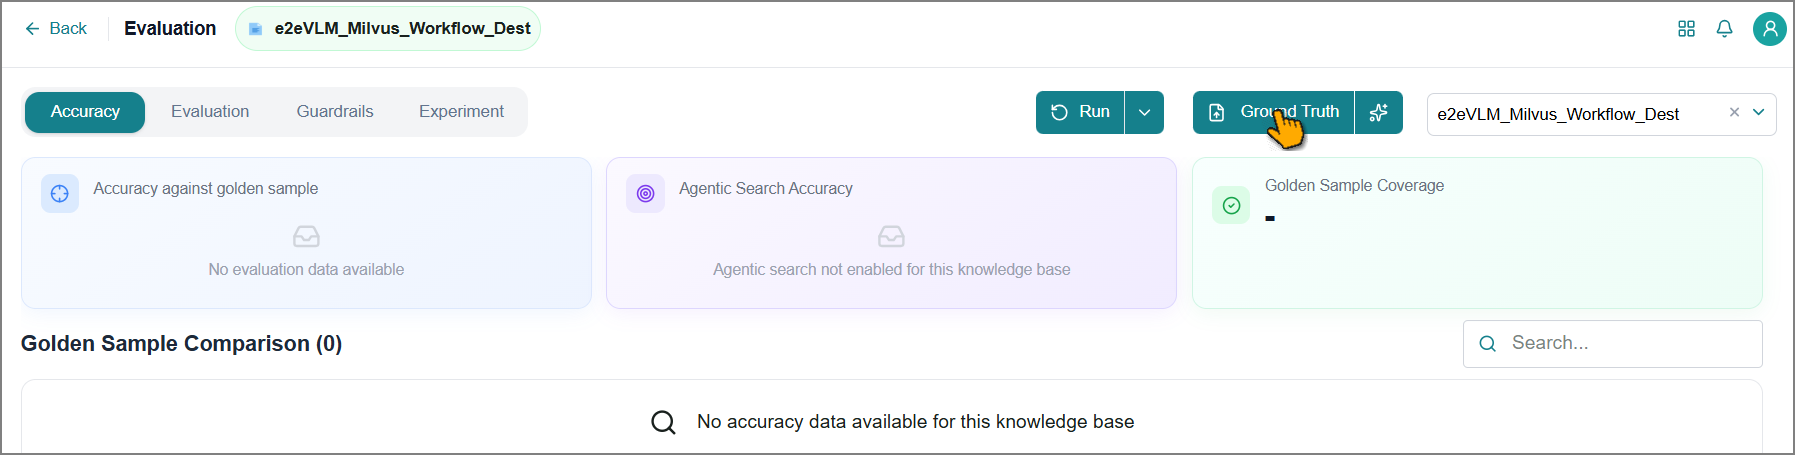
The Import Ground Truth window opens.
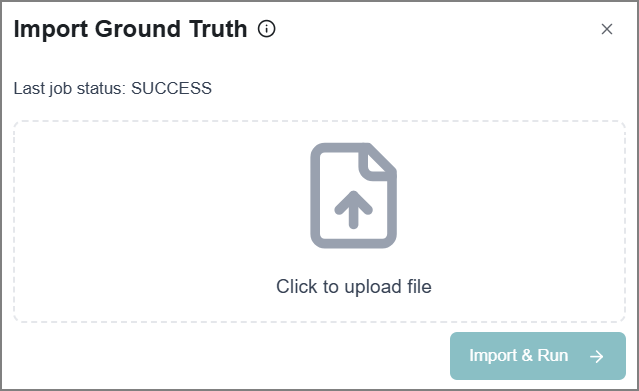
Hover over the Information
 icon and select Download Sample File to download the predefined template for creating ground truth data.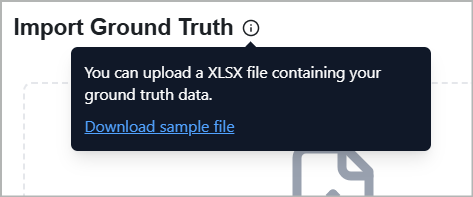
Select Click to Upload File.
Locate and select the ground truth file from your local system.
Notice
Only one XLSX or CSV file can be uploaded at a time. Uploading a new file will replace the existing one.
Click Import & Run.
The platform imports your file, initiates the evaluation process by comparing your ground-truth samples with responses generated by the default or paired SLM, and displays the evaluation results on the page.
Auto-generate Ground Truth
Instead of writing ground truth questions and answers manually, you can let the platform's AI generate them for you. The Generate Ground Truth with AI feature uses a conversational approach: you describe what you need, and the AI automatically builds the ground truth, ready for your review.
Click the Generate Ground Truth with AI
 icon next to the Ground Truth button.
The AI interaction panel opens on the left side of the page.
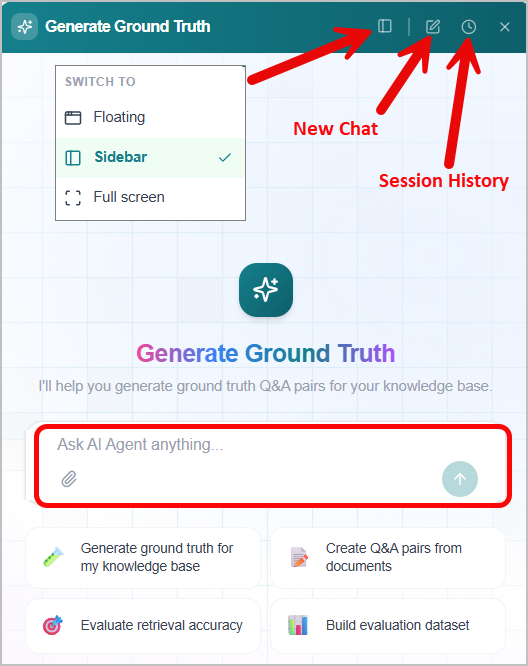
In the text box, type your question or describe the type of ground truth you want to generate.
Tip
Be as specific as possible when describing your request. The more context you provide, the more accurate the AI-generated ground truth will be.
Press Enter or click the Submit
 icon.
icon.The platform AI may ask follow-up questions to clarify your request. Once it has enough information, it automatically:
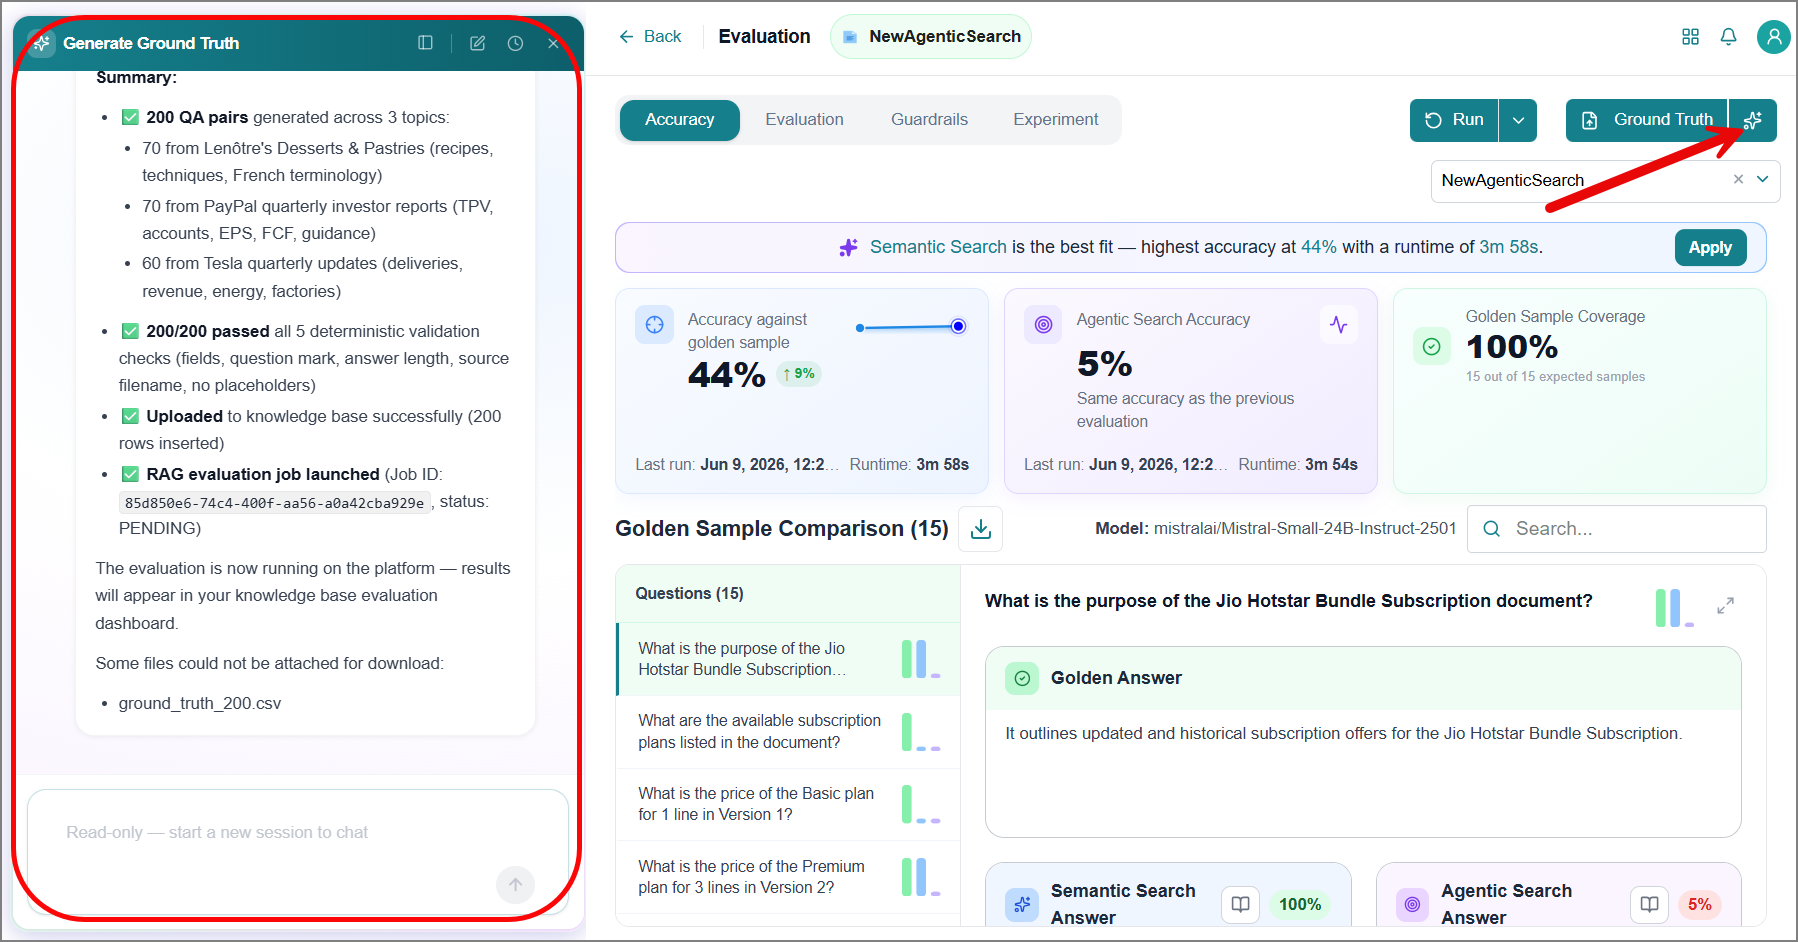
Generates ground truth Q&A pairs. You can edit the Q&A pairs using AI.
Generates a downloadable ground truth CSV file.
Uploads the ground truth and runs the evaluation against the paired SLM upon your confirmation.
Displays the answers and evaluation results for all search methods side by side: Semantic Search and Agentic Search.
Note
The Agentic Search results are displayed only when the KB was created with those options enabled during data ingestion.
Recommends the best-performing search method for your KB's use case and indicates whether that method is currently selected.
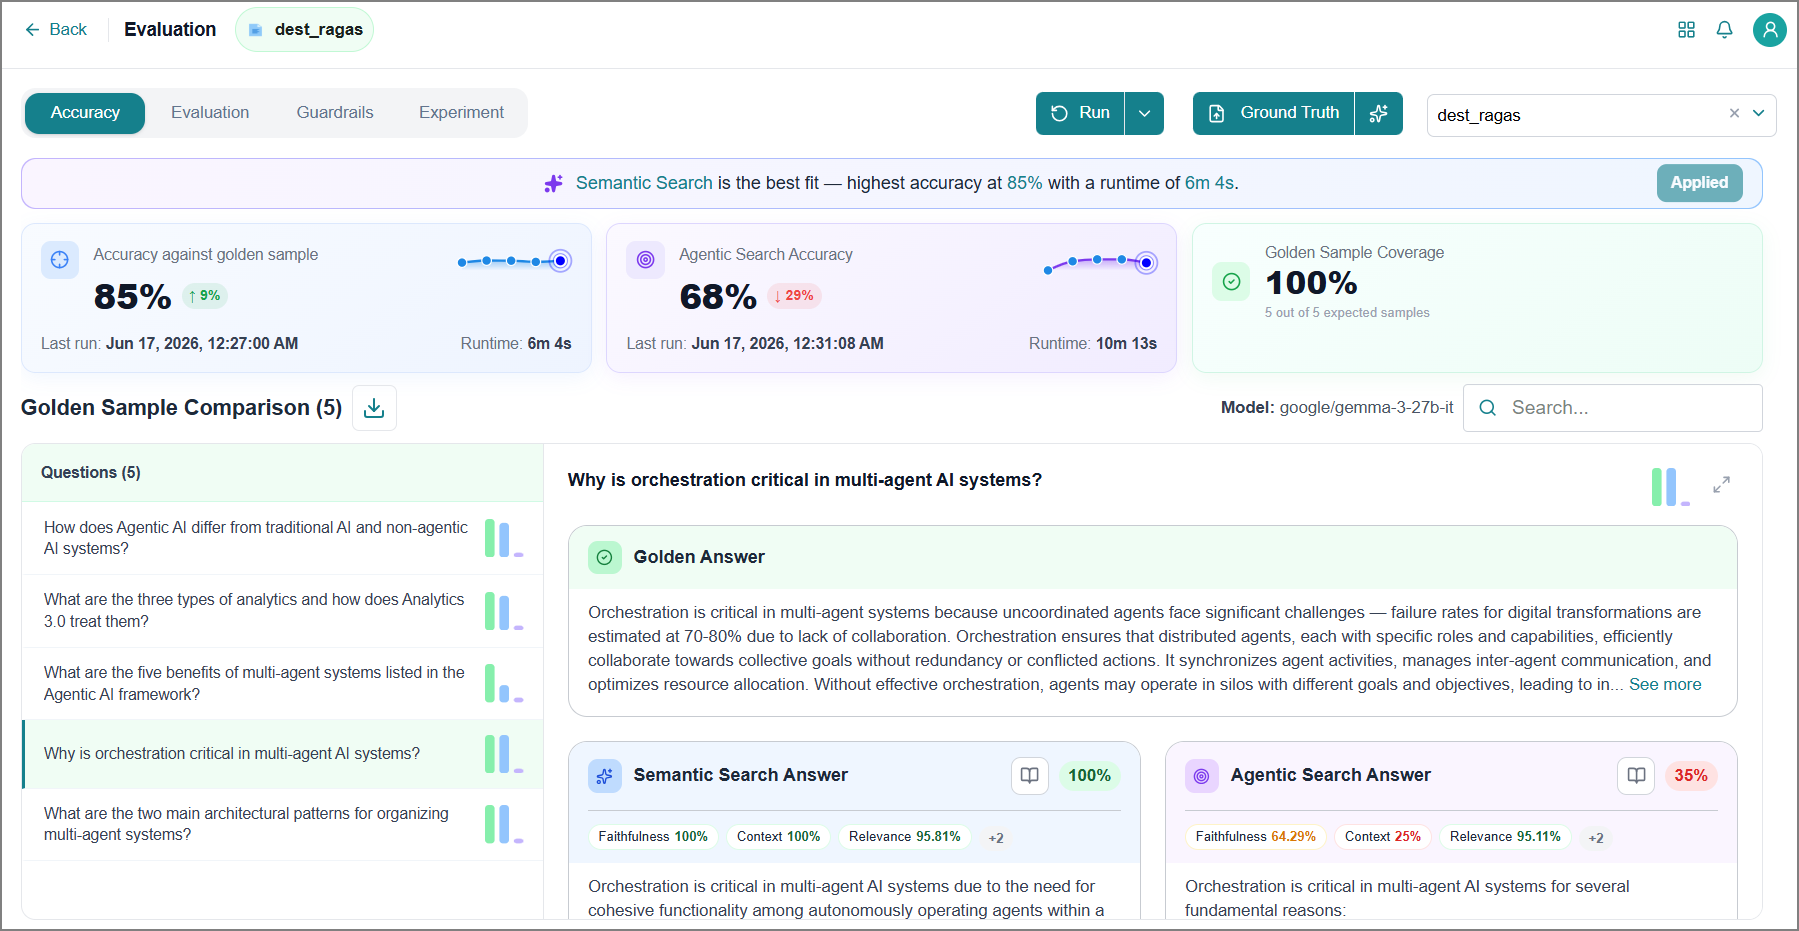
To apply the platform's recommended search method, click Apply.

Click the ground truth CSV file link in the AI interaction panel to download and review the Q&A pairs on your computer.
Note
If the generated Q&A pairs need changes, update the file and upload it manually. Refer to Upload Ground Truth Manually for more information.
Re-Running Evaluation
You can re-run the evaluation multiple times using the same or updated ground truth to refine your results. Choose to run evaluations manually or schedule them to run automatically.
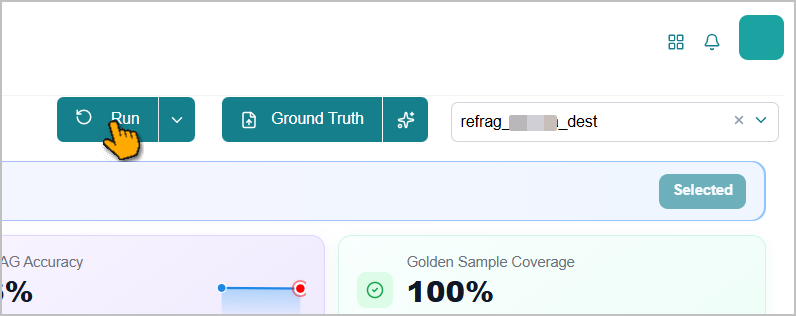
Click Run. The evaluation begins with the same ground truth and its previous score.
 |
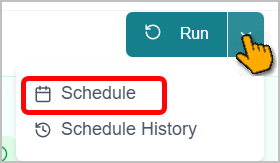
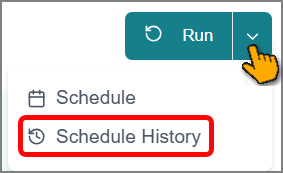
Click the dropdown next to Run.
Tip
Use the Schedules History option to view a complete list of schedulers and their execution details.
Click Schedule.
The Schedule window opens.
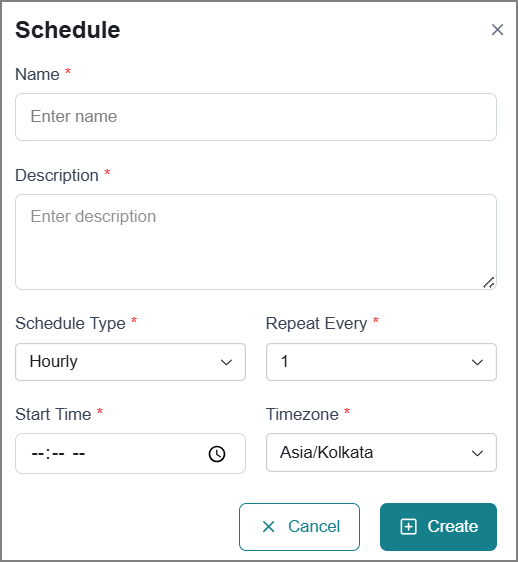
Enter relevant details in the fields.
Field
Description
Name
Enter a name for this schedule.
Description
Enter additional details about the purpose or scope of the schedule.
Schedule Type
Select how frequently the schedule should run:
Hourly
Daily
Weekly
Monthly
Yearly
Repeat Every
Specify the interval for the recurring schedule.
Hourly schedule - 1 to 23
Daily schedule - 1 to 31
Notice
If the scheduler tries to start a new job while a previous one is still running, the system will cancel the new job to avoid overlapping executions.
Days of the week
Select one or more days of the week to run the schedule.
Available for a Weekly schedule only.
Day of the Month
Select the specific date of the month to run the schedule.
Available for Monthly schedules only (1 to 30).
Day and Month
Select the specific month and date to run the schedule.
Available for Yearly schedules only.
Start Time
Set the time when the schedule should begin.
Timezone
Select your timezone to ensure the schedule runs at the correct local time.
Click Create.
The scheduled evaluation run is created, and evaluations will trigger automatically according to your selected schedule.
Note
Follow the same procedure to update the existing evaluation schedule.
Schedules History
The Schedules feature tracks the execution history of both automated and manual runs, and helps you monitor and manage your processes efficiently.
To access the Schedules page:
Click the Schedules icon in the left-side panel.
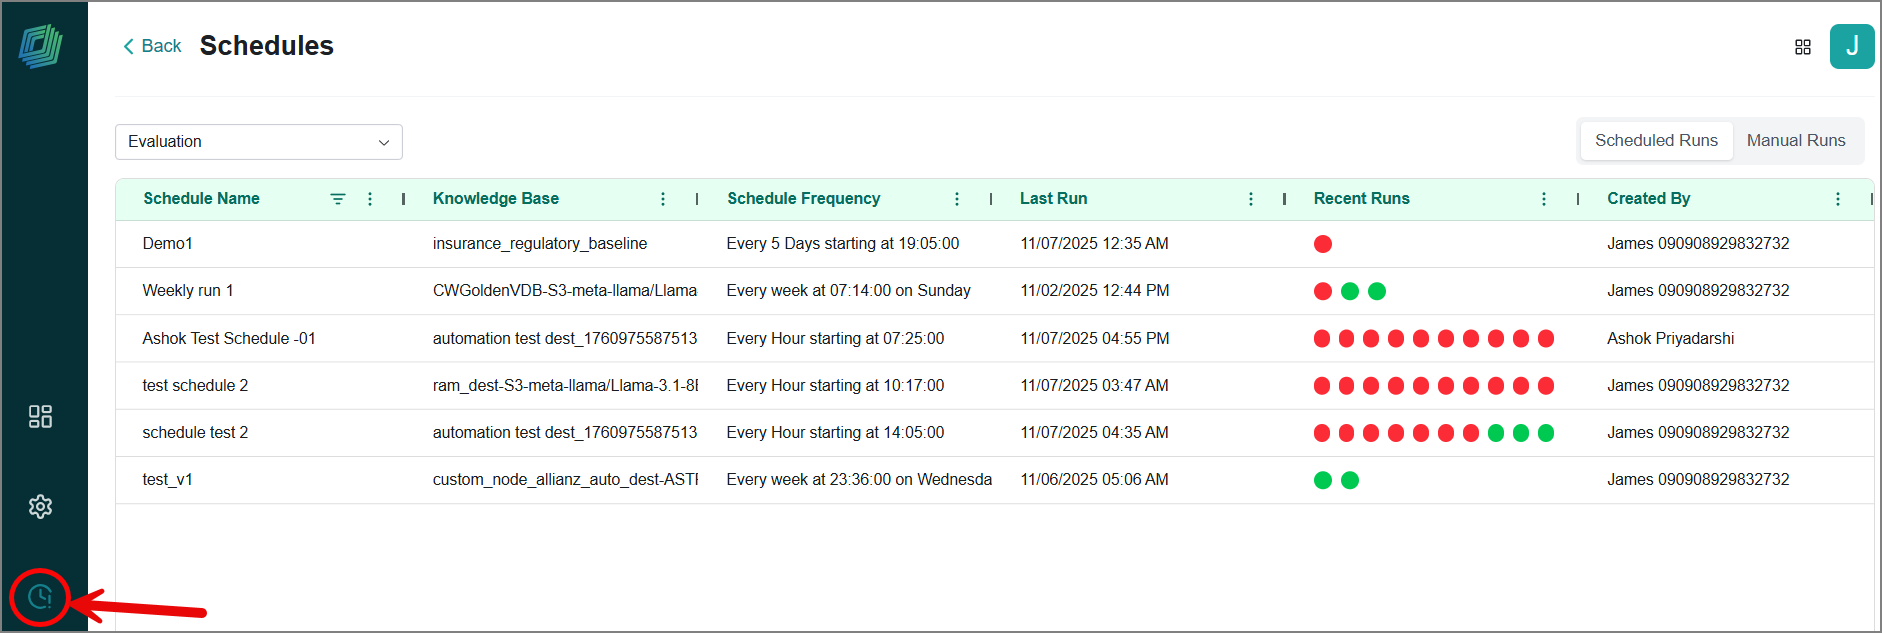
Alternatively, select the Schedule History option from the following sections:
Data Ingestion > Workflow
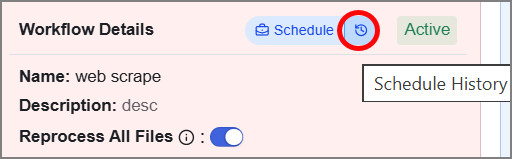
Data Agents, Evaluation, and Fine-tuning Studio
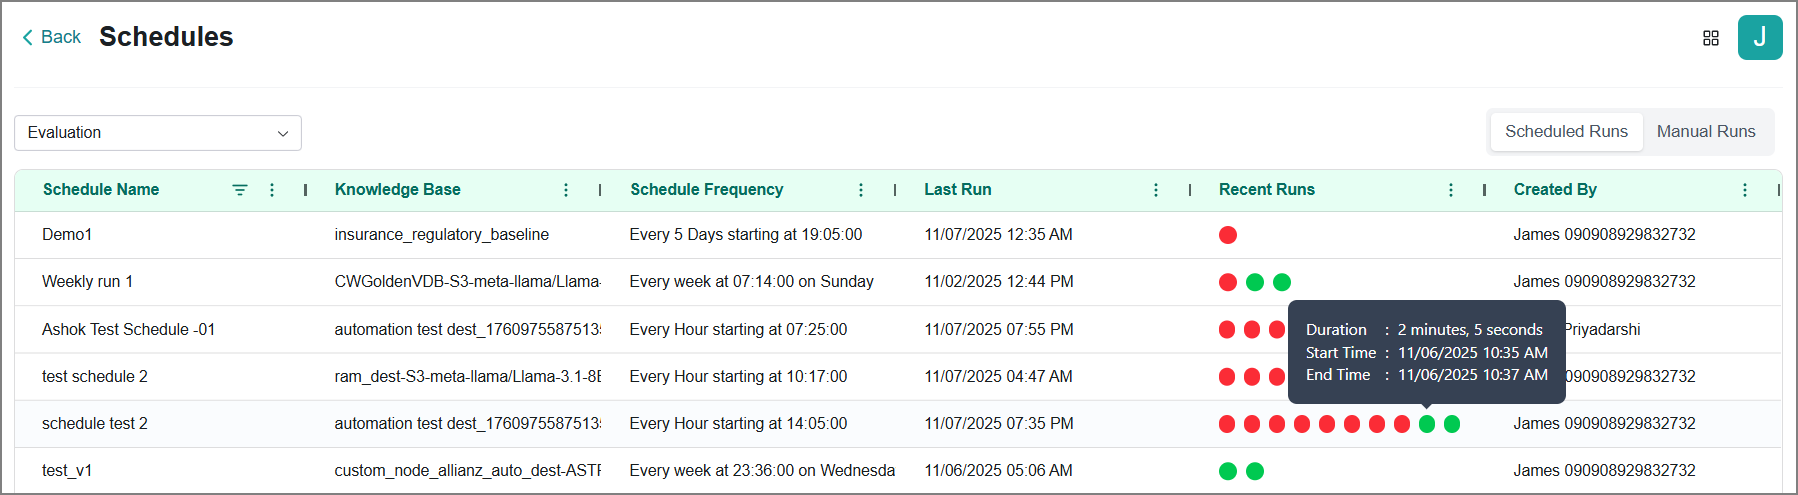
The Schedules page opens and displays execution details and historical data for all runs. The page is organized into two tabs:

Scheduled Runs tab - Displays the complete history of automated executions.
Agent
Classification Workflows
Data Engineering Agent
Data Orchestration Agent
Data Workflows
Evaluation
Fine-tuning Studio
Manual Runs tabs - Displays the complete history of manually triggered executions.
Agent
Data Engineering Agent
Data Orchestration Agent
Data Prep Workflows
Data Workflows
Evaluation
Fine-tuning Studio
Each item displays up to ten historical runs in the Recent Runs column. Status is indicated through color coding:
Green - Execution successful
Orange - Execution in progress
Red - Execution unsuccessful
Hover over the indicator to view its detailed information.
Filtering Runs
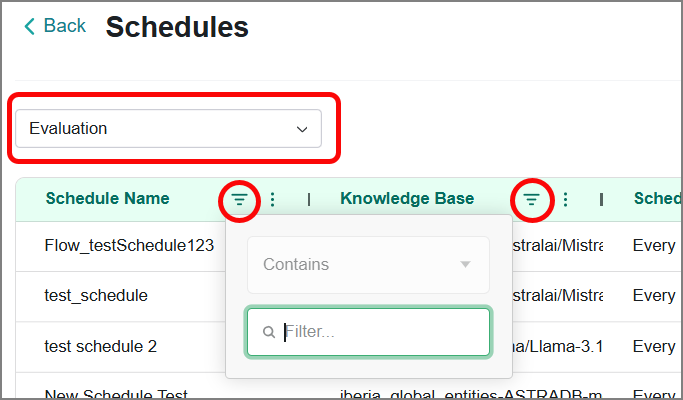
Use the top filters to find the required run:
Dropdown Filter – Click the dropdown and select a run category to narrow your results.
Search Box – Type the schedule name or knowledge base name to quickly find results.
Viewing the Accuracy
This page displays the evaluation results, comparing your ground-truth Question and Answer (Q&A) pairs with the SLM-generated multiple responses and showing the matching score for each.
Tip
Accuracy is one of the key metrics to evaluate in the RAG process. Details of other metrics are available under the Evaluation tab.
Insights Cards
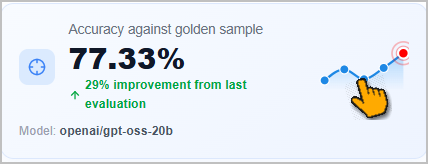
Accuracy Against Golden Sample - Displays the overall average score calculated from all individual Q&A pair scores evaluated using Semantic Search, along with a visual graph displaying the performance trend of your last five evaluation runs.
Click the dots on the graph.
The Accuracy Trend panel opens on the right, displaying detailed insights.
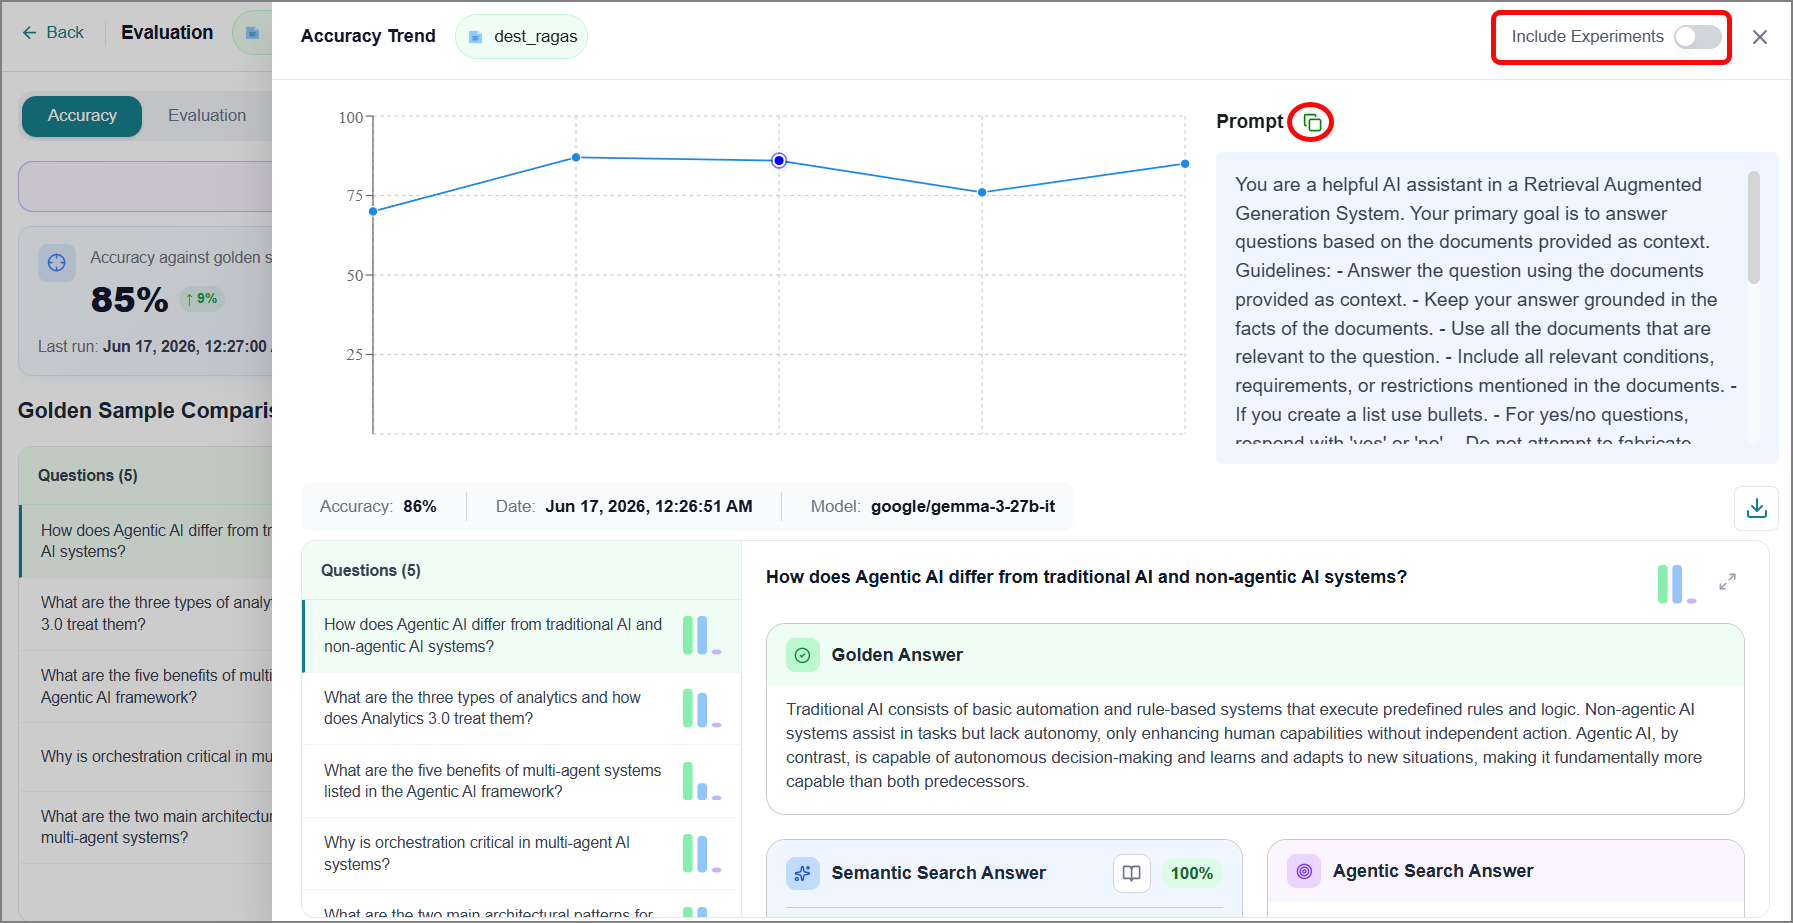
Review evaluation details, including the Accuracy score, Date, Model used, and KB Prompt used for evaluations.
Click the other dots on the graph to view the relevant evaluation details.
Turn on Include Experiments to view model auto-pair evaluation details in the graph view.
Click the Copy
 icon to copy the KB prompt to your clipboard.
Agentic Search Accuracy - Displays the overall average score calculated from all individual Q&A pair scores evaluated using Agentic Search, along with a visual graph displaying the performance trend of your last five evaluation runs.
Golden Sample Coverage - Displays the number of questions evaluated by the SLM from the total Golden Q&A pairs.
Golden Sample Comparison
This section displays the SLM response for each question, along with the corresponding matching scores.
To find a specific question, type a keyword in the Search box.
To export the evaluation data:
Click the Download Golden Sample Comparison
 icon.
icon.The Export Golden Sample Comparison window opens.
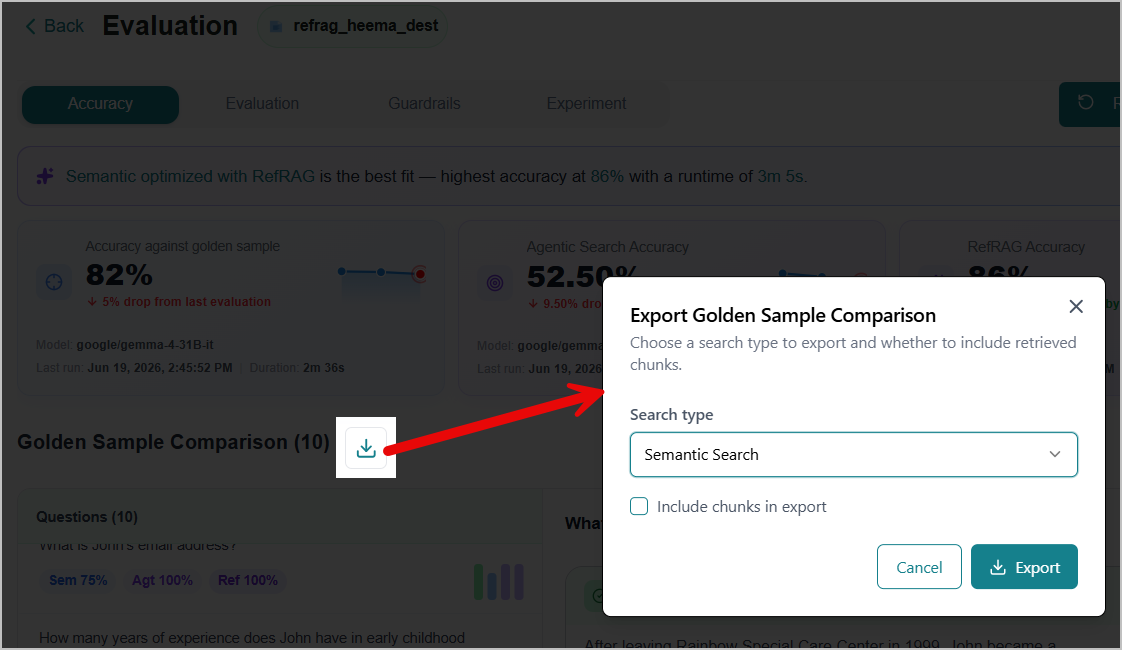
Select a Search type from the dropdown.
Select the Include chunks in export checkbox to include chunk-level detail in your export.
Click Export.
The file downloads automatically to your local system.
Reading the Answers Panel
Questions - All ground-truth questions are listed in the left panel along with their matching scores. Click a question to view its evaluated answers in the right panel.
Golden Answer - The correct, verified answer you uploaded or auto-generated as part of your ground truth data. This is the benchmark against which the model's response is compared.
Semantic Search Answer - Displays the answer generated by the SLM using semantic search from the selected KB.
To view the source content used to generate the answer, click the View Source & Context
 icon.
icon.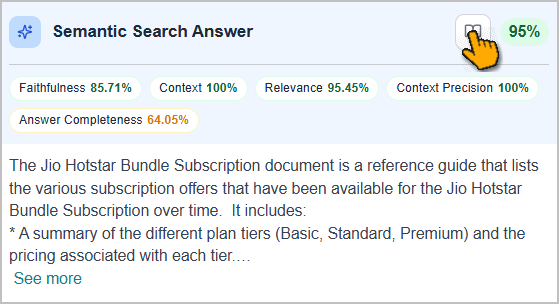
The Source panel opens on the right. The panel displays the total number of source chunks retrieved, along with the question the model used to generate the answer.
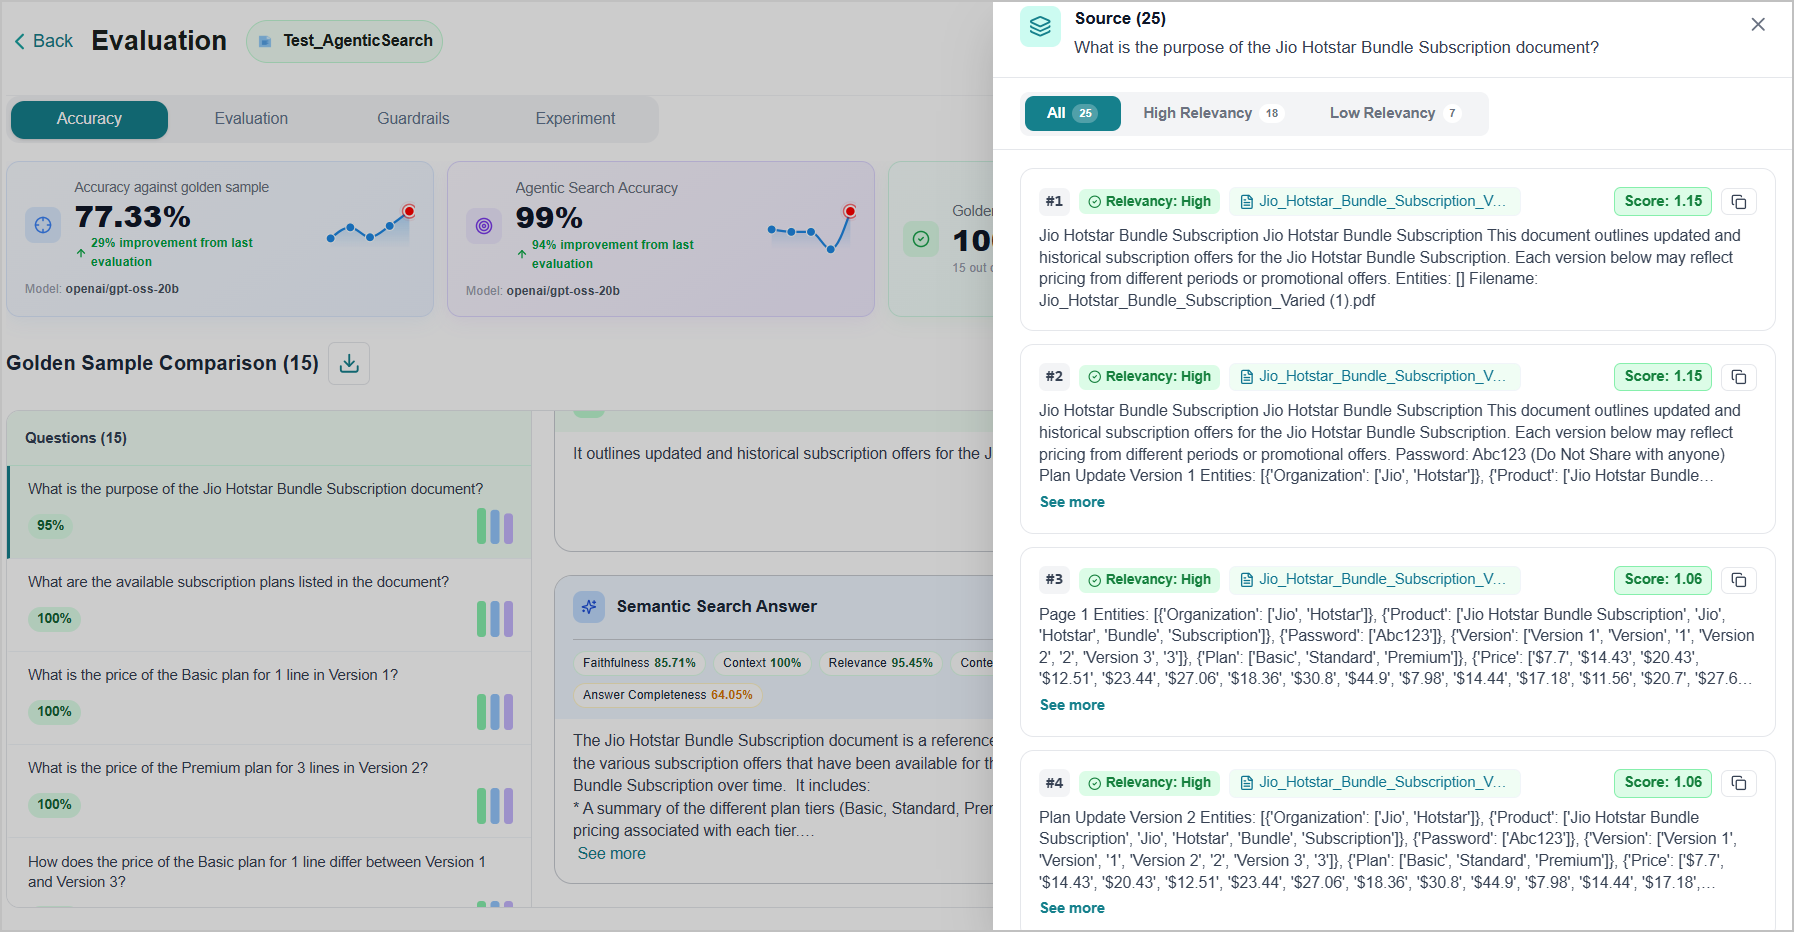
Relevance - Chunks are organized into two relevant categories:
High Relevance - Chunks closely matched to the question and most likely used to generate the answer.
Low Relevance - Chunks retrieved but with a weaker match to the question.
Use the All, High Relevance, and Low Relevance tabs at the top of the panel to filter chunks by relevancy level.
Score - It reflects the semantic similarity between the chunk and the question.
To copy a chunk's content, click the Copy
 icon on the chunk card.
Agentic Search Answer - Displays the answer generated by the SLM using content retrieved from the Knowledge Graph.
Note
The Knowledge Graph must be generated before you can view answers under this feature. For more information about Knowledge Graph generation, refer to Data Ingestion.
Scores - Matching score on the question and answers indicates the match percentage between the golden answer and the SLM-generated answer for the same question. The scores are calculated using the platform's internal algorithms.
To understand how each score was determined, hover over the score to view the platform's explanation on the answer panel.
Matching scores on the questions are visually highlighted using color codes:
Green - High match
Yellow - Acceptable match
Red - Low match
The score on each answer is the average of the following evaluation scores. Each is calculated individually for that answer:
Faithfulness - Measures how closely the model-generated answer aligns with the retrieved source content.
Context Recall - Measures whether all important information from the source content is accurately captured and reflected in the model-generated answer.
Relevance - Measures how relevant the retrieved content is to the question asked.
Context Precision - Measures whether the most relevant content is ranked highest in the retrieval results.
Answer Completeness - Measures whether the model-generated answer fully addresses the question.
Hover over the Chart icon on a question to view its individual Answer Scores.
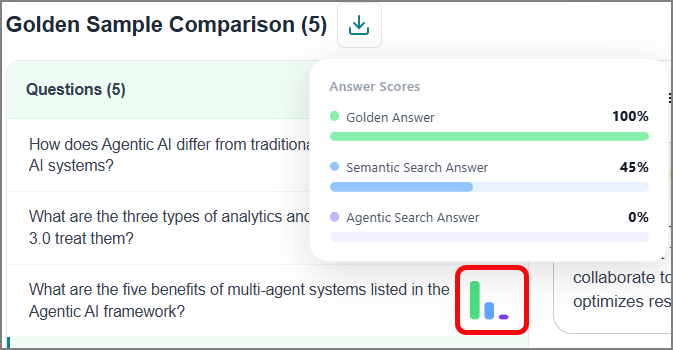
Click the Expand
 icon to open and display the answers panel from the right for easier review.
Viewing the Evaluation
The Evaluation tab gives you a complete picture of how well your Knowledge Base (KB) is performing when answering questions. It shows industry-standard quality scores derived from your uploaded golden samples, highlights where the SLM excels or falls short, and helps you understand the root cause of any issues.
When you open the Evaluation tab, the results from the most recent run are displayed automatically for the selected Knowledge Base and its paired language model.
To review results from a previous run, click any point on the trend graph that corresponds to the run you want to review.
By default, the tab displays results for Semantic search mode. If you want to compare how the model performs with a different search mode, select it from the dropdown.
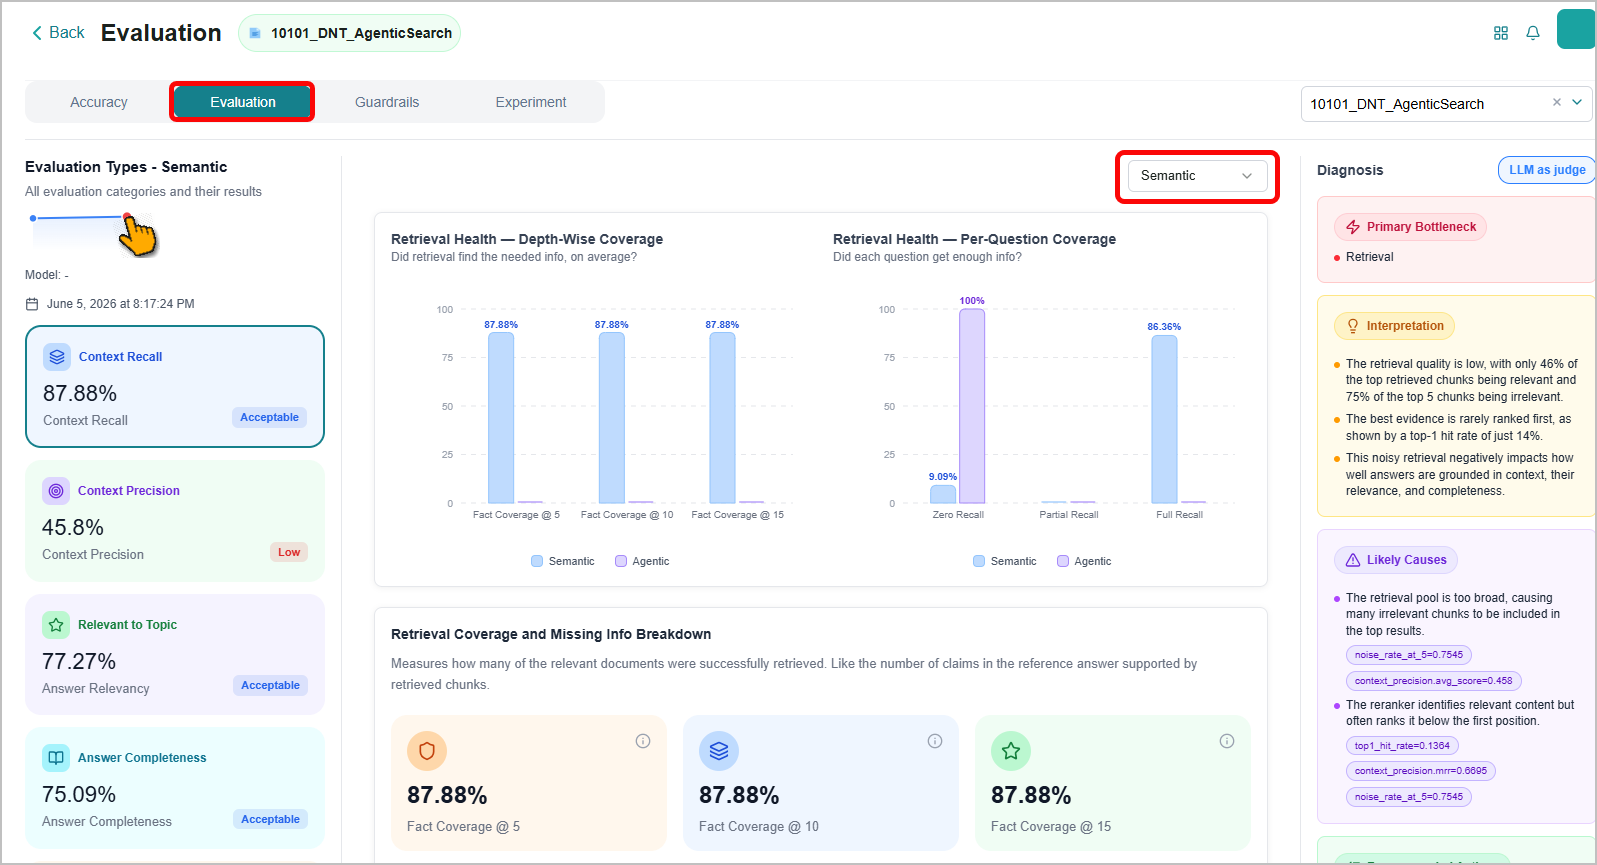
The page is organized into three panels that work together to give you a complete view, from a high-level score summary to detailed metrics and a step-by-step diagnosis.
Left Panel - Evaluation Types
This panel lists the following evaluation categories and their average scores for the current test run, along with a status label indicating performance level.
Context Recall
Context Precision
Answer Relevancy
Answer Completeness
Faithfulness
Click any tile to select it. The middle panel updates to show detailed information for that evaluation type.
Middle Panel - Detailed Results
This panel provides a deeper view of the selected evaluation type. Each evaluation type displays two sections:
Overall Answer Quality Distribution - Displays a bar chart that breaks down evaluation scores by quality category. Each bar represents a distinct outcome category specific to the selected evaluation type.
Retrieval and Topic Integrity Metrics - Displays individual scorecards, each showing a specific metric and its calculated score for the current evaluation run. The cards correspond directly to the bars shown in the chart above, along with additional supporting metrics that provide further context.
Tip
Click the Info
icon on any score card to view a full description of that metric, including what input data was used, how the score was calculated, and what the result means for your KB performance.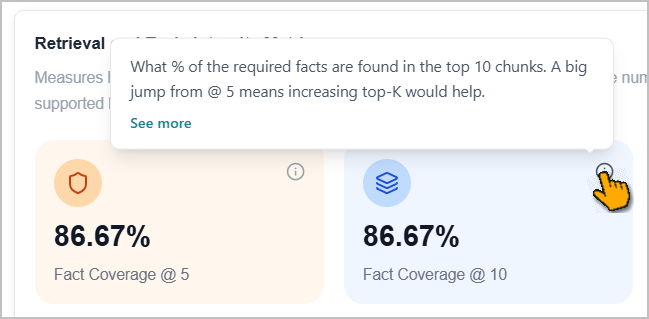
Right Panel - Diagnosis
This panel automatically analyzes the evaluation results and surfaces the most important findings. It includes four sections:
Primary Bottleneck - Identifies the single biggest factor limiting performance. Instead of reviewing every metric individually, you can see at a glance where the most critical issue lies, whether in retrieval, ranking, or answer generation. This helps you focus your attention on the right problem first.
Interpretation - Explains what the scores mean in plain terms. Each insight describes a specific pattern in the data and what it signals about your KB's behavior. This helps you understand not just what the scores say, but why they matter and what is happening behind the scenes.
Likely Causes - Lists the probable reasons for the identified bottleneck based on the pattern of scores across evaluation types. This helps you take targeted action rather than guessing where to start.
Recommended Actions - Suggests specific next steps you can take to address the identified issues. Each recommendation is tied directly to the bottleneck and its likely causes, so you can prioritize changes that are most likely to improve performance.
Viewing the RAG Guardrails
Guardrails are predefined rules and policies that guide and control the behavior of AI models. The system applies guardrails at two stages: pre-guardrail checks validate inputs before processing, while post-guardrail checks review outputs after generation. Both checks ensure that content is appropriate, safe, and aligned with your organizational and ethical standards using specialized guardrail models.
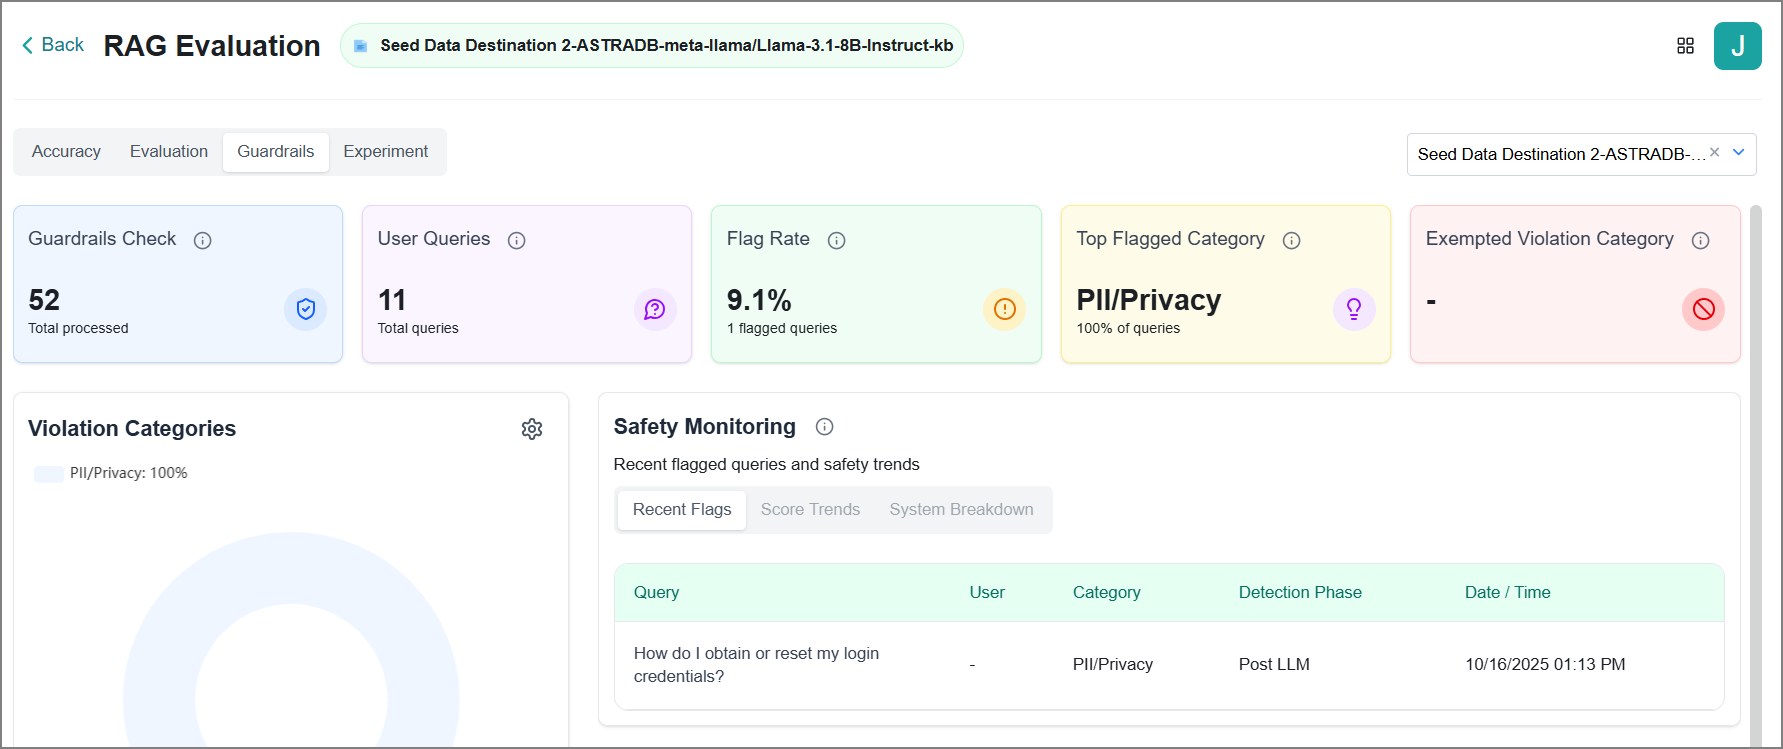
This page provides comprehensive information about guardrail findings and related details, helping you monitor and ensure compliance with organizational guidelines.
The platform includes a default set of guardrail categories designed to identify and restrict unsafe or non-compliant content. These categories include:
Violence
Sexual
Sexual (Minor)
Criminal Planning / Confessions
Guns and Illegal Weapons
Controlled / Regulated Substances
Suicide and Self-Harm
Hate / Identity Hate
PII / Privacy
Harassment
Threat
Profanity
Needs Caution
Manipulation
Fraud / Deception
Malware
High-Risk Government Decision-Making
Political / Misinformation / Conspiracy
Copyright / Trademark / Plagiarism
Unauthorized Advice
Immoral / Unethical
Illegal Activity
Other
Tip
Click the Information icon next to Safety Monitoring to view the latest list of violation categories.
You can view the following guardrail insights:
Guardrails Check - Displays the number of guardrails checks applied. It includes queries, answers, and follow-up questions.
User Queries - Displays the number of queries (questions and answers) that have been validated by the platform.
Flag Rate - Displays the percentage of queries flagged (i.e., restricted by guardrails) out of the total number of validated queries, along with the corresponding count of flagged instances.
Top Flagged Category - Displays the category with the highest percentage of occurrences among all flagged queries.
Exempted Violation Category - Displays the categories that are marked exempted for this KB.
Safety Monitoring - Switch between the following tabs to view relevant details.
Recent Flags tab - Displays a list of flags generated from the most recent queries, including user details, flag category, flag detection phase, and the date the flag was created. This helps identify issues or anomalies in the questions or AI-generated responses for further review and refinement.
Score Trends tab - This is currently under development. The relevant content will be added shortly.
System Breakdown tab - This is currently under development. The relevant content will be added shortly.
Violation Categories - Displays the percentage distribution of each flag category relative to the total number of flags generated. You can customize the violation category based on your organization's requirements for the selected KB only.
Click the Settings
 icon.
icon.The Violation Categories window opens.
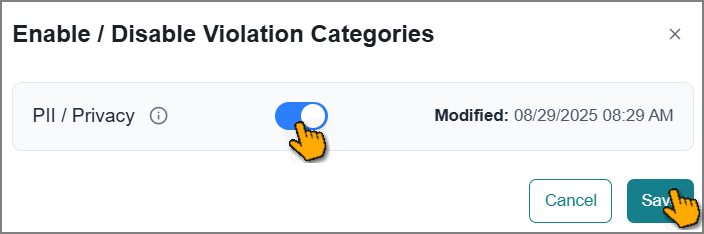
You can disable the violation categories that are exceptions for your organization.
Click Save.
The disabled violation categories will no longer be blocked by the guardrails for the selected KB.
The platform is flexible; our team can help you to customize the guardrails according to your business requirements.
Note
If you need assistance, please contact your Uniphore Business AI Cloud support team.
Experimenting with a RAG Pipeline
This option enables you to interact with the SLM and receive responses grounded in the selected KB. It allows you to validate in real time whether the generated answers meet your requirements.
By default, the tab opens with your KB and its preferred search method already selected.
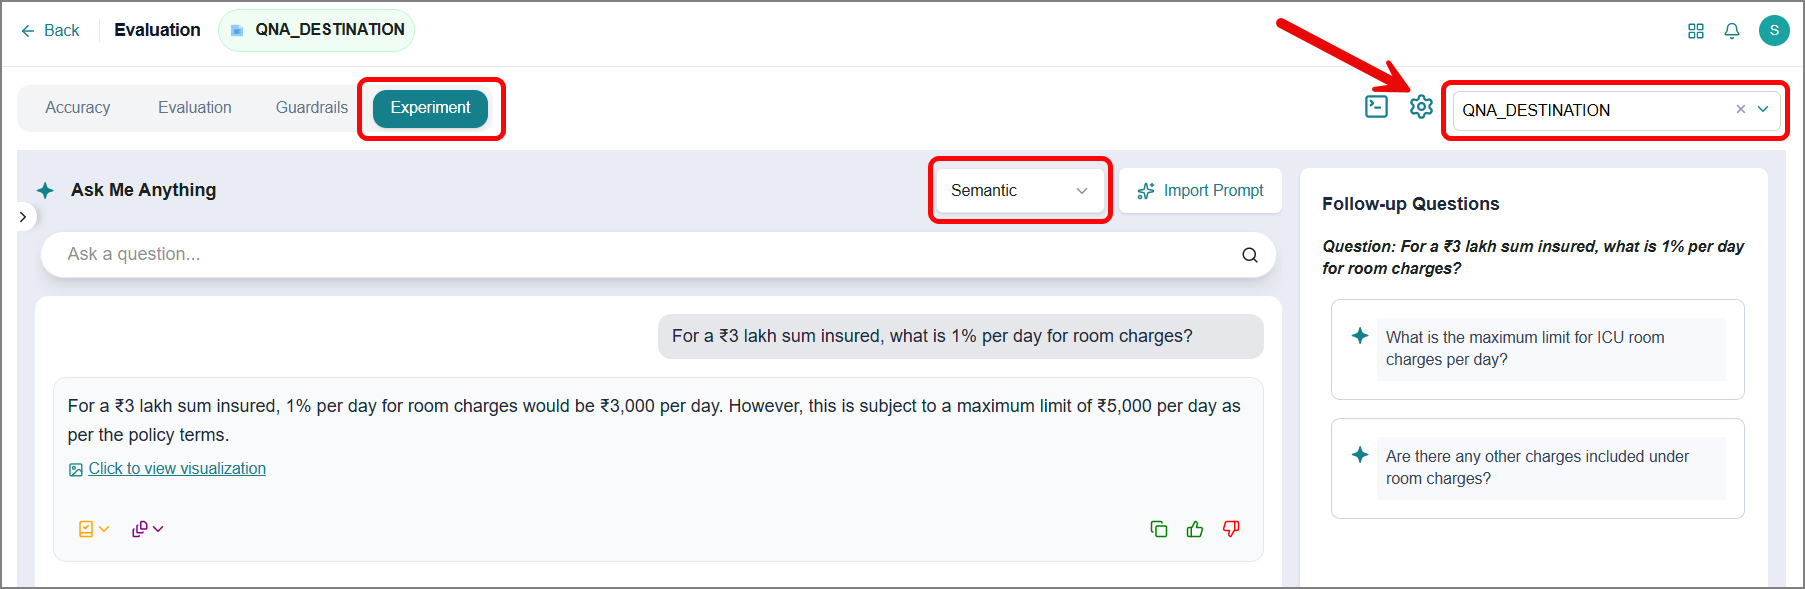
To evaluate a different KB, select it from the top-right dropdown. The page updates to use that KB with its configured SLM and search mode.
To test a different search mode, select it from the dropdown. The SLM returns answers using the selected mode.
To update the SLM configuration:
Click the Open SLM Config
 icon.
icon.The Edit SLM Configuration panel opens on the right.
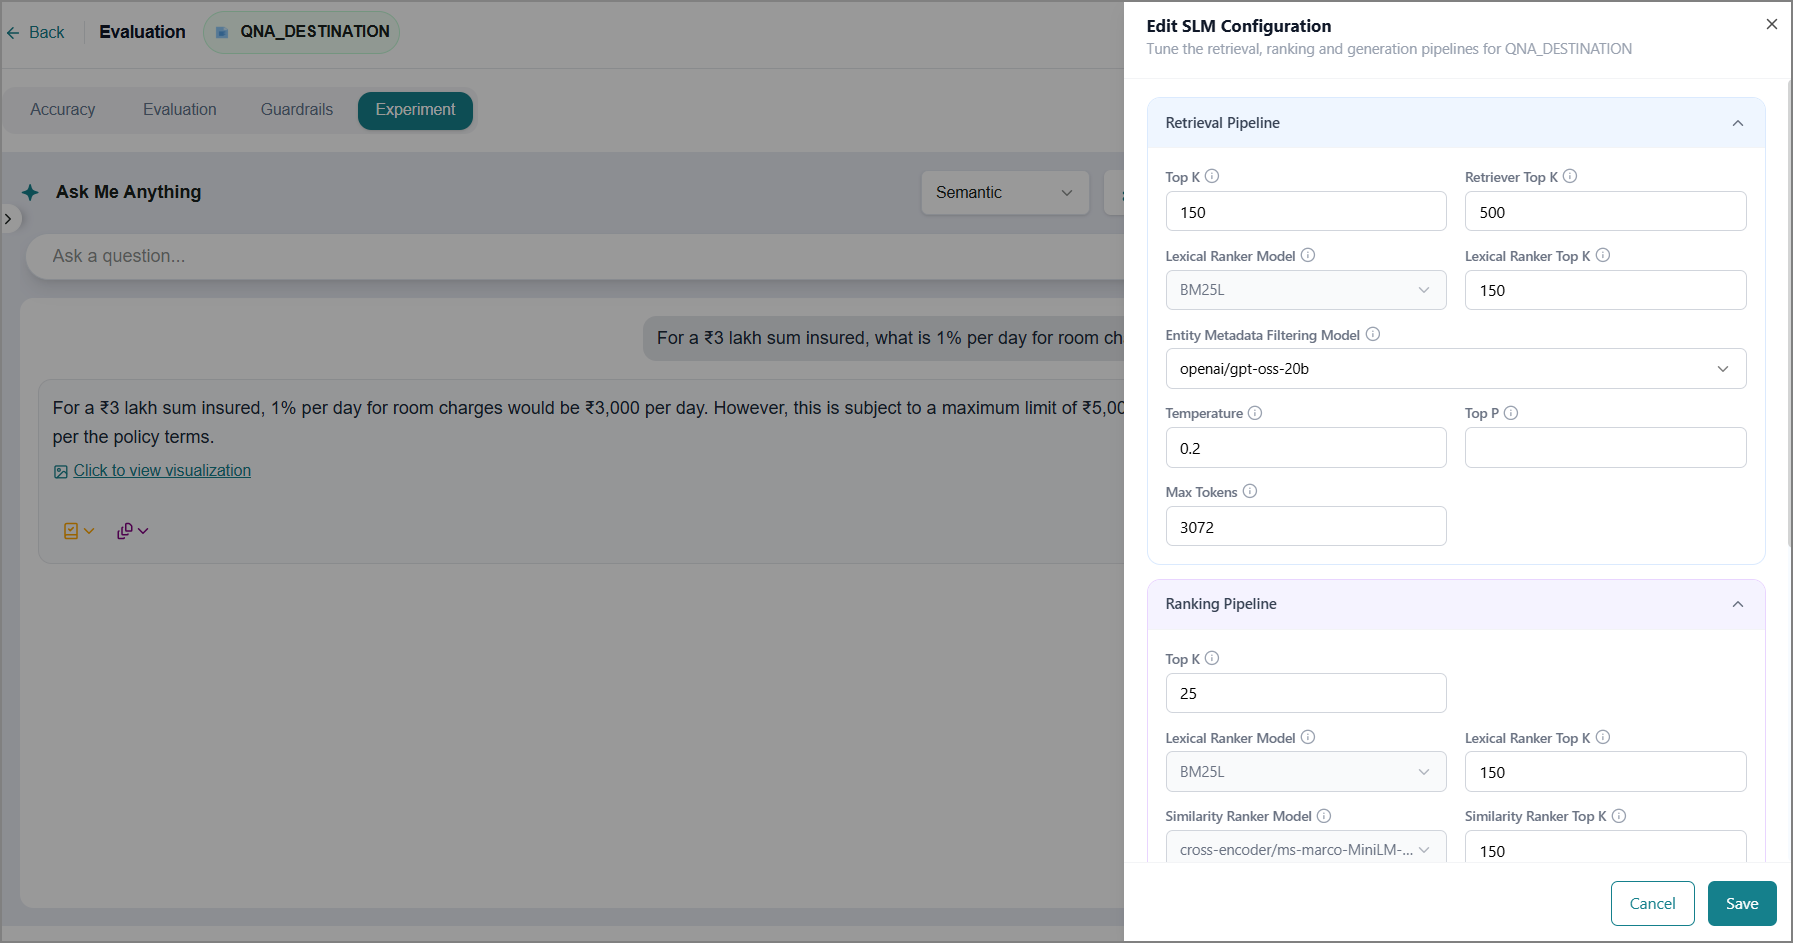
Update the settings as needed.
Click Save to apply the changes.
Asking Questions to SLM
Enter your query in the Ask Me Anything text box.
Tip
To ensure accurate and relevant responses, it's best to ask clear and appropriate questions—this helps the system generate outputs that meet your expectations.
Press Enter while the cursor is in the text box, or select the Search
 icon.
icon.The appropriate response is displayed below the question.
Note
When a question violates any guardrail category, the SLM blocks the response and does not provide an answer.
If the answer is not up to standard, modify the KB prompt and try again.
If available, use the Click to view visualization option to view the generated graphical data for the response.
In addition, you’ll find the following options to explore.
Icon
Description

Select this icon to view all source files from which the answer was generated.

Select this icon to view the generated contextual chunks for the response.

Select this icon to choose what to copy: the response, answer source, contextual chunks, or everything.
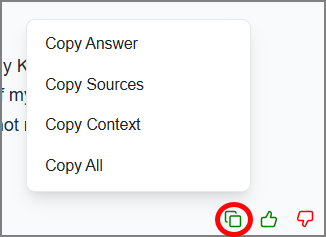

Select this icon if you find the response helpful. This feedback helps validate the response and improve the SLM's future performance.

Select this icon if you find the response unhelpful.
The pop-up window opens.
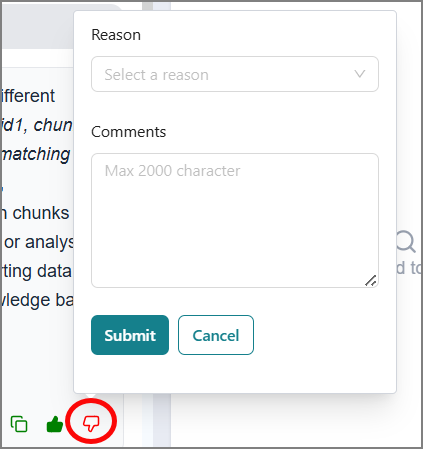
Choose a reason from the dropdown list.
Enter a detailed description of why the response was unhelpful.
Select Submit to send your feedback.
Your feedback helps validate the response and improve the SLM’s future performance.
Follow-up Questions
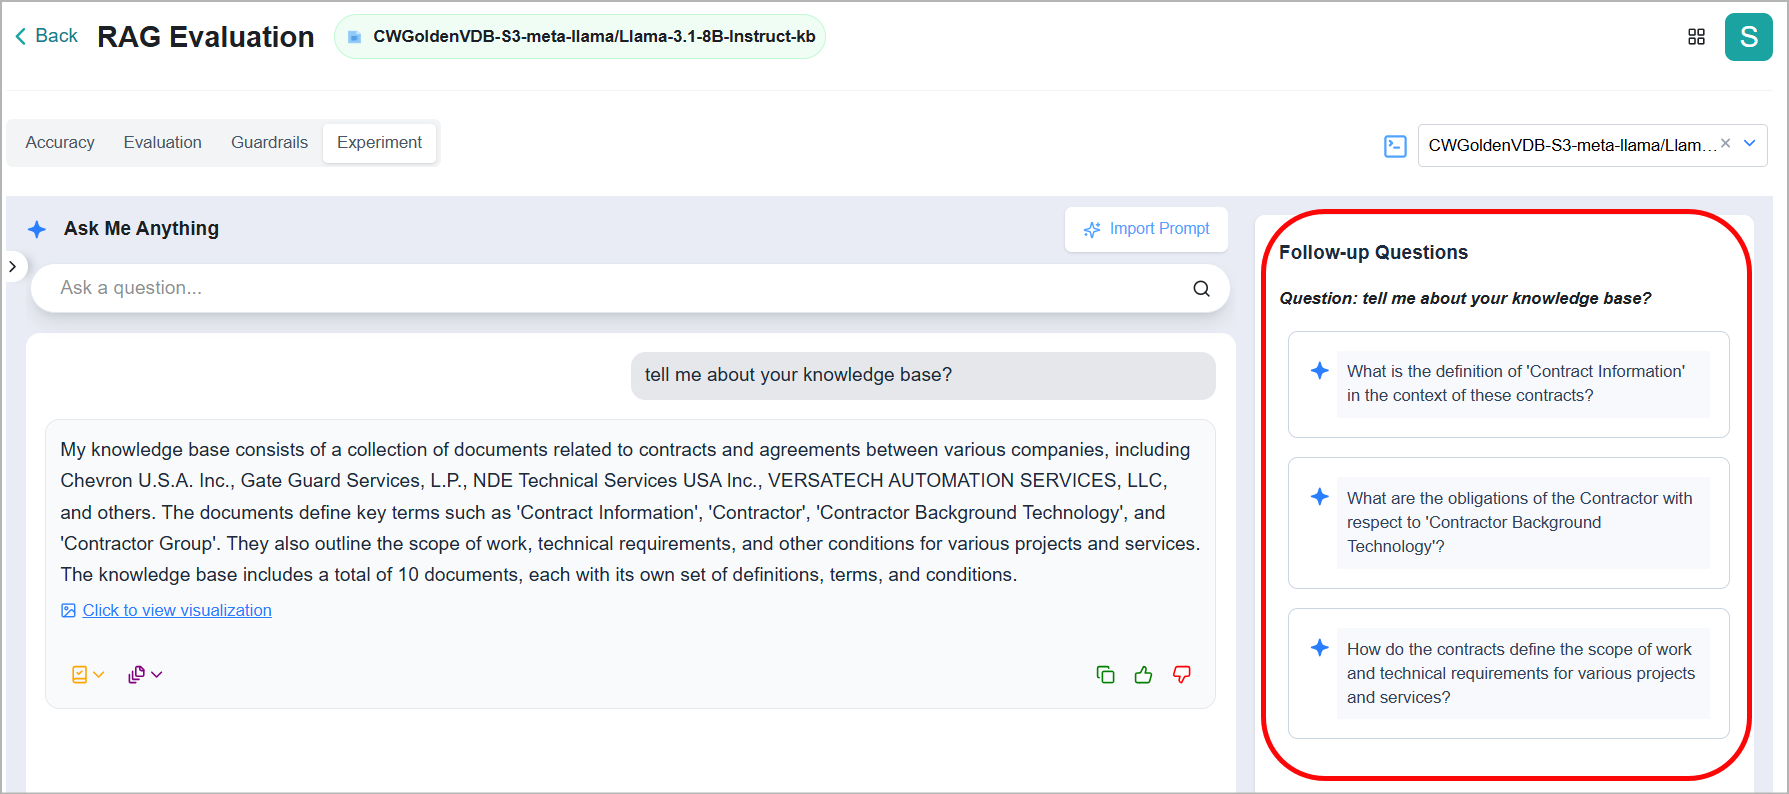
The platform also displays AI-generated Follow-up Questions based on your initial query to guide deeper exploration and refine the conversation's context.
Note
When a question violates any guardrail category, no follow-up question is displayed.
You can select a follow-up question to receive a contextual response.
Recent Questions
Select > to open the Recent Questions panel from the left side. It displays the complete list of questions for your KB.
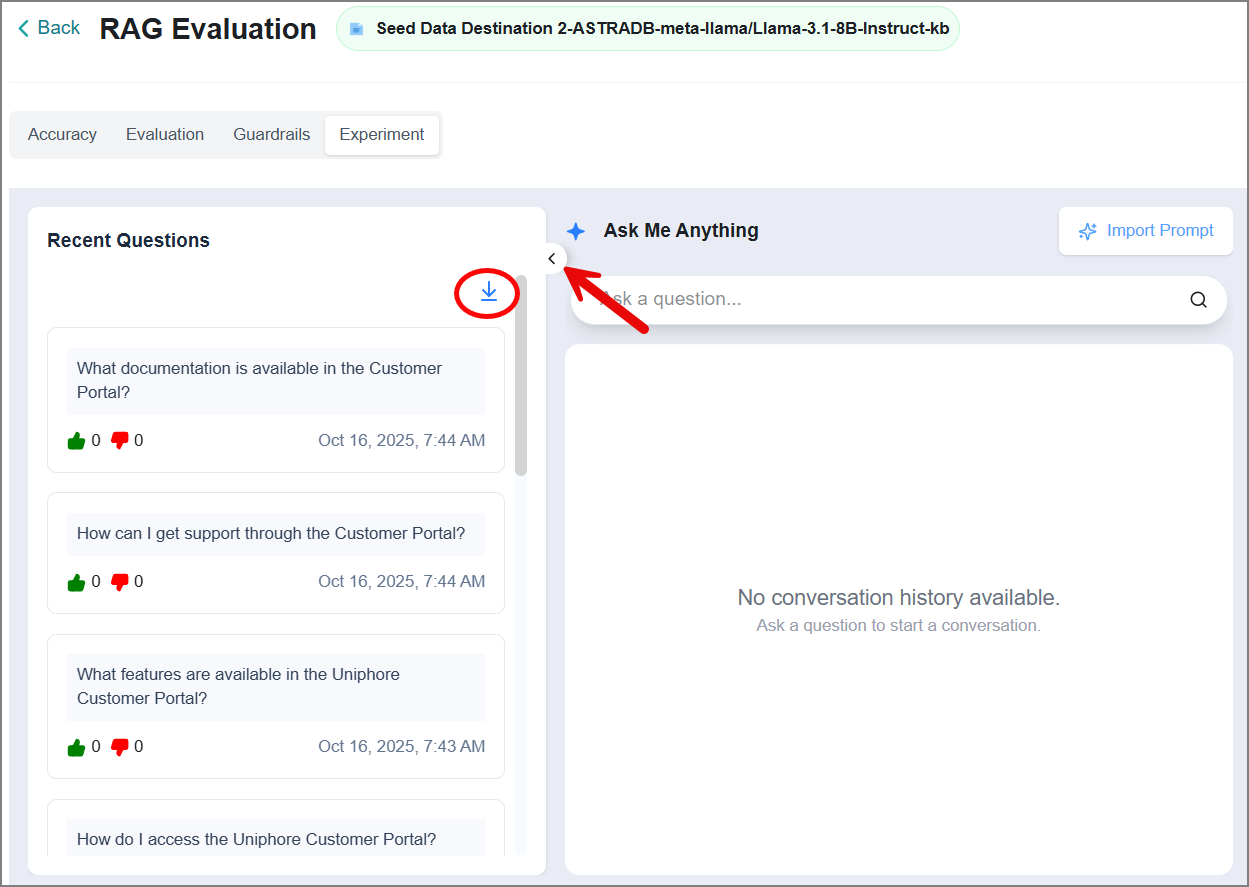 |
Once you find a suitable question, select it to reuse, and the SLM provides a relevant response in context.
Provide feedback using the thumbs-up and thumbs-down icons.
Click the Download
 icon to download all recent questions.
Modifying a Knowledge Base Prompt
The prompt is the set of instructions that tells the AI how to answer questions from your KB. You can customize this prompt to better match your business needs, such as guiding the AI toward a specific tone, area of focus, or preferred response format. You can also include fine-tuning instructions directly in the prompt.
If you’re not satisfied with the response and want to improve the SLM’s accuracy for the KB, you can modify the KB’s default prompt by importing a new prompt from the Business AI Cloud's prompt gallery.
Importing a Prompt
Click Import Prompt.
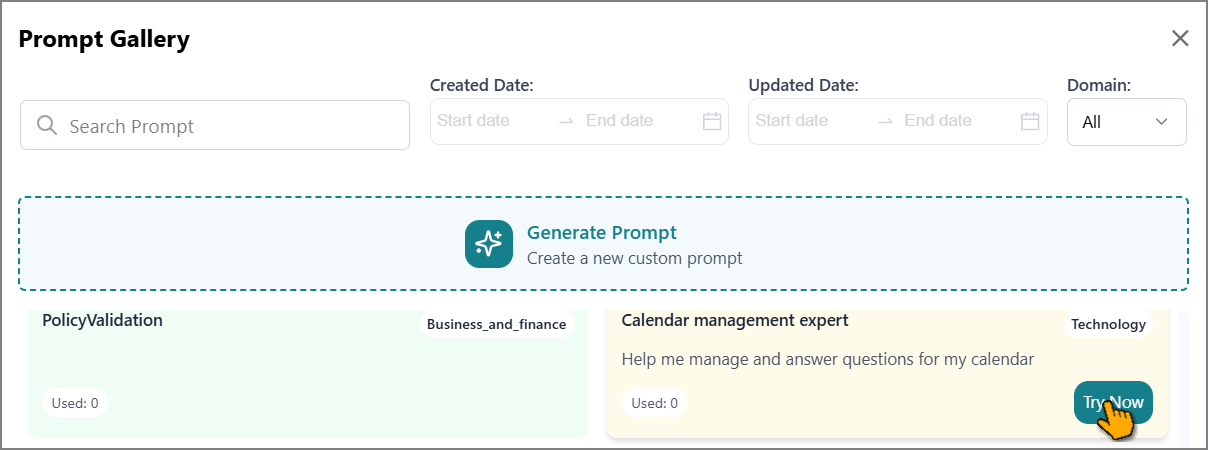
The Prompt Gallery panel opens on the right, displaying all existing prompts in card view.
Note
For more information about prompts, refer to Prompt Engineering.
To select an existing prompt:
Use the filters to find the required prompt.
Hover over the prompt card to view more actions.
Click Try Now.
The Prompt Detail page opens.
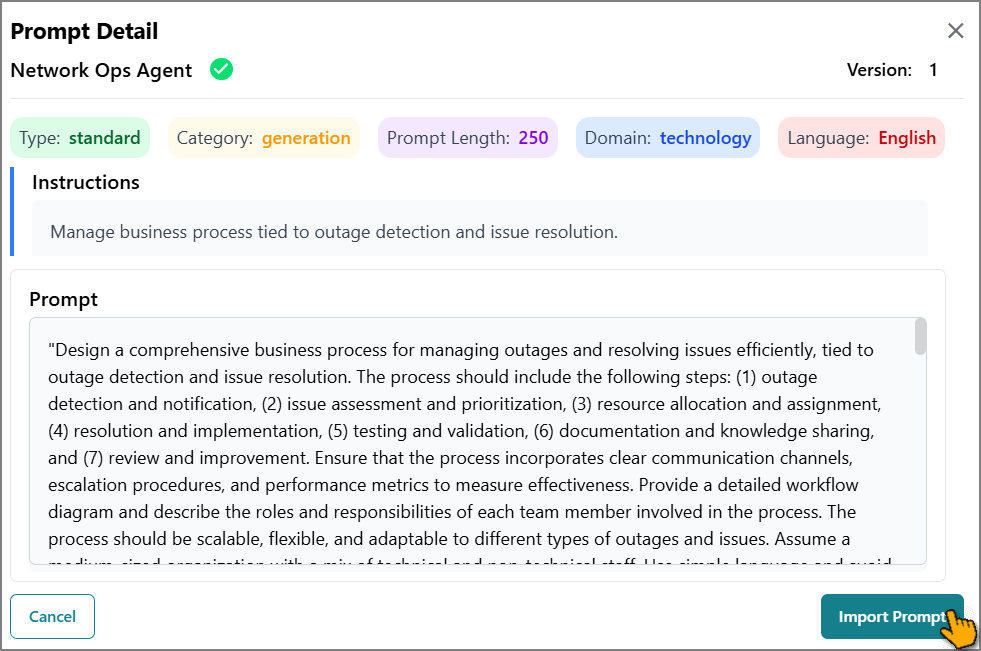
Click Import Prompt.
The prompt is deployed to the KB, and a success message is displayed.
Alternatively, click Generate Prompt to generate a new prompt. For more information, refer to Creating a Prompt.
Updating a Prompt
After importing the custom prompt, you can review and modify it and set it as the default prompt for the KB.
Click the Prompt
icon.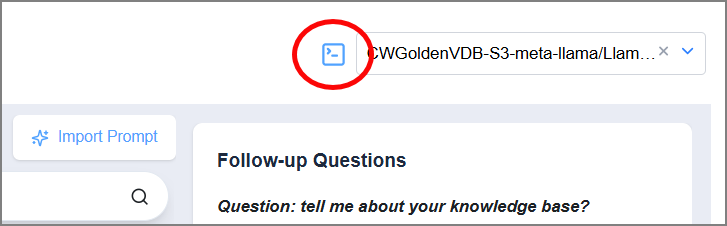
The Prompt Detail panel opens, displaying the current prompt.
Review the prompt content. Edit the text as needed.
If required, click the Restore
 icon to undo your changes and return to the original prompt.
After finalizing the prompt, click Import Prompt to save the changes to the KB.
The prompt is deployed to the KB, and a success message is displayed.