Interacting with AI Agents
This serves as the central interface for real-time interaction with your AI agents. From here, you can engage directly with the AI, ask questions, and receive responses grounded in their KBs. The interface is designed to support natural, conversational inputs and deliver accurate, relevant, and policy-aligned answers.
This environment is ideal for those who rely on AI-generated information to support decision-making, streamline workflows, or enhance user experiences. The responses generated here reflect the actual behavior of the deployed AI agents and are influenced by your selected retrieval configurations and underlying data.
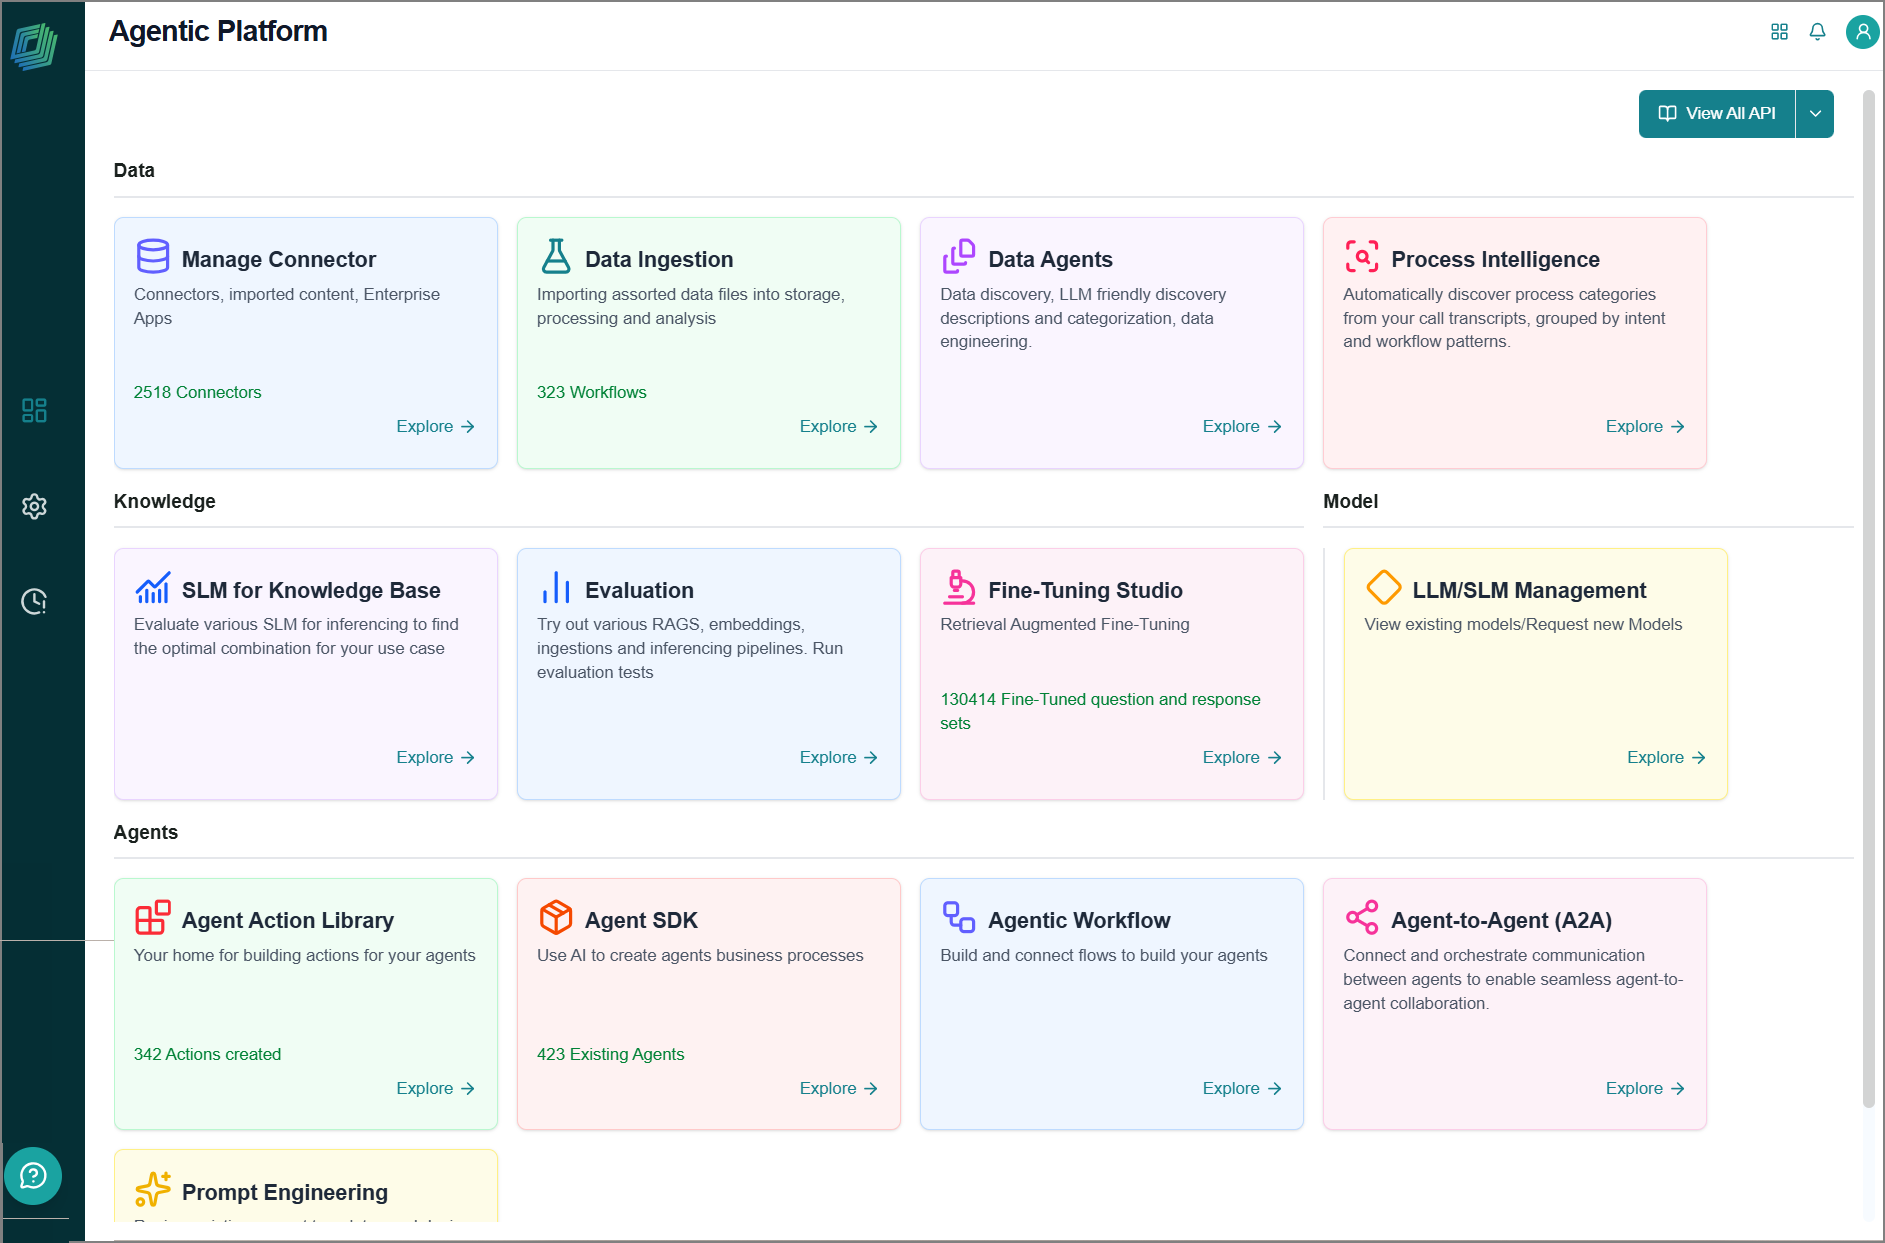
To access this page, go to the home page and click the Agents  icon on the top right of the page.
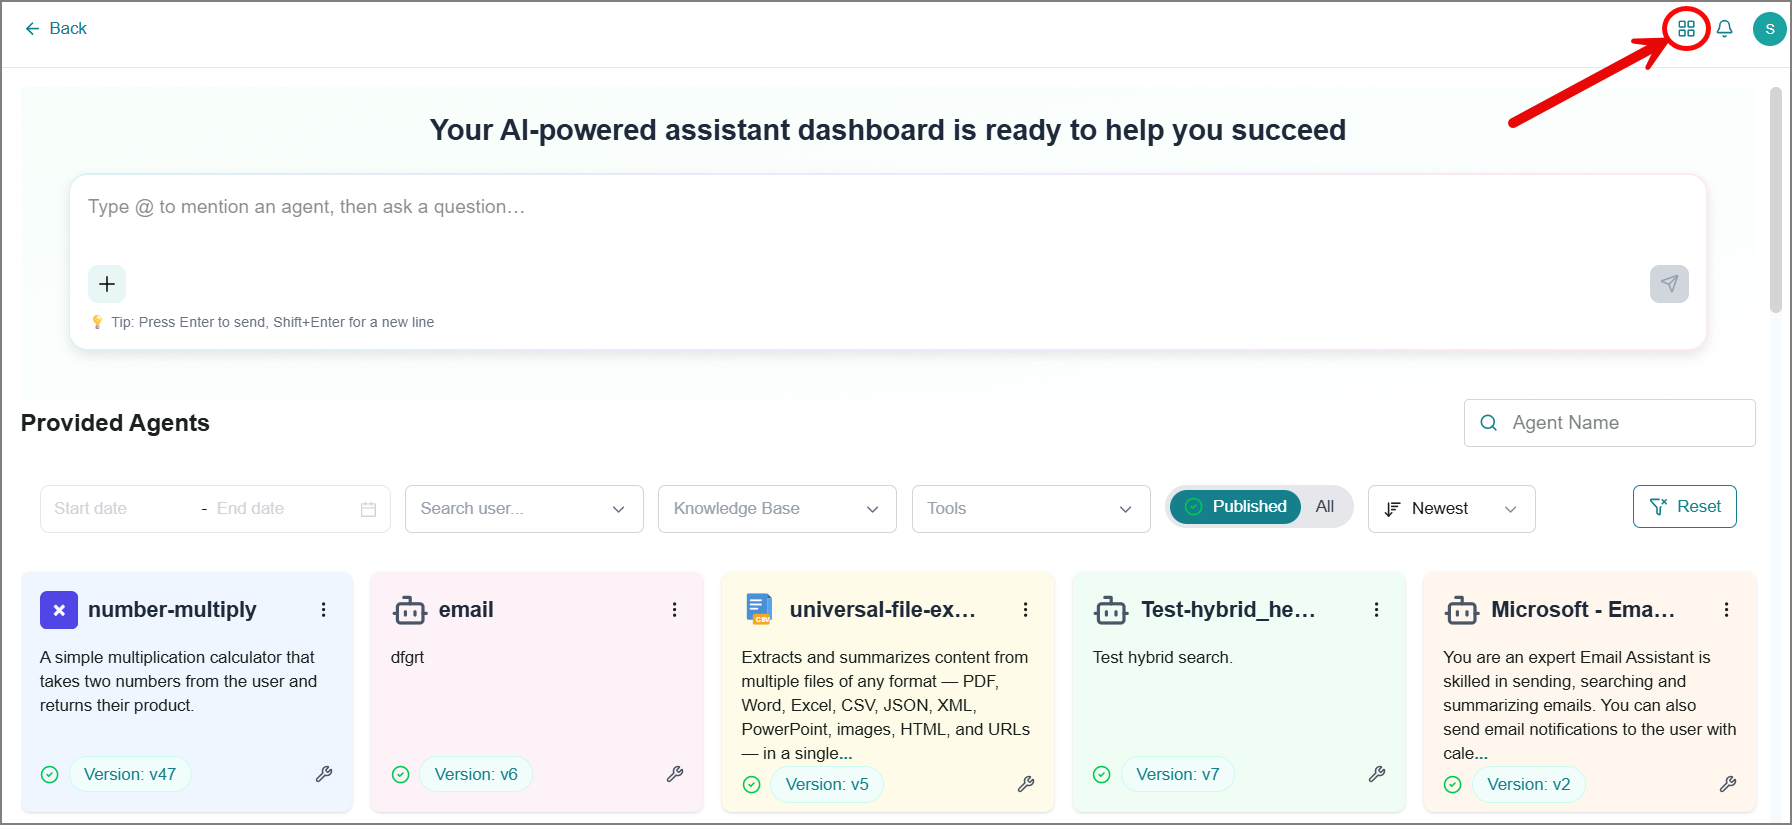
The agent chat page opens.
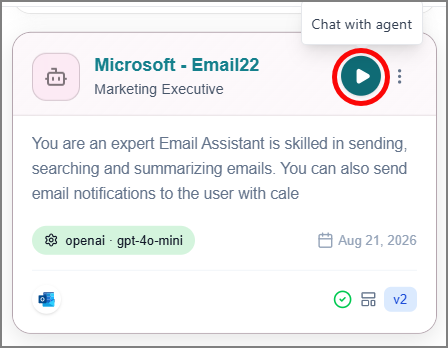
You can launch the agent directly from the Agent SDK page.
 |
Filtering Agents
The agent list can be filtered to help you find the specific agent you need.

Use the following filters to refine your search:
Enter an agent's name in the Search Box to quickly locate them.
Select a date range to filter agents created within a specific time frame.
Select one or more Users to view the agents they've created.
Select one or more Knowledge Bases to find agents linked to specific KBs.
Select one or more Tools to view agents linked to specific tools.
Enable Published to view published agents only.
Use sort order to arrange results as preferred.
Click Reset to clear all filters and return to the full agent list.
Ask Anything with AI
The platform enables you to interact directly with AI agents.
To begin:
Use either of the following to start:
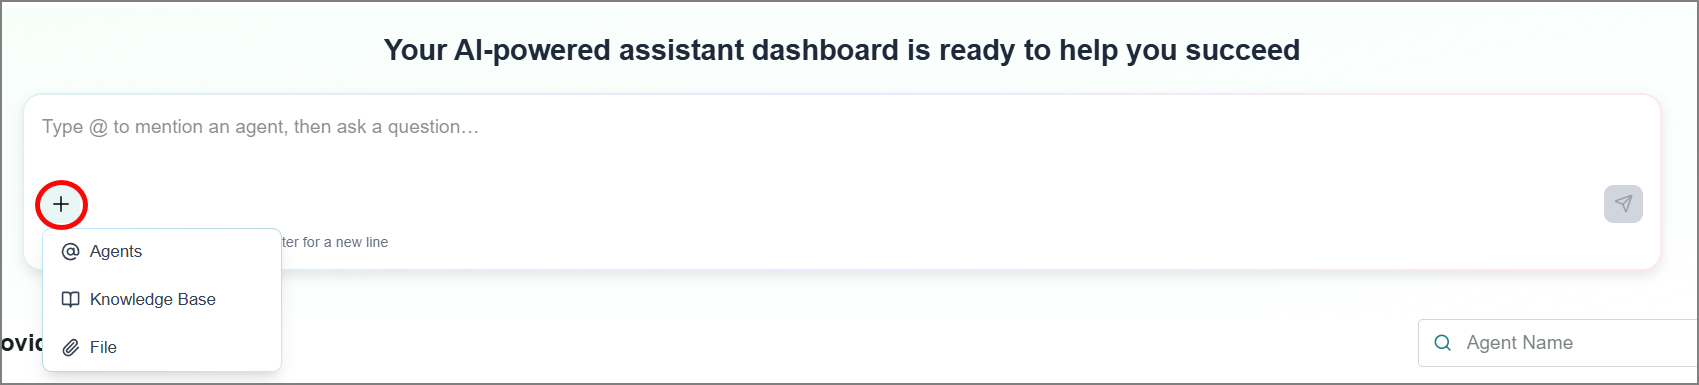
Type @ in the text box to view the list of predefined AI agents.
Click +, then select Agent.
The Select an Agent window opens. Search for and select the agent you want.
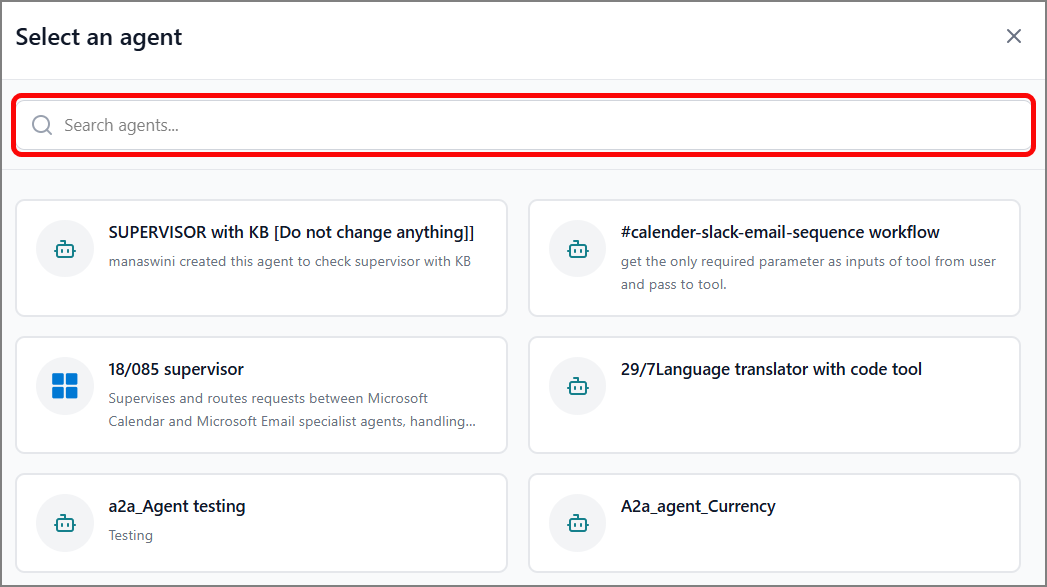
Filter and find an AI agent from the predefined agent list on the page.
(Optional) Add additional knowledge bases for the agent.
Note
Appending knowledge bases or replacing the agent's default knowledge base applies only to that session. These changes do not modify the agent itself. When the session ends, the agent will revert to its original configuration.
Click + , then select Knowledge Base. A list of available knowledge bases is displayed.
Update the knowledge base description, if needed.
Hover over the KB card.
Click the Edit
 icon.
icon.Enter or update the description as needed.
Click the Ok
 icon to save the changes.
Note
It's important that knowledge bases have useful, detailed descriptions, as this helps the agent determine which knowledge base to query. Changes made to descriptions are retained beyond the scope of the chat.
Select one or more knowledge bases to add.
The agent may have a default knowledge base. Use the Append to existing agent Knowledge Bases checkbox to select whether to replace the default knowledge base with the knowledge bases being added, or keep the default knowledge base and append additional knowledge bases.
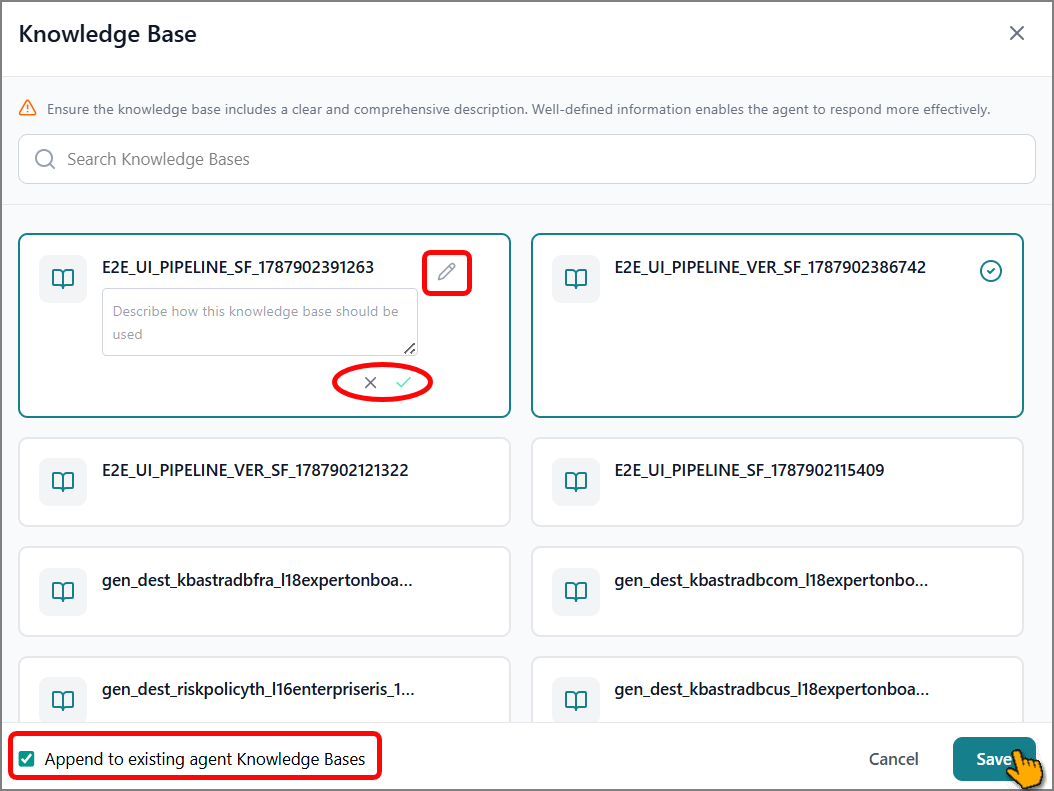
Click Save.
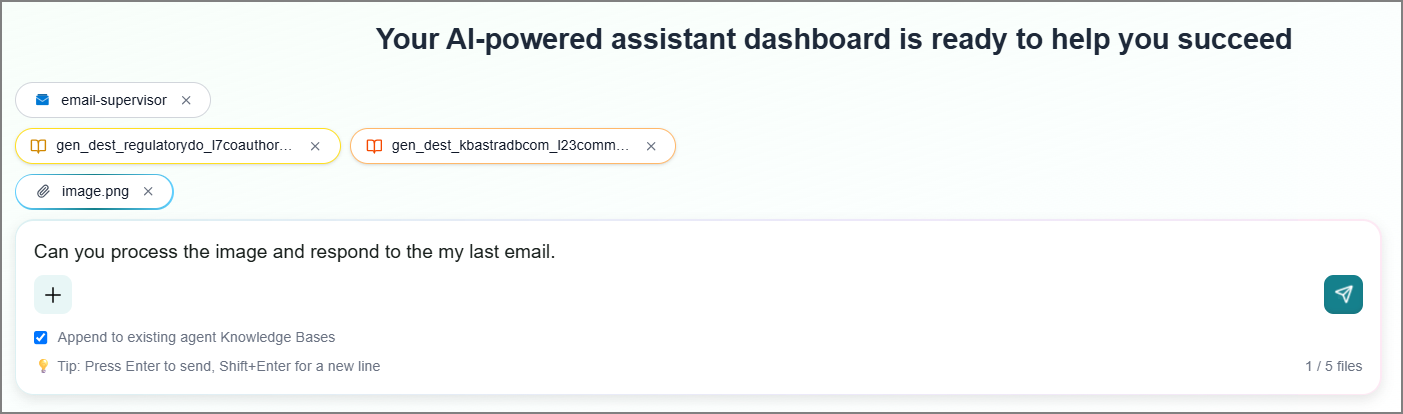
(Optional) Click +, then select File to add files that help agents execute your query.
File attachments have the following limits:
Maximum of 5 files
Maximum file size of 100 MB
Blocked file extensions - .exe, .bat, .cmd, .scr, .com, .pif, .sh, .bash, .zsh, .fish, .ps1, .psm1, .psd1, .vbs, .vbe, .js, .jse, .wsf, .wsh, .msi, .msp, .msc, .dll, .so, .dylib, .app, .dmg, .pkg, .deb, .rpm, .bin, .elf, .jar, .war, .class, .py, .pyc, .pyo, .rb, .pl, .cgi, .perl, .lnk, .hta, .cpl, .inf, .reg, .ocx, .sys, .apk, .ipa
Enter your question or complete problem statement.
Press Ctrl+Enter (Cmd+Enter on Mac) to submit.
The interactive conversation page opens, showing the AI agent and its interactions in the right-side panel, and real-time processing details for your request and agent details in the left-side panel.
Note
Please allow sufficient time for the response to be generated.
Once generated, you can view the answer or solution in the right-side panel.
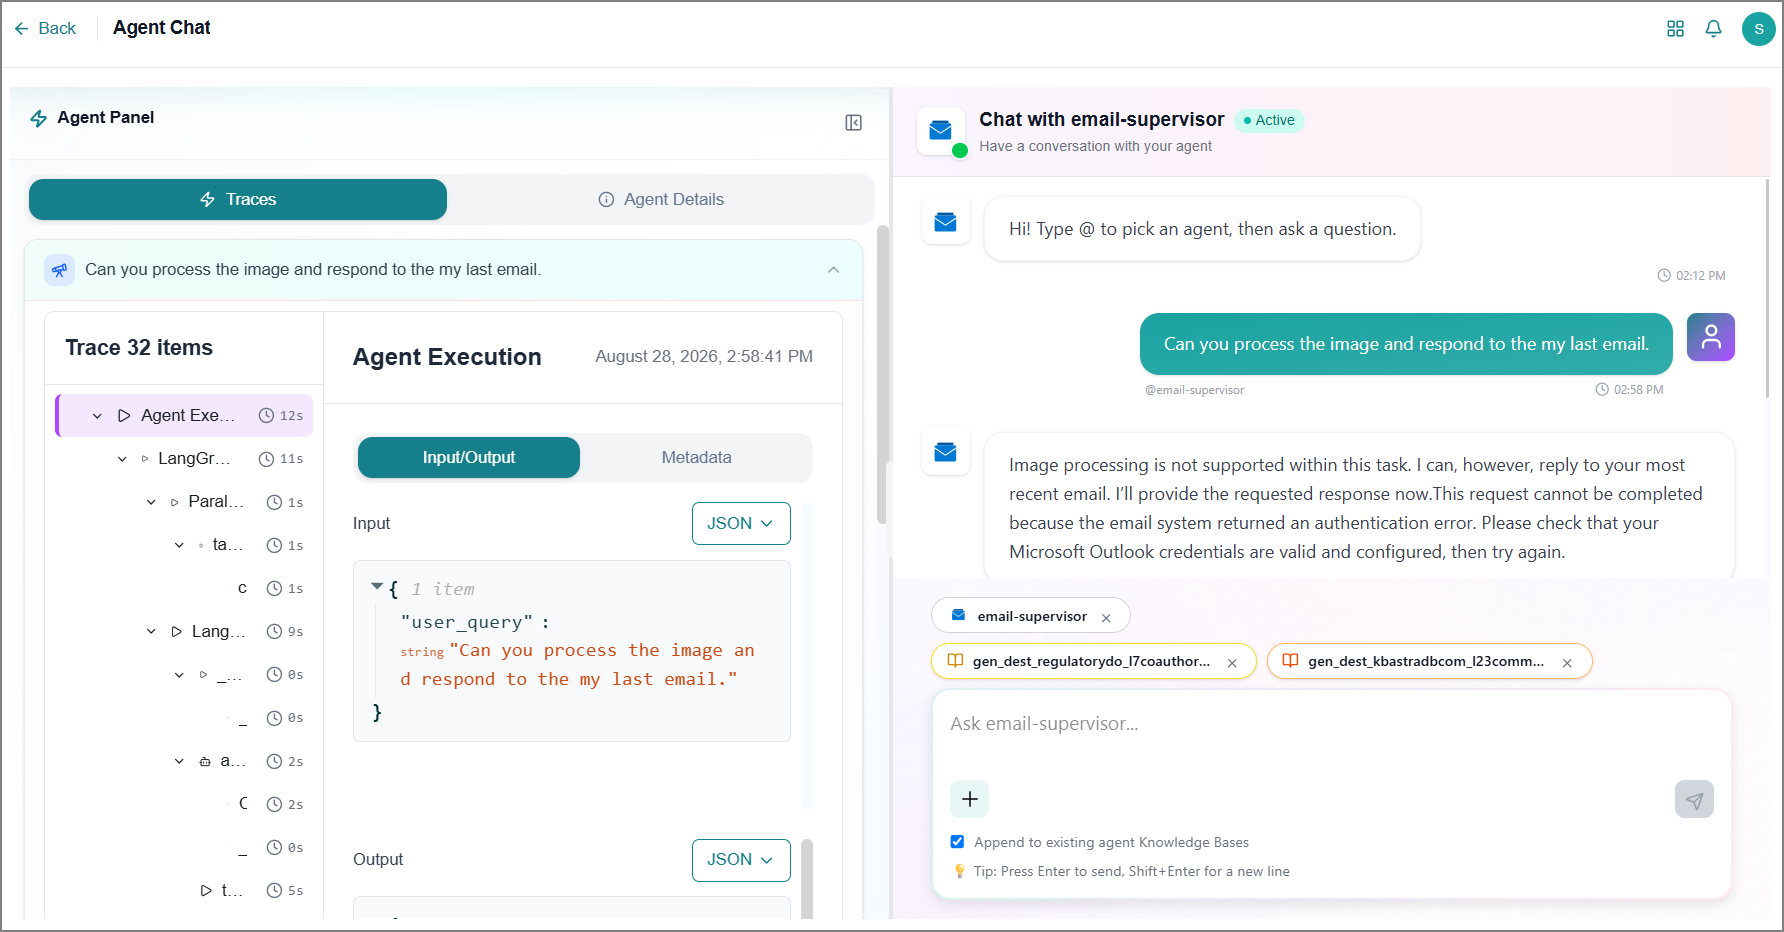
You can continue the conversation with the current agent to build on the existing context.
There are more capabilities on these panels:
You can tag a new agent and submit your query to leverage different capabilities or expertise.
Note
Currently, you can view only individual agent run details. Complete chat history is not yet available.
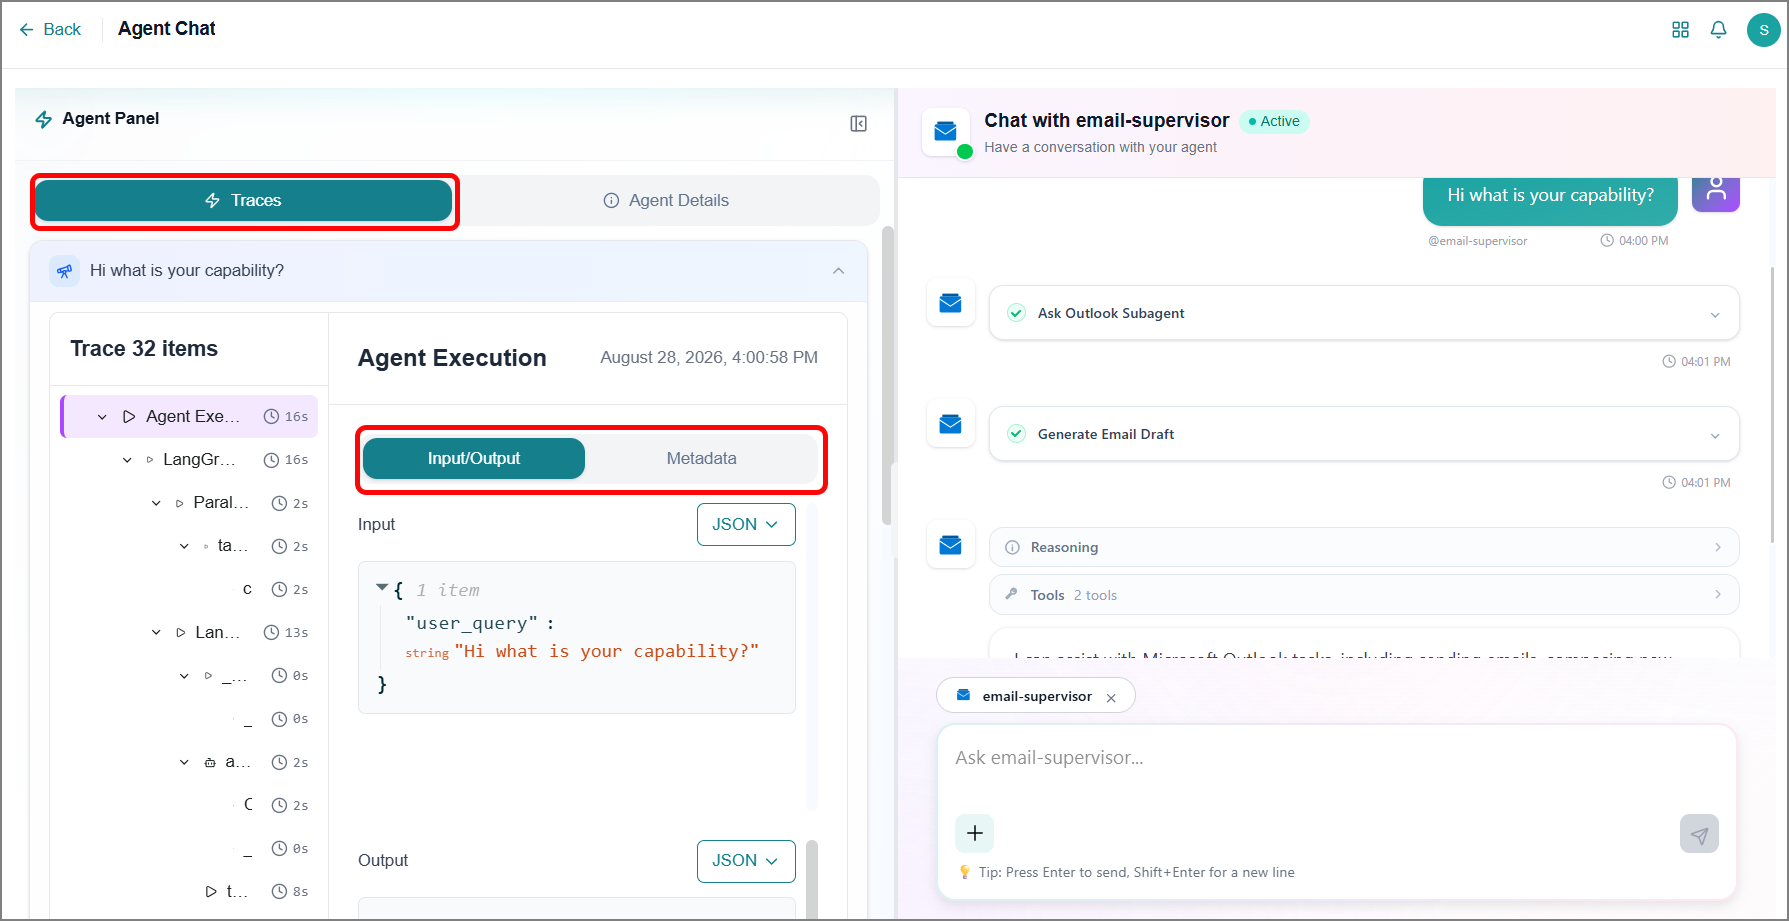
Switch to the Traces tab to view technical metadata about the execution.
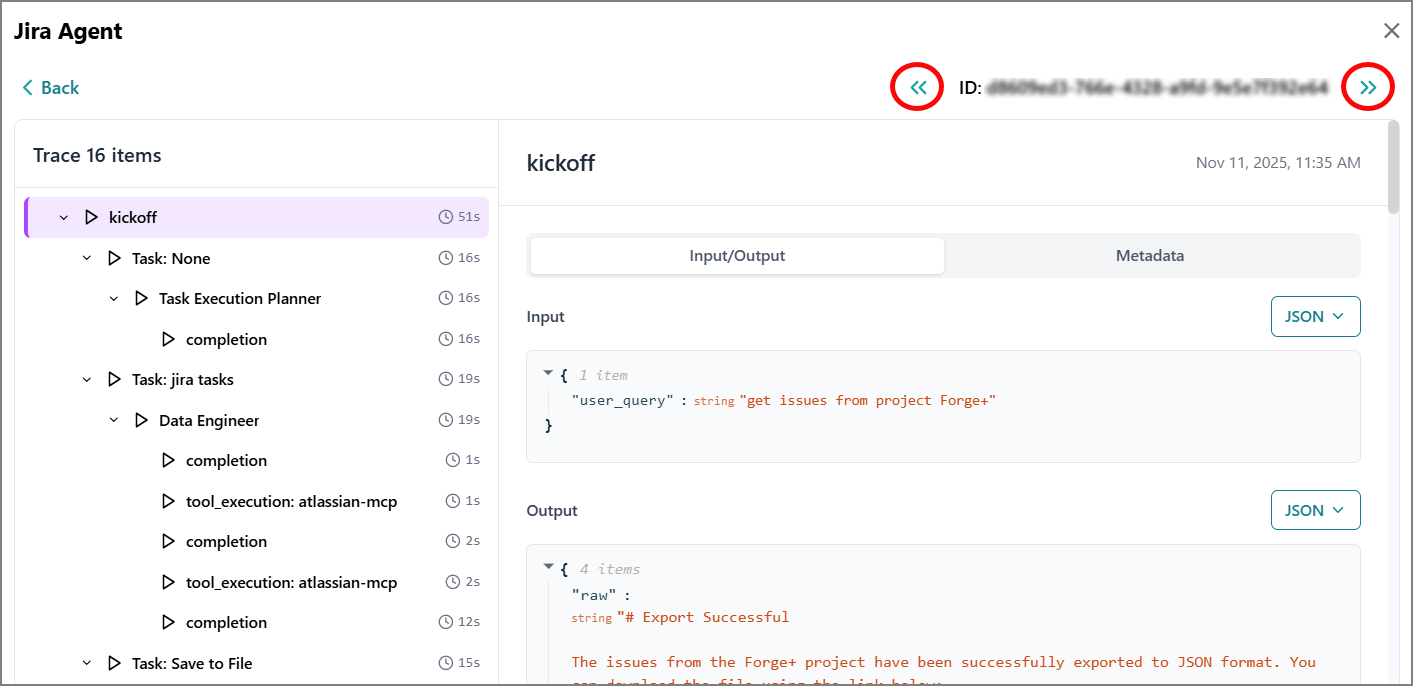
Click on any execution entry to view its input/output data (JSON and YAML format), execution sequence, timing information, and other performance metrics.
Switch to the Metadata tab to view additional execution data in JSON and YAML formats.
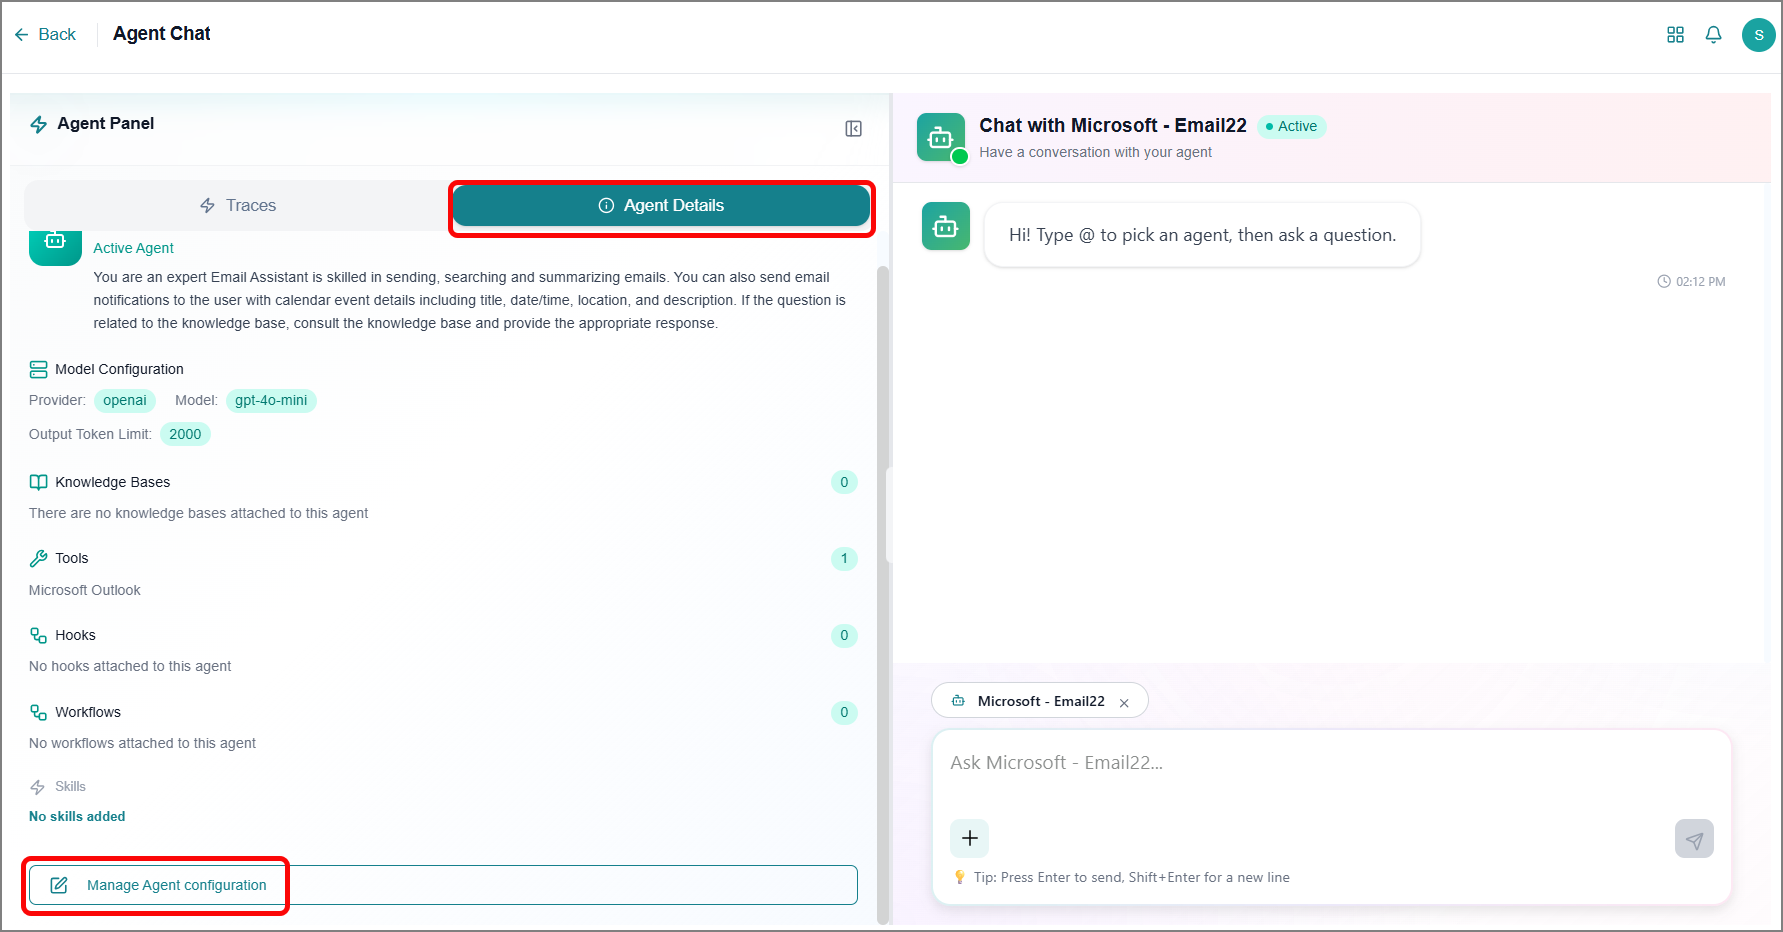
Switch to the Agent Details tab to view detailed information about the agent and its configuration.
To modify settings, click Manage Agent Configuration. Refer to Creating an Agent for more information.
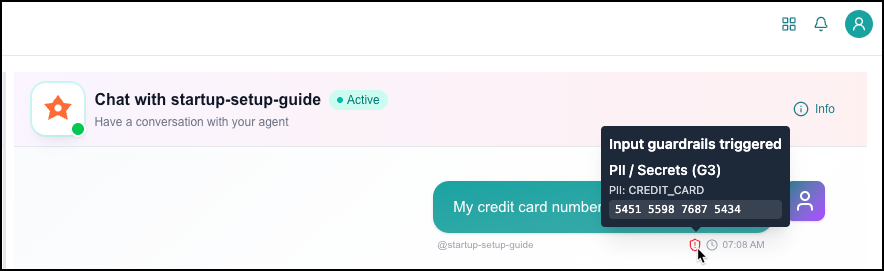
If your message to the agent triggers a guardrail, you can hover the cursor over the red shield icon to see the reason:
Viewing the Agent Execution History
Monitor and analyze your agent's performance by accessing detailed execution information. The platform provides comprehensive execution logs to help you understand how your agent processes requests and delivers results.
To view the agent execution details:
Click the Ellipsis
 icon on the agent card.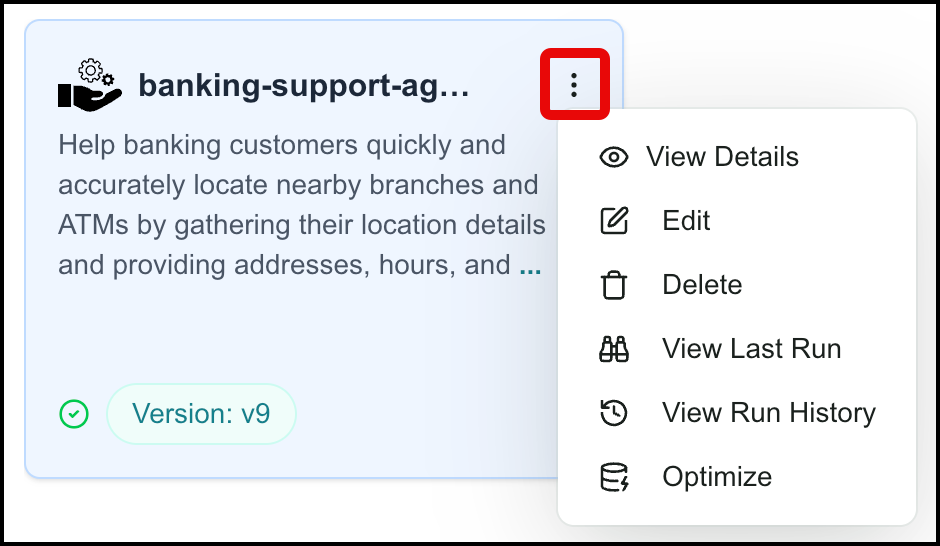
To view the latest execution:
Click View Last Run.
A right-side panel opens, displaying metadata about the last execution, including input/output, execution sequence, time, and other performance metrics.
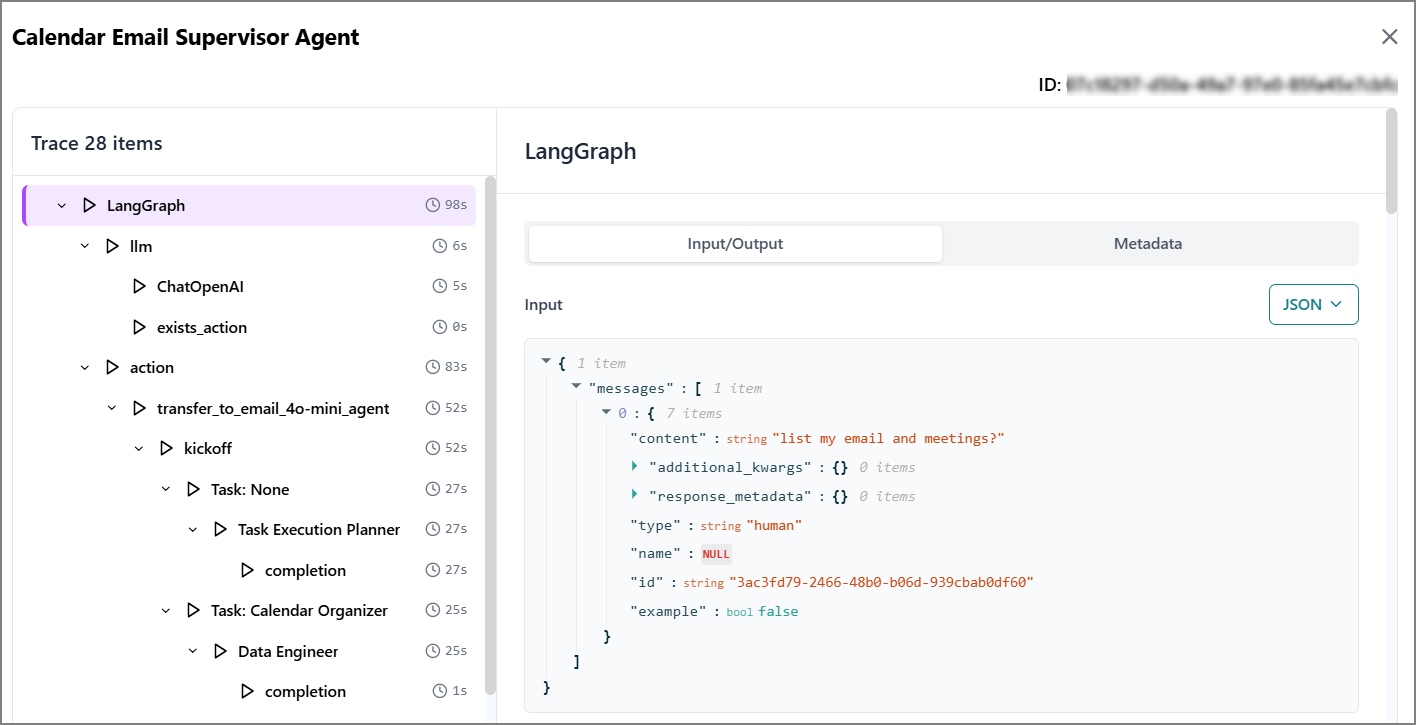
To view all executions:
Click View Run History.
A right-side panel opens, displaying all its execution records for the last five runs.
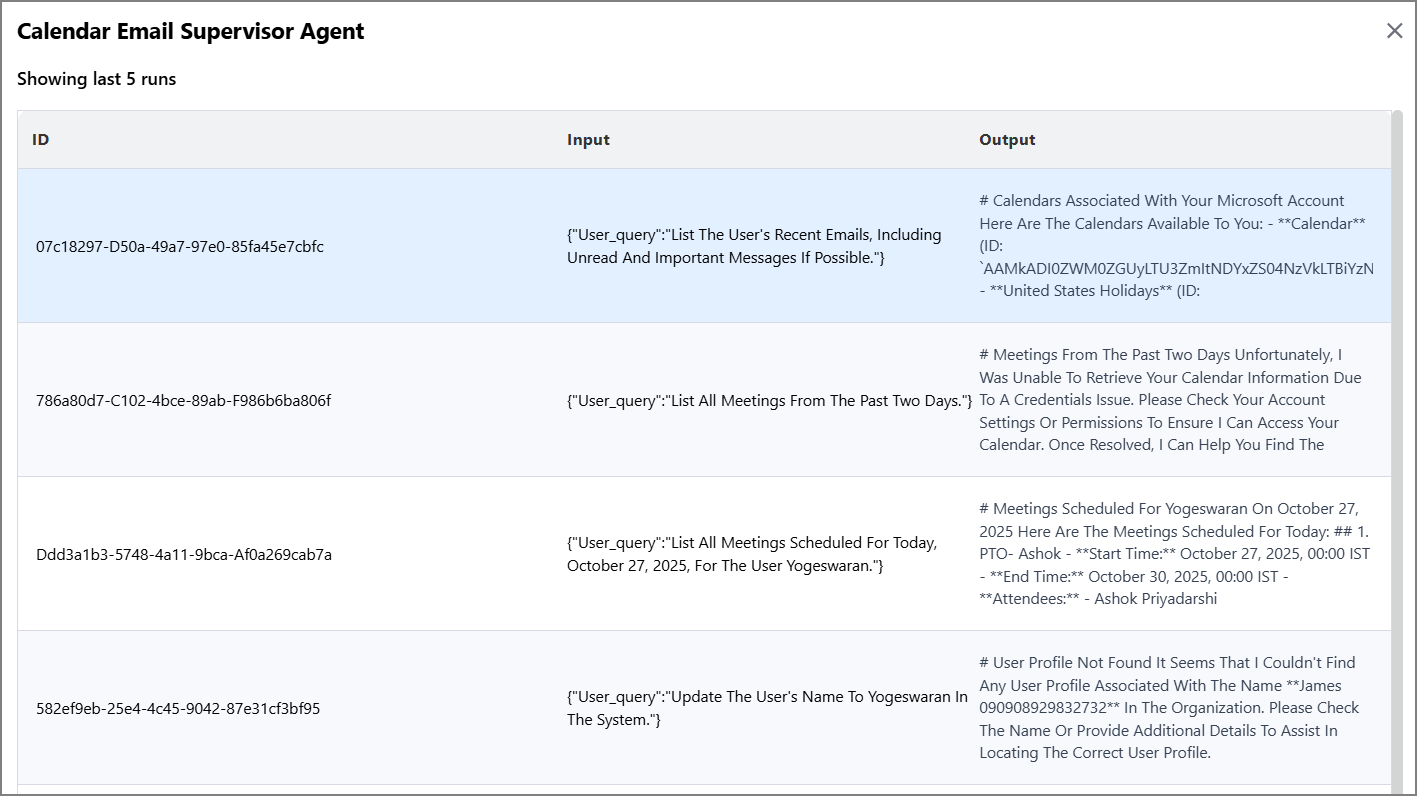
Click any execution record to view its detailed metadata, including input/output, execution sequence, time, and performance metrics.
To view the previous or next execution record, click << or >>.