Viewing Process Categories
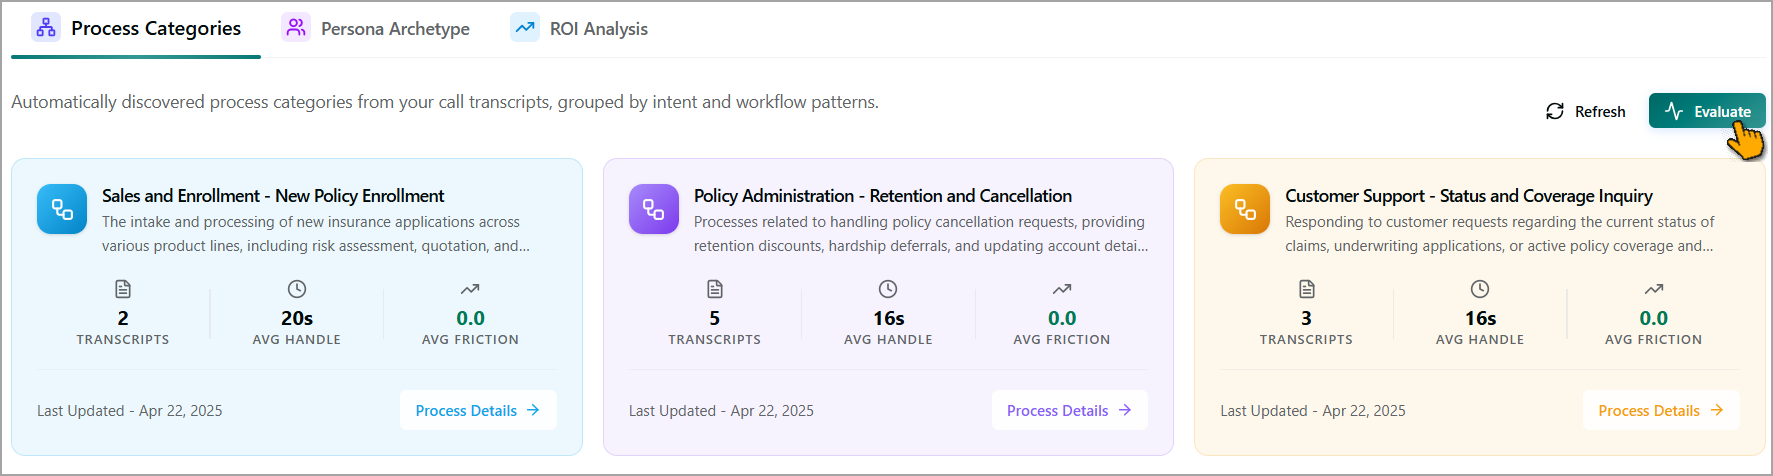
The Process Categories tab displays the process categories automatically identified from the analyzed transcripts. Categories are grouped based on common customer intents and workflow patterns, helping you understand the most common business processes represented in the conversations.
Each process category is displayed as a card containing the following information:
Process Category Name – The name of the discovered process category.
Description – A brief summary of the process represented by the category. Hover over the category description to view the complete summary.
Transcripts – The number of transcripts associated with the category. A higher transcript count indicates that the process occurs more frequently.
Average Handle Time – The average duration of conversations within the category.
Average Friction – Indicates the level of process complexity, customer effort, or confusion identified in conversations within the category. It reflects how difficult or "bumpy" the process is, based on factors such as customer struggle, back-and-forth interactions, repetition, or delays.
The score ranges from 0.0 to 1.0 and is displayed to one decimal place. Lower scores indicate smoother processes, while higher scores indicate greater friction. A score of 0.0 indicates that no significant friction was identified in the analyzed transcripts.
Flows - The number of AI-discovered workflow variations identified for the category. This metric helps you understand the complexity and diversity of the business process.
Last Updated – The date on which the category insights were last refreshed.
Process Details - Click Process Details to explore detailed insights for a category, including workflow analysis, process steps, conversation patterns, and opportunities for process optimization.
Viewing Process Details
The Process Details provides a visual representation of the workflow for the selected process category. It helps you understand the sequence of activities, decision points, review supporting transcripts, and generate a Standard Operating Procedure (SOP).
These activity-level insights can help you identify opportunities to update agent scripts, knowledge articles, or guidance content associated with a specific process step to improve operational efficiency and customer experience.
Click Process Details on the process category card to view process details.
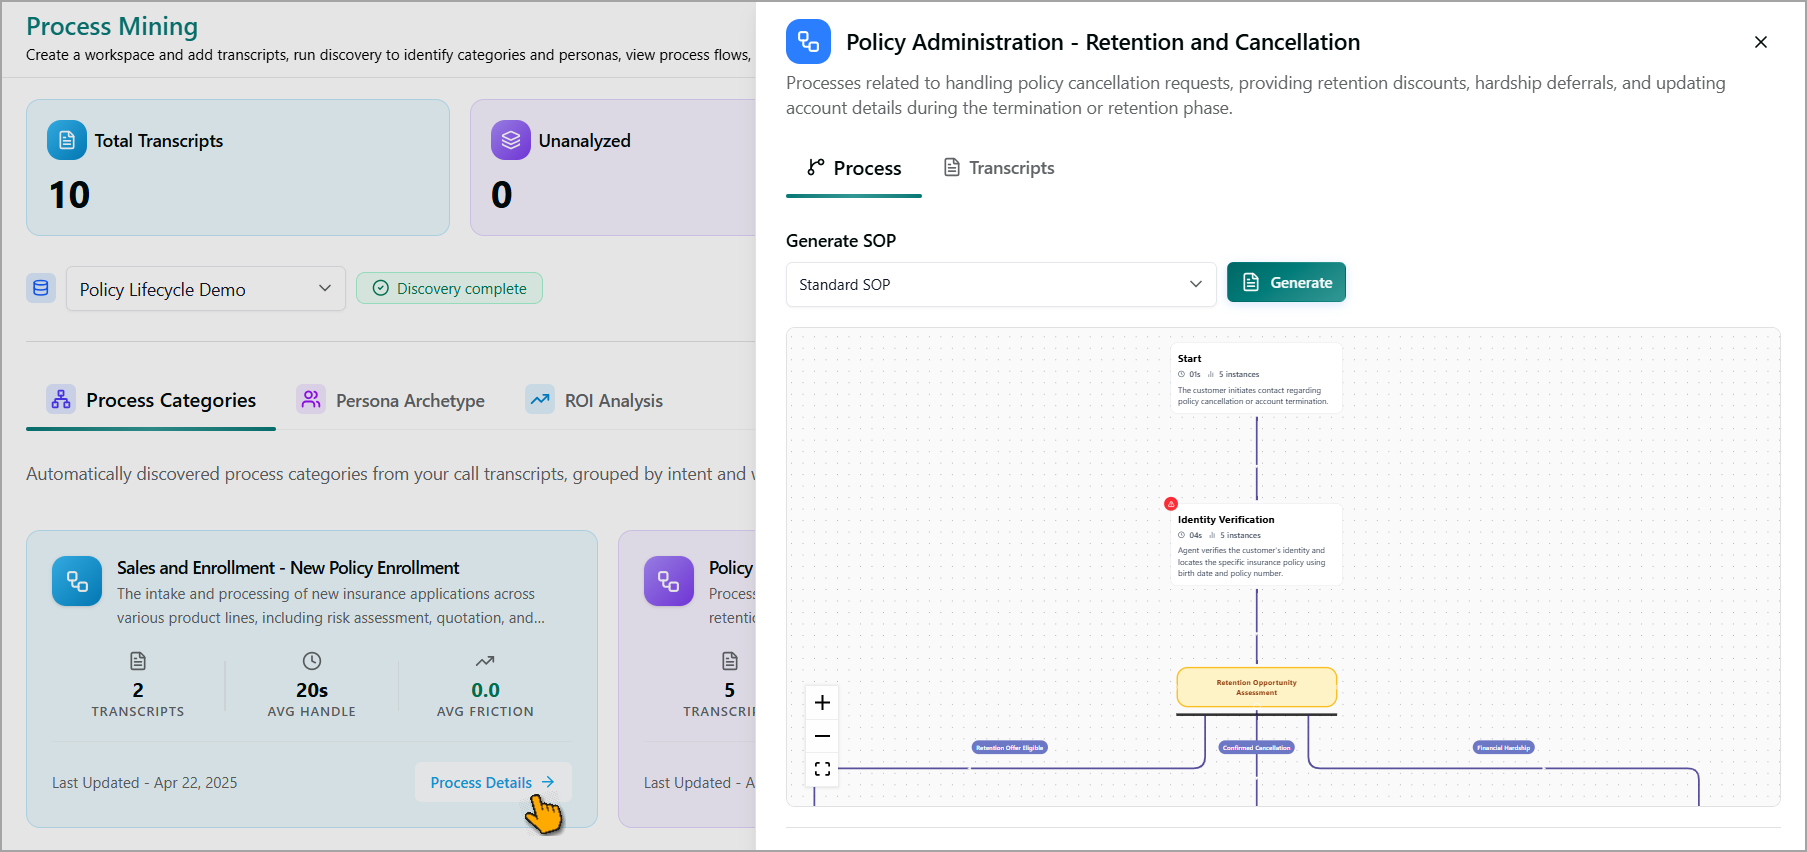
The Process Details panel displays the following information:
Process Category Name – The name of the discovered process category.
Description – A brief summary of the process represented by the category. Hover over the category description to view the complete summary.
Process Tab – Displays a visual process flow generated from the analyzed transcripts. The flow shows the most common steps, transitions, and decision points observed in customer interactions.
Transcripts Tab – Displays the transcripts associated with the selected process category.
Generate SOP – Allows you to generate an SOP based on the discovered workflow. Standard SOP is selected by default in the dropdown.
Process Flow Visualization
The process flow includes:
Start Node – Indicates the beginning of the process.
Process Steps – Individual activities or actions identified from the transcripts.
Decision Points – Points where the process branches into different outcomes or paths.
Transitions – Connections showing the sequence of activities within the workflow.
Instance Count – The number of transcript instances in which a specific step was observed.
Step Duration – The average time associated with a process step, when available.
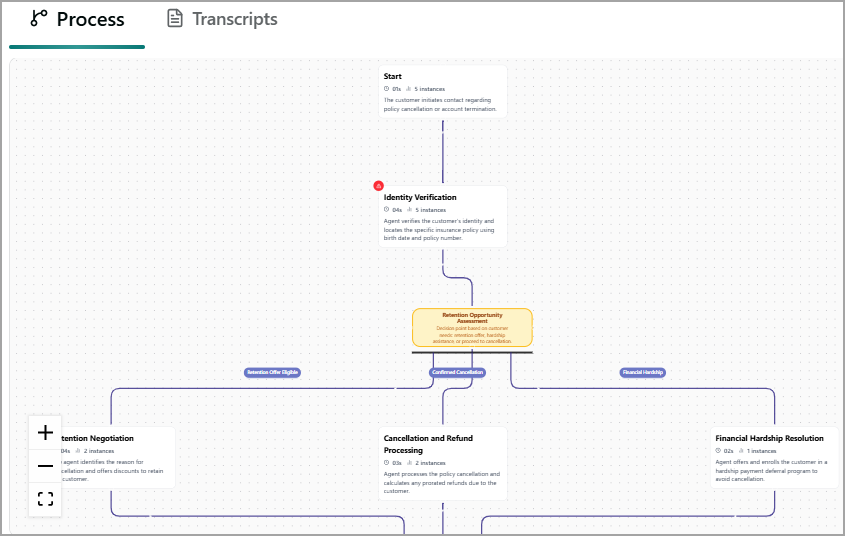
You can use the zoom controls in the lower-left corner of the process flow diagram to zoom in, zoom out, or fit the process flow to the available viewing area.
Viewing a Specific Node Details
The process flow diagram consists of multiple nodes representing the activities, actions, and decision points identified from the analyzed transcripts.
To view details for a specific node, click the node in the process flow diagram. The node details panel is displayed on the right side of the screen. The selected process category name and description are shown at the top of the panel.
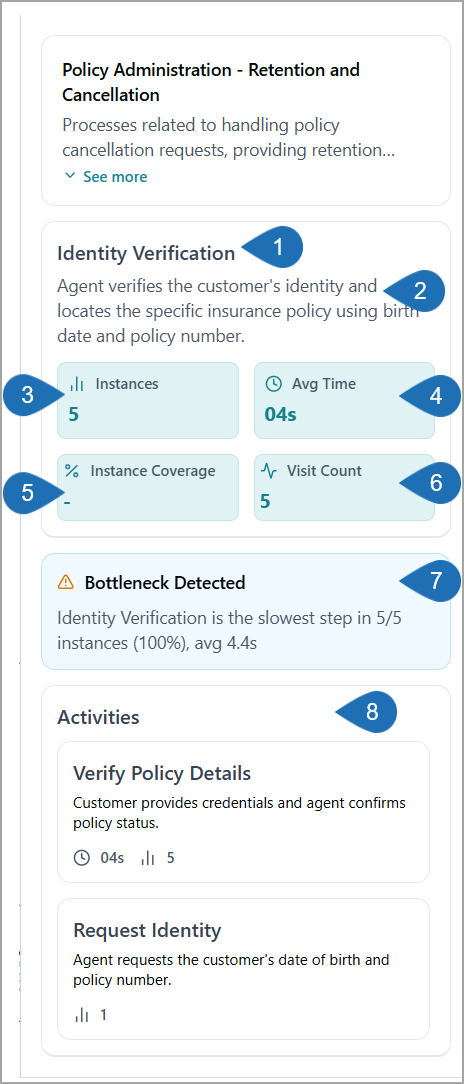
Item | Section | Description |
|---|---|---|
1 | Node Name | The name of the selected process step. |
2 | Description | A summary of the activity represented by the node. |
3 | Instances | The number of times this step appeared across all analyzed transcripts. |
4 | Average Time | The average time spent on the activity across all analyzed instances. |
5 | Instance Coverage | The percentage of transcripts in which this step appears. |
6 | Visit Count | The total number of times the activity was encountered across all analyzed transcripts. |
7 | Bottleneck Detected | Indicates whether the selected activity is a bottleneck in the process. When detected, the panel displays details about the impact of the bottleneck, including the number of affected instances and the average time associated with the activity. For example, Identity Verification is the slowest step in 5 out of 5 instances (100%), with an average duration of 4.4 seconds. It helps to prioritize process improvement efforts and agent coaching. |
8 | Activities | Lists the individual actions associated with the selected node. Each action includes:
|
Creating an Agent from Process Discovery
After analyzing process categories from your transcripts, you can create an AI agent directly from the discovered process without manual SOP authoring.
Click Create from Transcript in the Actions section at the bottom of the Process Detail panel.
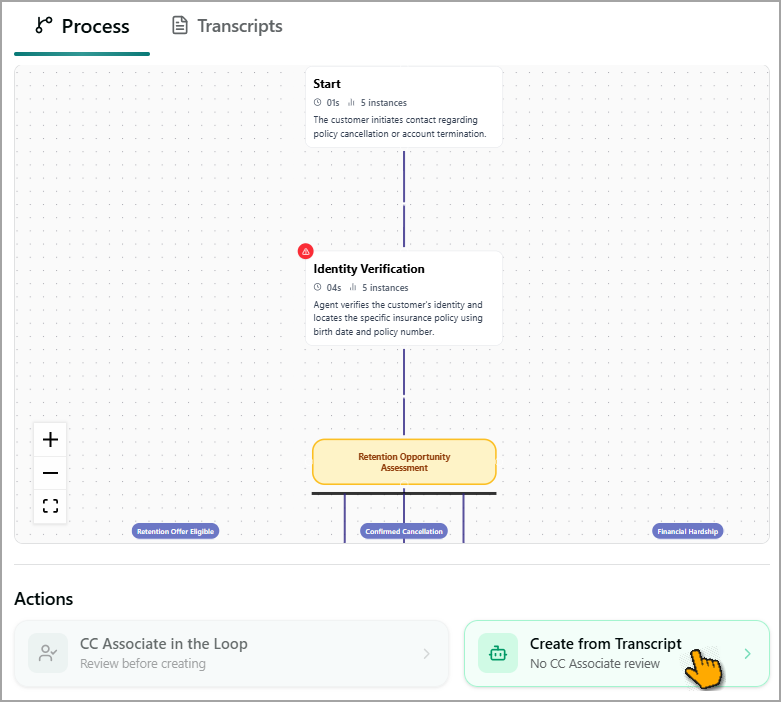
The New Agent panel appears. The Process Discovery is selected as the source by default. This option uses the mined process and transcript data to configure the agent automatically.
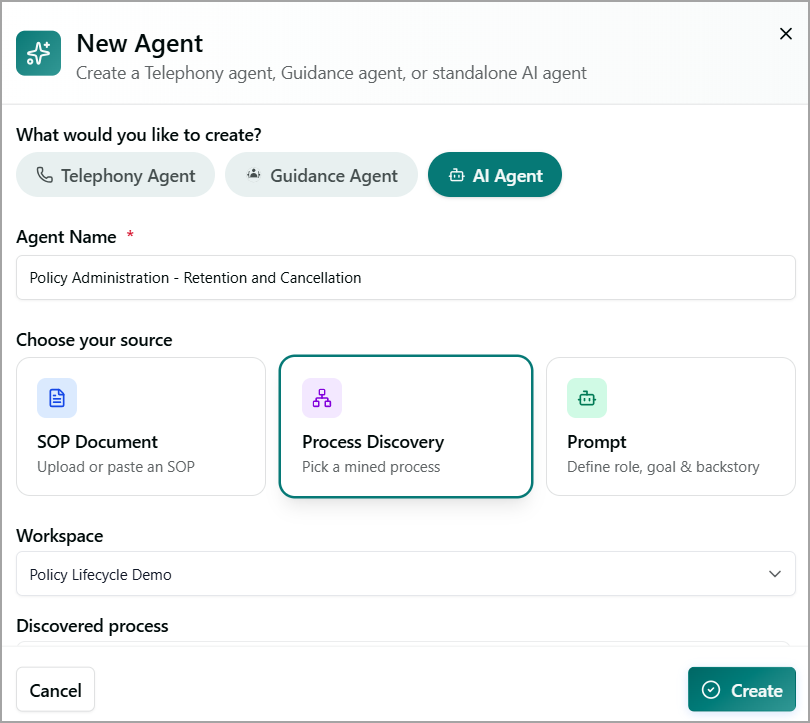
Click Create to analyze the discovered process category and its generated SOP, and automatically create a draft agent configuration. The draft includes the agent's role, goal, backstory, and recommended tools based on the workflow and activities identified during process discovery.
For more details, refer to Create Agent.
Viewing Transcripts
The Transcripts tab allows you to view the call transcripts associated with the selected process category. Reviewing these transcripts helps you understand the customer interactions that contributed to the discovered process patterns and workflow insights.
Click the Transcripts tab from the Process Details panel to view all transcripts that were analyzed and mapped to this process category.
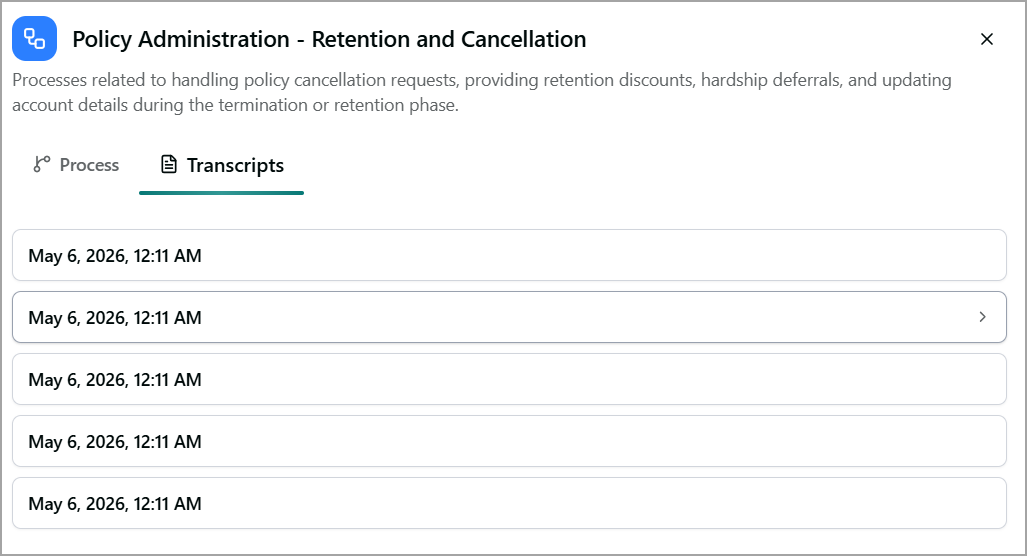
Each transcript row in the list displays the date and time the transcript was uploaded or recorded.
Click the Right > arrow on any transcript row to open and review the full transcript content for that call.
Viewing Flows
The Flows tab displays the AI-discovered workflow variations for the selected process category. Each flow represents a unique sequence of steps identified from the analyzed conversation transcripts, helping you understand how a business process is typically executed.
Note
The number of discovered flows depends on the conversation transcripts analyzed during the process discovery run.
Click the Flows tab from the Process Details panel to view all workflow variations discovered for the selected process category.
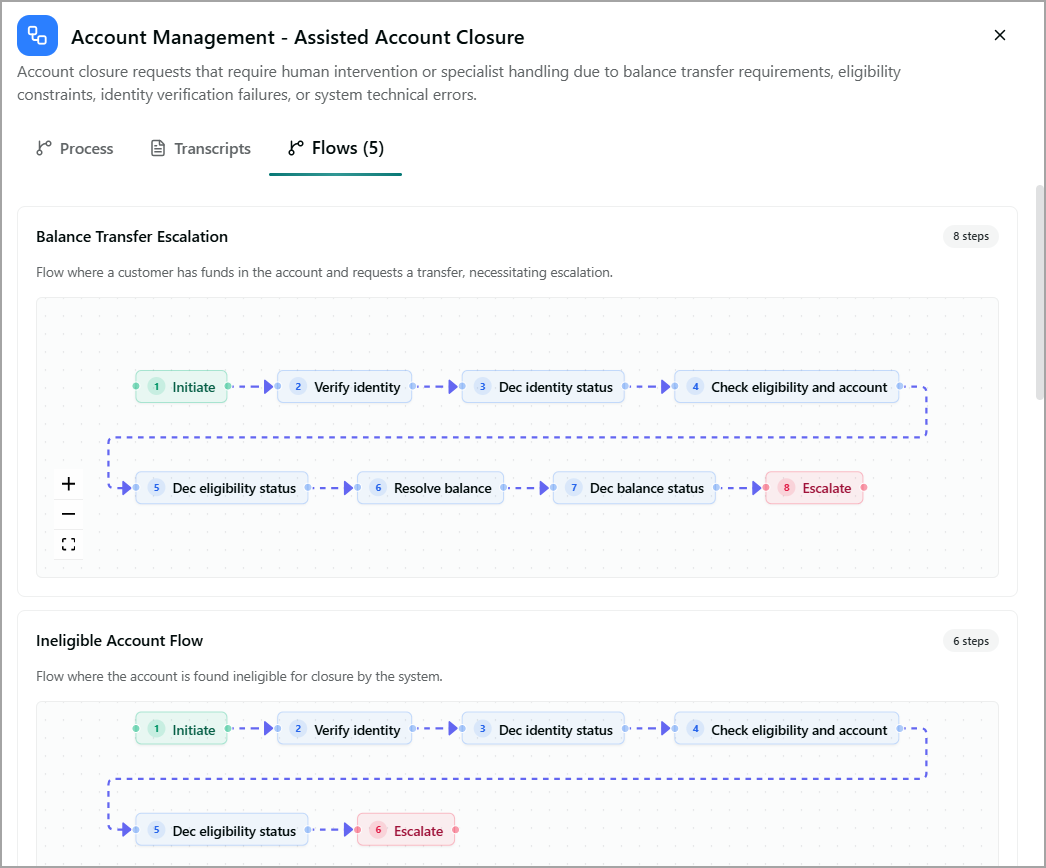
Each flow includes the following information:
Flow name – Displays the name of the discovered workflow.
Description – Provides a brief summary of the workflow represented by the flow.
Step count – Displays the total number of steps in the workflow.
Process diagram – Displays the sequence of activities performed in the workflow. The numbered nodes indicate the sequence of execution from the beginning to the end of the workflow.
Use the controls on the left side of the diagram to navigate the workflow:
Zoom In (+) – Enlarges the workflow diagram for a closer view.
Zoom Out (-) – Reduces the size of the workflow diagram.
Fit to Screen – Adjusts the diagram to fit within the available viewing area.
Evaluating Process Discovery Quality
The Evaluation panel provides aggregated quality metrics across all discovered process categories. Use these metrics to assess the accuracy, consistency, and reliability of process discovery results and to identify areas that may require further review before using the outputs for SOP generation or agent creation.
Click Evaluate on the right side of the Process Categories section to open the Evaluation panel.
The panel displays the results of the most recent evaluation run, along with trend comparisons from previous runs.
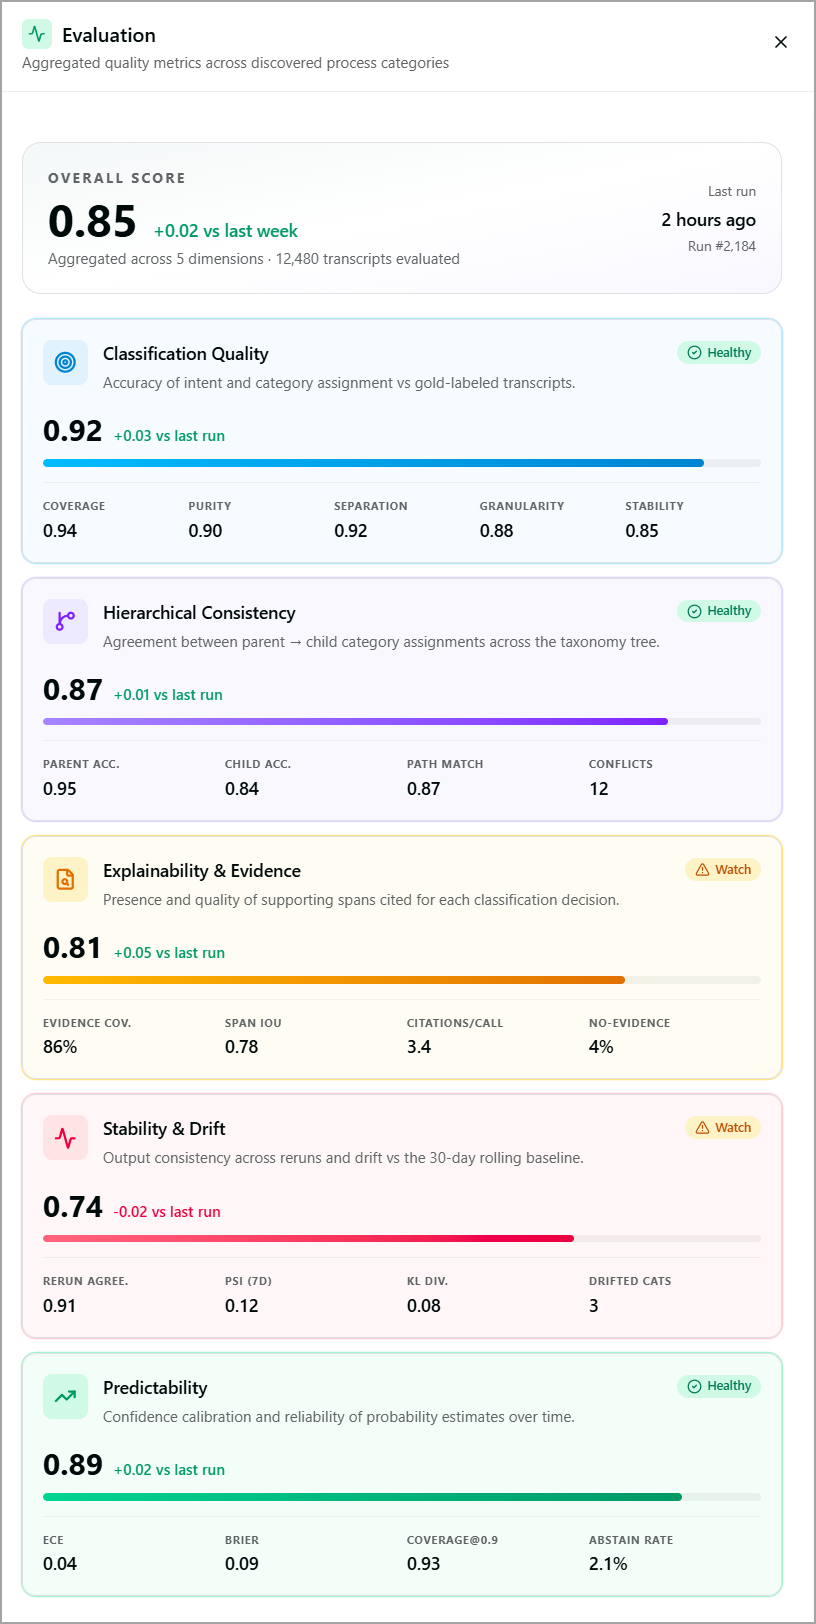
The top of the panel shows a summary of the latest evaluation:
Element | Description |
|---|---|
Overall Score | A composite score is aggregated across all five quality dimensions. Scores range from 0 to 1, where 1 is perfect. |
Trend | Indicates the change in the overall score compared to the previous evaluation run. Positive changes are displayed in green, while negative changes are displayed in red. |
Last Run | The time elapsed since the most recent evaluation was completed, along with the run number. |
Transcripts Evaluated | The total number of transcripts included in the evaluation. |
The overall score is calculated from the following quality dimensions. Each dimension displays a score, trend, status indicator, and supporting metrics.
Classification Quality - Measures the accuracy of intent and category assignment compared to gold-labeled transcripts. The following metrics are displayed:
Metric
Description
Coverage
Proportion of transcripts successfully assigned to a category.
Purity
The degree to which transcripts within a category belong to the same intent.
Separation
How distinctly the system separates different categories from each other.
Granularity
Appropriateness of category specificity.
Stability
Consistency of category assignments across repeated runs.
Hierarchical Consistency - Measures agreement between parent and child category assignments across the taxonomy tree. The following metrics are displayed:
Metric
Description
Parent Accuracy
Accuracy of top-level category assignments.
Child Accuracy
Accuracy of subcategory assignments under each parent.
Path Match
Percentage of transcripts assigned to the correct category hierarchy path.
Conflicts
Number of transcripts with conflicting parent and child category assignments.
Explainability & Evidence - Measures the availability and quality of supporting evidence used for classification decisions. The following metrics are displayed:
Metric
Description
Evidence Coverage
Percentage of classifications supported by at least one evidence citation.
Span IoU
Measures how closely the cited evidence aligns with the expected evidence.
Citations/Call
Average number of evidence citations generated per transcript.
No Evidence
Percentage of classifications generated without supporting evidence.
Stability and Drift - Measures the consistency of process category assignments across repeated evaluation runs and the degree of change in category distributions compared to the 30-day rolling baseline.
Metric
Description
Rerun Agreement
Measures how consistently the system assigns categories when the same transcript is evaluated multiple times.
PSI (7D)
Population Stability Index over the previous seven days. This metric measures changes in the distribution of incoming transcripts. Higher values indicate greater variation from the baseline.
KL Divergence
Measures the difference between the current category distribution and the baseline distribution. Lower values indicate greater stability.
Drifted Categories
The number of process categories whose assignment frequency has changed significantly compared to the baseline.
Predictability - Measures confidence calibration and the reliability of classification confidence scores over time.
Metric
Description
ECE
Expected Calibration Error. Measures the difference between the model's confidence and its actual accuracy. Lower values indicate better calibration.
Brier
Measures the accuracy of probability predictions. Lower values indicate more reliable confidence estimates.
Coverage @ 0.9
Percentage of transcripts for which the model's confidence score is 0.9 or higher.
Abstain Rate
Percentage of transcripts for which the model declined to assign a category because confidence was below the required threshold.
A Healthy status indicates that the model's confidence scores are well-calibrated and reliable.
A Watch status highlights changes in category distributions that indicate shifts in customer interactions, call types, or business processes. Review the identified drifted categories and their impact on process discovery results.