Manager Application
Manager Application Overview
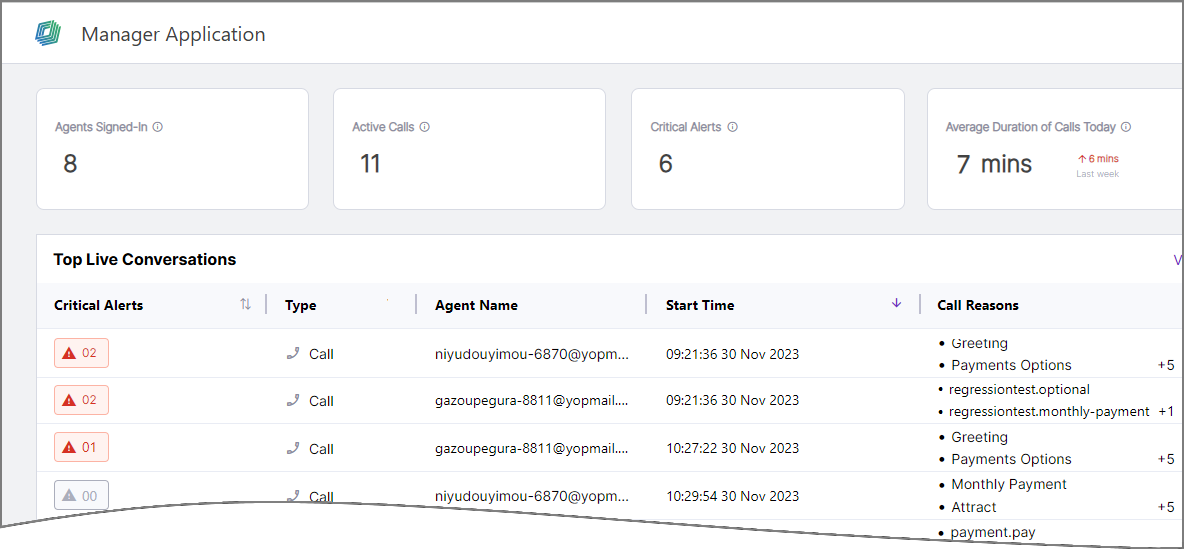
The Real-Time Guidance Agent Manager Application provides a powerful dashboard that leverages both real-time and historic call center information to display a comprehensive, actionable snapshot of call center status. A Manager uses the Dashboard to monitor and assess call center performance.
 |
The Dashboard provides a call center Manager with the following capabilities:
Monitor Contact Center Team Performance in Real Time
Ability to monitor an Agent's activities (Agent Application mirroring) during an active call, including its live transcript
Instant Agent, caller and conversation details
Instant access to conversation summaries
Browse and view a selected live conversation, as well as recently-completed conversations
Support Agent Activities in Real Time
Ability to view Alerts generated during a call, along with key details
Ability to view current and historic trending topics for the call center team
Provide Aggregated Metrics of Current and Past Conversations
Display current performance KPIs in real time
Display KPI running averages over time
Verify Team Adherence to Business Goals in Real Time
Performance efficiency
Adherence to desired culture for customer support
Compliance with enterprise policies and regulatory requirements
A Manager accesses the Dashboard from a standard web browser using their security credentials, like all other Uniphore cloud-based products.
Working with the Manager Application
The Manager Application provides a comprehensive Dashboard that enables a Manager to monitor and assess call center and individual Agent performance.
Uniphore has designed the Manager Application Dashboard to leverage both real-time and historic call center information and provide an intuitive snapshot of real-time call center status.
Accessing the Manager Application Dashboard
Important
Prior to using the Dashboard, the Manager Application must be configured for the account in the X-Console.
The Manager accesses the Dashboard via a standard web browser using their security credentials, like all other Uniphore cloud-based products. Only a X‑Platform user who is assigned the U Applications Supervisor or Manager Role is able to access the Dashboard.
To access, enter the relevant URL in the browser address bar. Typically, you will receive this URL from the Uniphore Account Admin. For details on how this URL is created and shared, click here.
A Manager can monitor only those Agents who have been assigned to them.
Changing the UI Display Language
You can assign the language of the UI components displayed in the Application using several methods, as detailed here.
To instantly change the UI display language in the current browser tab, you can append a language assignment switch to the URL. For example, after appending: &language=es, the application will immediately update its UI components to display their equivalents in the Spanish language. Local runtime translations (i.e., translated Flow elements) are not affected when appending a language assignment switch.
Note
You may need to Refresh the browser page after appending a language switch in order to display the updated UI language.
You must use the standard ISO code for the desired language in the switch. Only languages that are currently supported by the Application will be displayed.
Using the Manager Application Dashboard
Element | Description | |
|---|---|---|
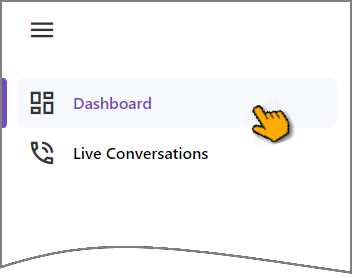
Left Side Navigation Menu Bar | Use the expandable navigation menu on the left side of the page to access components of the Manager Application. To display the expanded menu, roll over the left menu bar with the mouse.
Click the desired menu item to display its component in the browser:
| |
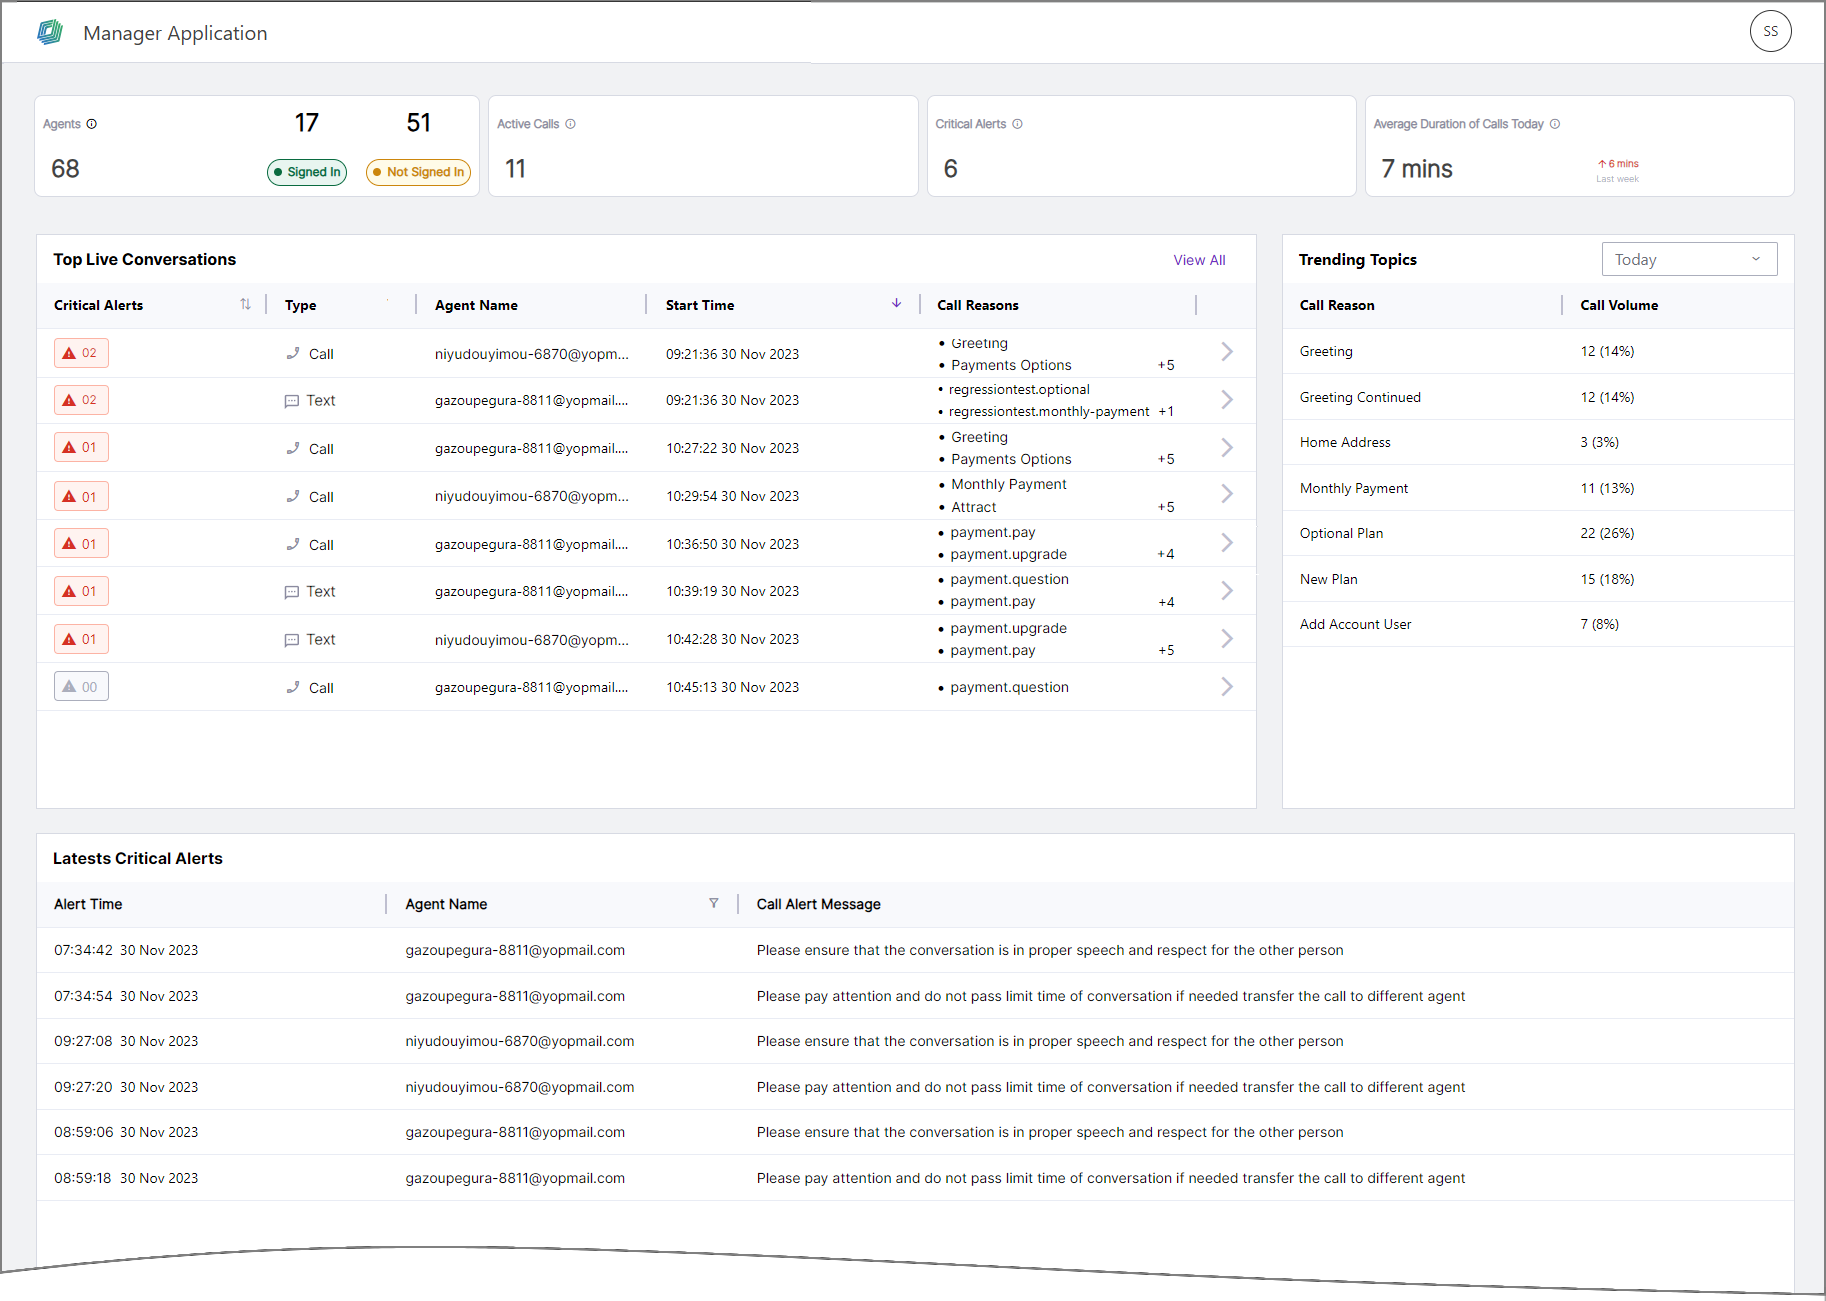
Team Performance Metrics | The metrics displayed at the top of the Manager Application Dashboard reflect only the activities of Agents managed by the current Manager account. All data is updated in real time, with averaged metrics recalculated at 5-minute intervals. 
| |
Top Live Conversations | An abbreviated listing of currently-active and recently-ended Agent conversations, along with key information about each: Critical Alerts , Conversation Type, Agent Name, Start Time and Call Reasons. To view more information about and monitor a specific conversation, click anywhere in the conversation row to display a detailed drilldown panel. You can sort the list by Critical Alerts and Start Time columns. Clicking the Sort icon in a column cycles the list order between ascending You can also filter the listed conversations by their Conversation Type. Clicking the Filter
To filter the list, enable the checkbox for desired choice(s) and click Apply. To remove a filter, click Reset. The Call Reasons field will display a number when more than two Intents have been detected for a selected conversation. To view the additional reasons, hover over the field. A maximum of 10 conversations is displayed in the panel. To view a more complete list of current live conversations, as well as additional information about each, click Live Conversations in the navigation sidebar. Click View All in the upper right corner of the list to display the complete, scrollable list of live conversations. By default, Live Conversation list data is updated every 3 seconds. | |
Trending Topics | A list of the most frequently referenced Call Reasons for all completed conversations, along with trend statistics for each. 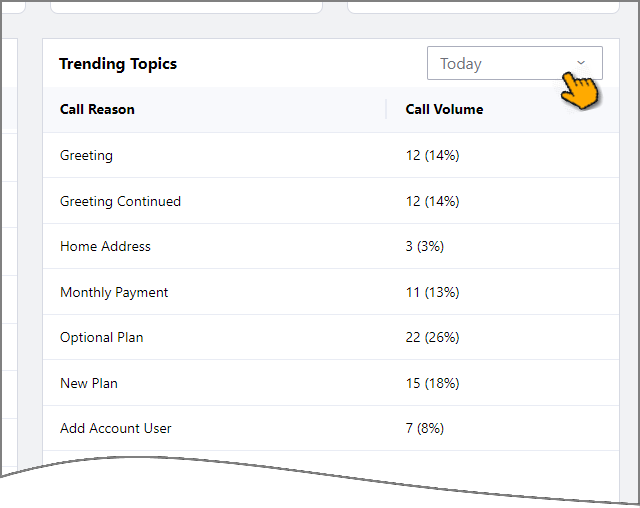 The list is sorted by Call Volume, with the most frequently referenced topic at the top. For each topic, the Call Volume column displays the number of times that the Call Reason was detected, together with its percentage of occurrence relative to all conversations. You can also filter the listed topics to summarize and aggregate them according to original call time. Clicking the Filter
To filter the list, select your desired aggregation choice. By default, Trending Topics list data is updated at 3 minute intervals. | |
Latest Critical Alerts | An abbreviated list of current Critical Alerts triggered by all live conversations, along with key information about each: Alert Time, Agent Name and Call Alert Message. By default, the list is sorted by Alert Time, with the newest Critical Alert at the top. Clicking the Sort icon at the top of the column cycles the list order between ascending You can filter the listed conversations by Agent Name. Clicking the Filter When the list is long, you can locate a specific Agent by entering a few letters from their name in the search box at the top of the popup. By default, Latest Critical Alerts list data is updated every 3 seconds. NoteIn the current release, only Alerts that are configured in U-Assist ACW will be tracked by the Manager Application. | |
Profile and Logout | The current User Profile can be accessed at the upper right corner of the page. To log out of the Manager Application, click the User Profile icon and then click Logout. |


Viewing the Agents Panel
The Agents panel of the Manager Application provides real-time lists of managed Agents who are signed in and not signed in to the AI Agent Assist application, enabling a Manager to quickly assess which of their Agents are currently working.
To open the panel, click the Agents metric at the top of the Manager Application Dashboard.
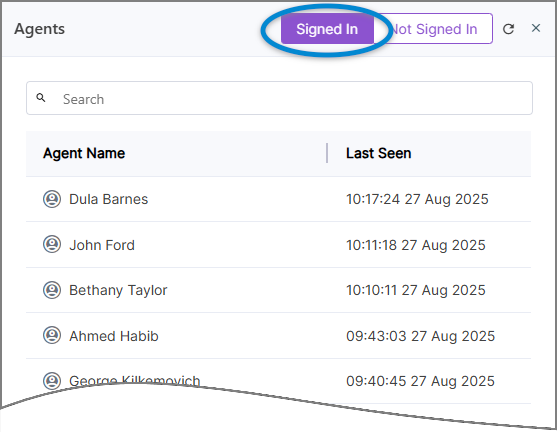
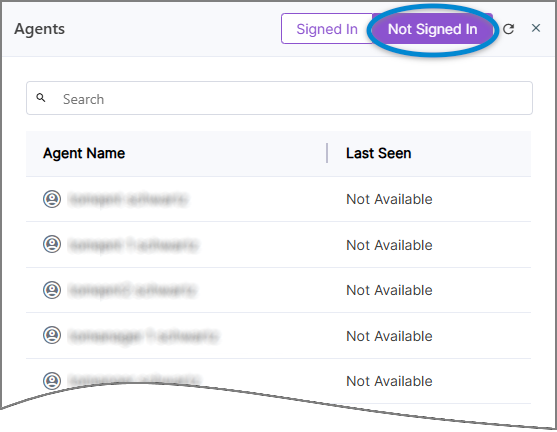
The panel enables a Manager to:
Scroll through a live list of all Agents who are managed by the Manager, according to their current sign-in status.
Check the sign-in status of a specific Agent, using the Search field.
Using the Live Conversations Panel
The Live Conversations panel of the Manager Application provides a running list of all currently-active and recently-ended conversations for all Agents who are managed by the current Supervisor.
From the Live Conversations panel, a Supervisor can assess 'at-a-glance' how all of their Agent's conversations are progressing.
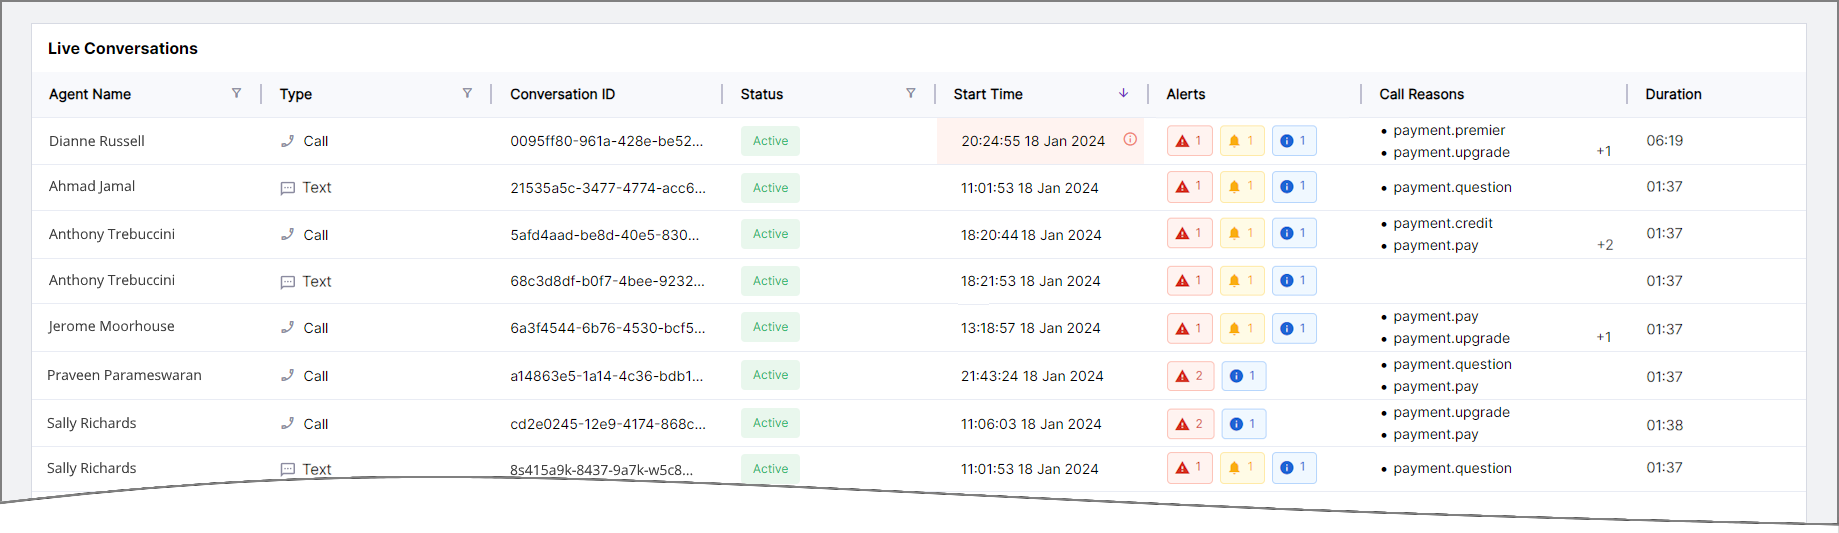 |
The panel enables a Manager to:
Filter and sort the conversation lists in order to focus on one or more conversations that meet specific criteria.
View all available details about a selected conversation.
To access the panel, click Live Conversations in the navigation sidebar.
All Live Conversations panel data is updated every 3 seconds.
Agent Name - The identifying name of the Agent in the conversation. Click the Filter
 icon to limit the display to selected Agents.
Type - The conversation type. Click the Filter
icon to limit the display to one of the following types: Text - Conversations based on text messaging.
 Call - Conversation based on voice communication.
Conversation ID - The unique identifier for the conversation.
Status - The real-time status of the conversation. Click the Filter
icon to limit the display to one or more of the following:Active - The conversation is currently live.
On Hold - The Agent has place the conversation on hold.
Inactive - The conversation is currently not live.
Start Time - The time that the conversation was initiated. By default, the list is sorted in descending order, with the newest conversation at the top. When the duration of a conversation exceeds the current day's average handling time (AHT), this field will be displayed with a light red background and an 'i' icon on its right side.
Alerts - Alert(s) raised during the conversation will be displayed by their type, together with the number of times the Alert type occurred:
Critical - The Agent was notified about an event or status change that requires immediate attention.
Coaching - The Agent was prompted to perform a task based on events or other AI-based data.
Informational - The Agent received information about the caller, their account, or a relevant real-time event.
Call Reasons - The Intents that have been detected in the conversation. When more than two Intents were detected, hovering over this text opens a popup that lists all of them. Click the Filter
icon to limit the display to selected Call Reason(s). The filtered list will contain only those reasons which are currently available in the Conversation list. You can search for a specific Call Reason by entering the value in the Search field found at the top of the filter list.Duration - The current conversation length in minutes and seconds. Click the Sort icon to cycle between ascending, descending and unsorted order.
To make it easy for a Supervisor to focus on conversations that meet specific criteria, columns in the Live Conversations panel can be filtered or sorted.
Clicking the Filter icon in a column displays a popup of all current values available for that column. To filter the list, enable the checkboxes for the values you want to include and click Apply. A Search text box is also available for some filters. To remove a filter, click Reset.
Clicking the Sort icon in a column cycles the list order between ascending  , descending
  and unsorted
  lists. Only one column can be sorted at a time.
Viewing a Live Conversation
A Manager can access key details and monitor any conversation listed in the Live Conversations panel. Conversation details are updated along with the conversation list, to reflect events and activities in real time.
While a conversation is monitored by the Manager, the Agent's activities are not impacted and can continue as usual. The Manager is not able to interact with the Agent or edit the live AI Agent Assist session.
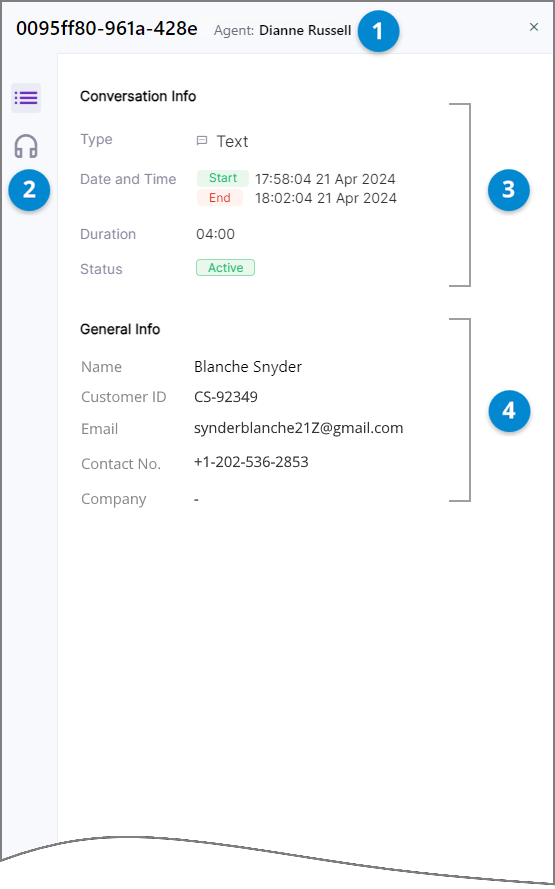
To see real-time details about a specific conversation, click anywhere on its row in the Live Conversations panel, or click the Arrow  icon found at the right side of the row. A drilldown panel will be displayed:
 |
While the Details panel is displayed, clicking on a different Live Conversations row will update the panel display to show details for the newly-selected row.
Item | Feature | Description |
|---|---|---|
1 | Conversation Identifiers | The Conversation ID and Agent Name for the selected conversation are displayed at the top of the panel. |
2 | View Selector | The toolbar on the left side of the panel enables you to switch viewing between:
|
3 | Conversation Info | Displays useful metadata about the selected conversation, including: Conversation Type, Start and End times, Duration and Status. This information is retrieved in real time from the Conversation Service. |
4 | General Info | Displays the data that is generated in the Header Summary during the selected conversation. Typically this includes customer- and call-specific information (e.g., Entity values) that are produced during the conversation. The Header Summary content and formatting is configured according to the Business Process that is used for the conversation. For more details, click here. |
Access Live Conversation Details
To view real-time details collected from the selected conversation in the drilldown panel, in the toolbar on the left, click the Details  icon. This is the default view when the Conversation Details panel is opened, as shown above.
Details displayed in the panel are updated at 3 second intervals while the conversation is live.
Access Live Agent Application
You can view real-time details for a selected Live Conversation via the Live Agent In-Call drilldown panel. This panel provides the Manager with a 'read-only' version that mirrors what the Agent is seeing.
To monitor the AI Agent Assist window for the selected conversation in the drilldown panel, in the toolbar on the left, click the Headphones  icon:
icon:
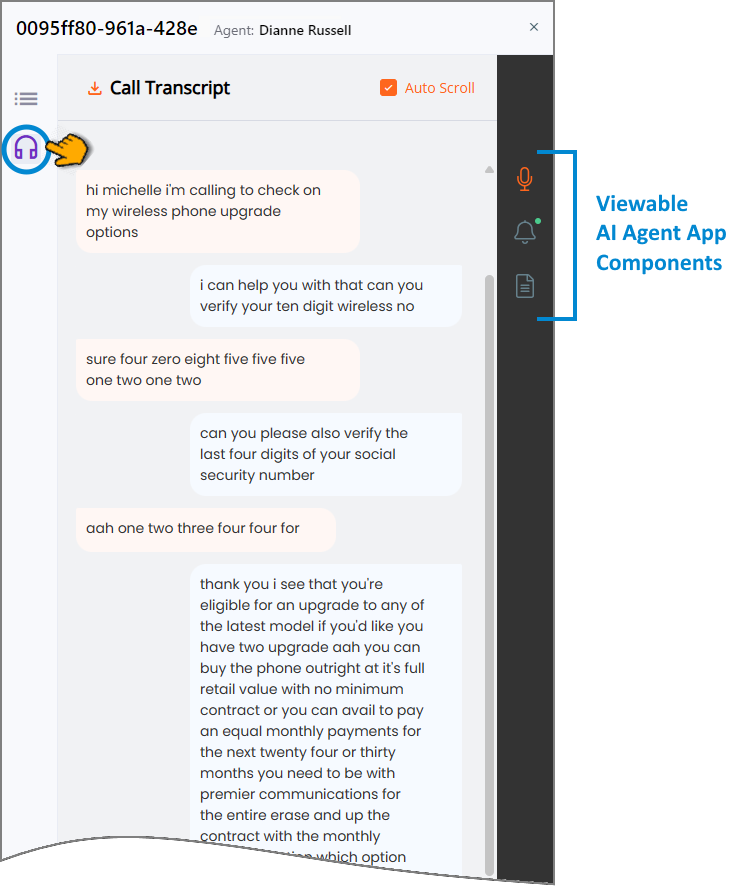
Details that are displayed in this panel will be updated whenever they change in the AI Agent Assist window being monitored.
From the toolbar on the right side of the Live Conversation Monitoring panel, the following AI Agent Assist application components can be selected for viewing during the call:
Call Transcript - The real-time transcript of the conversation that is available to the Agent.
When needed, you can store a call transcript locally by clicking the Download
 icon in the upper right corner of the panel. Downloading is enabled only after the call is finished.
While viewing the Call Transcript, enabling the Auto Scroll checkbox automatically updates the panel to display the most recent sentences from the call. Disabling the checkbox allows you to manually scroll up and down to view other parts of the Call Transcript while a call is still in progress.
Alerts - All real-time notifications that have been sent to the Agent during the conversation.
Call Summary - The information is auto-generated and displayed to the Agent during the conversation. The Manager cannot perform actions on the Summary, however edits by the Agent will be displayed here in real time.
Note
Live conversation data remains accessible in the panel until the conversation no longer appears in the Live Conversations list.
How Call Summary Submission Changes Conversation Status
The Manager Application monitors all incoming calls and call activities by logged-in Agents, including those calls that are being managed using a third-party telephony application (i.e., outside of the AI Agent Assist Application). Conversation Status for each call is updated and displayed in real time in the Live Conversations panel.
Conversation Status for a call typically changes whenever its Call Summary is submitted by the Agent. However, in some scenarios an Agent may not immediately submit the Call Summary at the end of a call, resulting in the display of multiple ACTIVE calls for a single Agent.
The following matrix shows how the Conversation Status for a call is impacted for most common Call Summary submission scenarios.
Scenario Description | Agent UI Type(s) Used | Submit Summary Status | Conversation Status |
|---|---|---|---|
Scenario 1 - Summary is Submitted
| Agent AI Assist App Real-Time Guidance AgentOnly | Manual Submission by the Agent NoteThe agent cannot proceed to the Next Call until the Call Submission is performed. | Before Submission: ACTIVE After Submission: INACTIVE |
Scenario 2 - Summary is Unsubmitted | Agent AI Assist App (Real-Time Guidance Agent) + 3rd Party Telephony App Agent may proceed to a Subsequent Call using the 3rd Party Telephony App | No Manual Submission by the Agent | Status for Initial Call: ACTIVE Status for Subsequent Call: ACTIVE Following a 3rd Party Call End Event(e.g., Hangup), Status for Initial Call: INACTIVE. If Initial Call remains unsubmitted and the Session times out, its Call Status will change to INACTIVE. |
Scenario 3 - Summary is Unsubmitted | Agent AI Assist App (Real-Time Guidance Agent) + 3rd Party Telephony App | No Manual Summary Submitted by the Agent for Initial Call Agent proceeds to a Subsequent Call using the 3rd Party Telephony App. | Status for Initial Call: ACTIVE Status for Subsequent Call: ACTIVE Upon submission of the initial Call Summary, initial Call Status changes to INACTIVE, while a Subsequent Call remains ACTIVE. If a Subsequent Call is still live when the initial Call is submitted, the Subsequent Call will be moved to the AI Agent Assist Application and displayed to the Agent. |
Scenario 4 - Summary is Unsubmitted | Agent AI Assist App Real-Time Guidance Agent Only | No Manual Summary Submitted by the Agent Agent closes the App without properly logging out. | Call Status: ACTIVE Status will change to INACTIVE only after:
|
Scenario 5 - Auto-Submit Summary (Ideal path) | Agent AI Assist App Real-Time Guidance Agent Only | Auto-Submit Setting Selected with 'End of Current Call' Option | Before End of Current Call: ACTIVE After End of Current Call: INACTIVE |
Scenario 6 - Auto-Submit Summary
| Agent AI Assist App Real-Time Guidance Agent Only | Auto-Submit Setting Selected with 'Start of Next Call' Option | First Call:
Next Call:
NoteWhen Agent attempts to log out before Auto-Submit is performed, they will be required to confirm Call Summary Submission before logout. |