Home Page
The Home Page provides a one-stop dashboard for sales reps by consolidating the high-level information from Meetings, Deals, and Improve pages. It includes information on Q score (performance indicator), conversational status, active deals, customer reactions, and upcoming meetings.
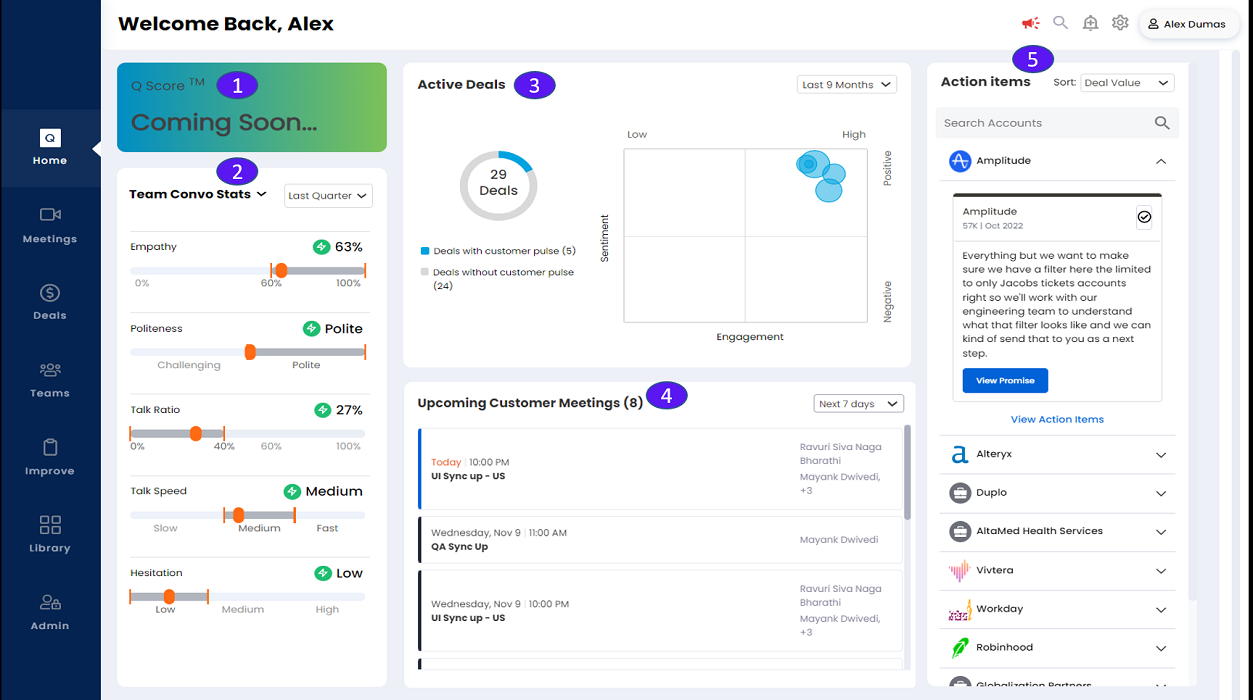
1. Q Score
A machine-generated performance indicator of a sales rep’s techniques.
2. Team Convo Stats
Conversational Stats show individual performance metrics for sellers across meetings in the selected time frame. You can change the date range by using the pull down to view conversational stats during that period. Sales Interaction Agent conversational stats are illustrated in the following dashboards:
Empathy: A measure of a seller’s ability to understand and feel the needs and emotional reactions of the customer. Shows the reps’ empathy toward the customer as a percentage.
Politeness: Shown reps’ politeness toward the customer as low, medium, or high.
Talk Ratio: Talk ratio of rep to customer. The bookended bar shows the ideal talk ratio range.
Talk Speed: Rep talk speed. The bookended bar shows the normal talk speed range.
Hesitation: The bookend bar shows the rep's hesitation level during their customer communications.
3. Active Deals
Shows the total sales deals of a rep which can be filtered for the last 30, 60 days, Last Quarter, Last 6 Months or Last 9 Months.
It displays the number of Deals with customer pulse and Deals without customer pulse in a donut chart.
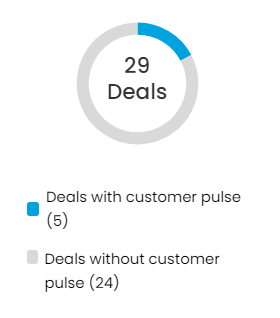
When you click on either of these deals in the pie chart a pop out is displayed as shown below.
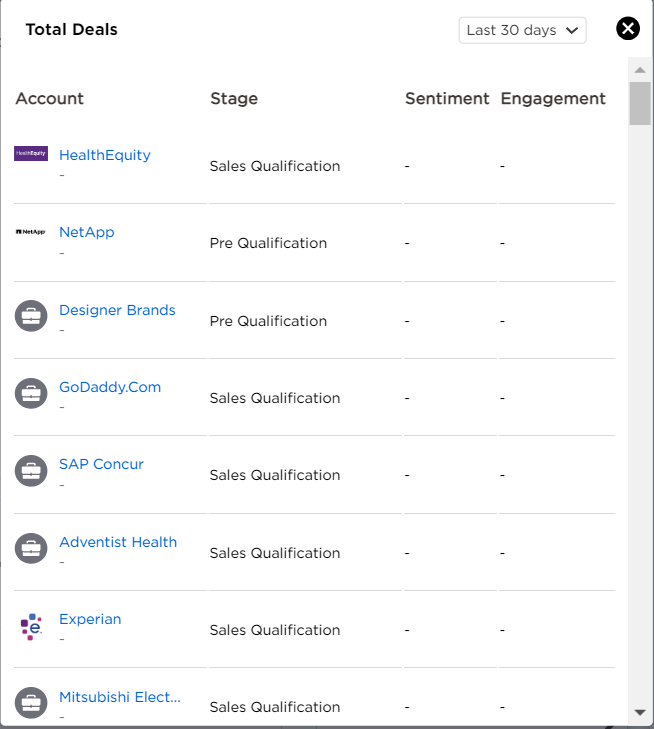 |
Clicking on an individual Account displays its Overview (Deal View) page.
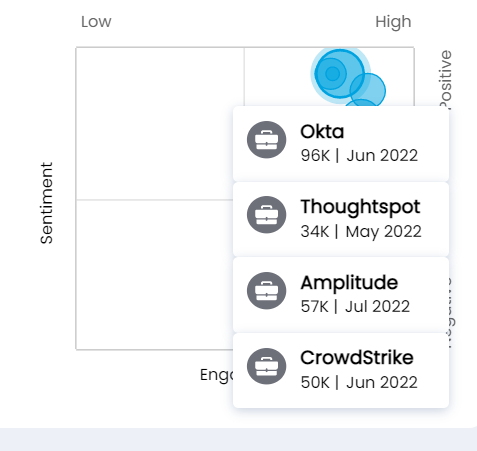
A quadrant chart Venn diagram shows the sentiment and engagement distribution of the active deals. Sentiment is shown on the vertical axis measured as either Positive or Negative. Engagement is shown on the horizontal axis measured as either Low or High.
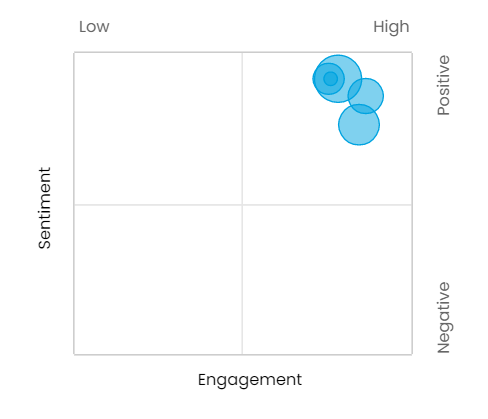
When you click on the bubbles the associated deals are displayed that shows the deal name, deal value, month and year of the deals. Click a deal to view the Overview (Deal View) page.
4. Upcoming Customer Meetings
Shows the upcoming customer meetings by account name, deal amount, close date, deal stage, meeting dates, customer contacts, and customer roles. In addition, below each meeting is the last meeting information (review by clicking the link).
5. Action items
Shows the action items for the rep's various sales accounts. It can be filtered for Deal Value or Close Date.
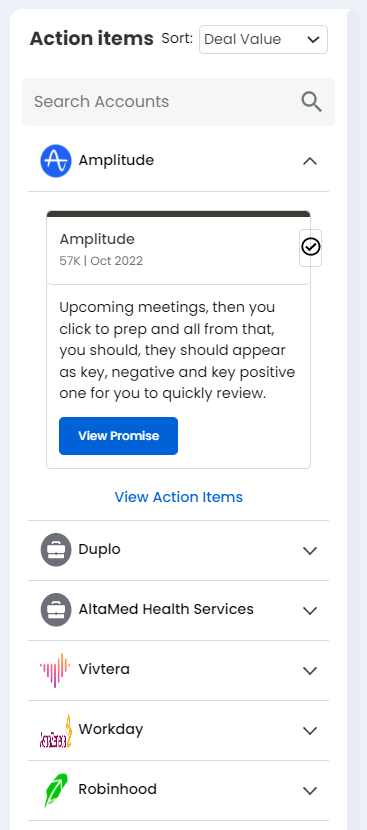
Click the upward/downward arrow to expand/collapse the individual sales accounts. When you click View Promise it takes you to the Meeting Replay page. When you click View Action Items it takes you to the Overview (Deal View) page.