Team Performance Dashboard
This dashboard provides an overview of team performance metrics, including total interactions, average handle time, and average agent performance scores. It provides insights into overall team efficiency and productivity.
Note
The Team Performance Dashboard is available for Administrators, Analysts, Managers, and Quality Analysts.
To View the Team Performance Dashboard:
Navigate to Analytics > Performance > Team Performance.
Date (Required): Select the date range to filter the data according to the time frame. The default filter is Last 15 days.
Organization (Optional): Select Organization to filter data based on the Organization and its hierarchy.
Agent/Supervisor (Optional): Filter by Agent or Supervisor. This filter is also available in All Filters.
Filter by Agent(s): When you select the Agent option from the dropdown, both Agent ID and Agent Name are displayed. 10 Agent details are displayed by default. To list the next set of 10 Agents, click Load more at the end of the dropdown. To find an Agent, enter the Agent's name in the box. This retrieves the Agent details even if they are not available in the currently loaded list. You can select up to 10 agents to filter the data.
Filter by Supervisor: When the Supervisor option is selected from the dropdown, the list of supervisors with Supervisor ID and Name is displayed. Selecting a supervisor displays their dashboard data along with the conversations of the Agents mapped to that supervisor. The results also show the total number of mapped Agents and their names.
Important
The Supervisor Filter is applicable to Administrators, Analysts, Quality Analysts, and Managers (Supervisors).
Direction (Optional): Filter by Call direction: Inbound or Outbound. This filter is also available in All Filters.
Scorecard Evaluation (Required): Filter by the scoring method used for the Scorecard: Auto or Manual. This filter is also available in All Filters.
Click
 to view the selected filters and the number of applied filters. For example, when two filters are applied, 2 is displayed.
Note
Any filter applied outside of All Filters is automatically reflected within it, and changes made within All Filters are reflected in the respective filter.
Agent/Supervisor (Optional): Filter by Agent or Supervisor. This filter is also available outside All Filters.
Facts (Optional): Filter by Fact. Boolean facts and List Facts that are mapped to the selected Scorecard and Evaluation are displayed. When a Boolean Fact is selected, you can set the value to True or False. When a List Fact is selected, you can select one of the available values. The List Facts does not show the predictive values in the dropdown.
Note
You cannot use List Fact filtering with System Facts.
Scorecard (Required): Filter by Scorecard. By default, the Scorecards are arranged alphabetically, and the first Scorecard is selected. This filter is also available outside All Filters.
Scorecard Evaluation (Required): Filter by the scoring method used for the Scorecard: Auto or Manual.
Note
The auto-scoring method is used by default to measure each Scorecard. Therefore, when the Auto filter is selected, all conversation results for the selected Scorecard are displayed.
When the Manual filter is selected, Scorecards that are manually scored and processed on conversations are taken into consideration. Therefore, the dashboard shows significantly scaled-down data.
Evaluation Score (Optional): Filter by Evaluation Score for the selected Scorecard and Evaluation. You can select the operator and enter the Score. To filter by Auto Fail, select the Auto Fail only option. When Auto Fail is selected, Score cannot be applied.
Direction (Optional): Filter by Call direction: Inbound or Outbound. This filter is also available outside All Filters.
End of Call Sentiment (Optional): Filter by End of Call Sentiment. The available options are Positive, Negative, and Neutral. The data is displayed in the dashboard based on the selected option.
Conversation Duration (Optional): Filter by the duration of the Conversation. Select the operator and enter the time in seconds.
Channel (Optional): Filter by Channel: All, Voice, Chat.
Auxiliary Metadata fields (Optional): Filter by Auxiliary Metadata fields of the conversation. Up to 20 auxiliary metadata fields are listed in the dropdown, of which any 15 fields can be used as filters. Select an Auxiliary Metadata field from the dropdown and add one or more values, separated by a semicolon. Click
 to add a field and
  to delete a field.
Note
Any filter applied outside of All Filters is automatically reflected within it, and changes made in All Filters is also reflected in the respective filters.
Reach out to your Uniphore Support Representative to include the set of Auxiliary Metadata fields for the filter.
Note
When the Supervisor filter is applied, All Filters displays Supervisor. Conversely, applying the Agent filter displays Agent in the All Filters section.
To view conversation details, click the Conversations button at the top right corner of the page.
Important
Conversations with fewer than two turns are excluded from the Interactions and other metrics in the Team Performance Dashboard. As a result, you may notice a discrepancy in the number of conversations listed on the Conversations page and the Interactions displayed in the Dashboard for the same period.
Team Performance Dashboard Insights
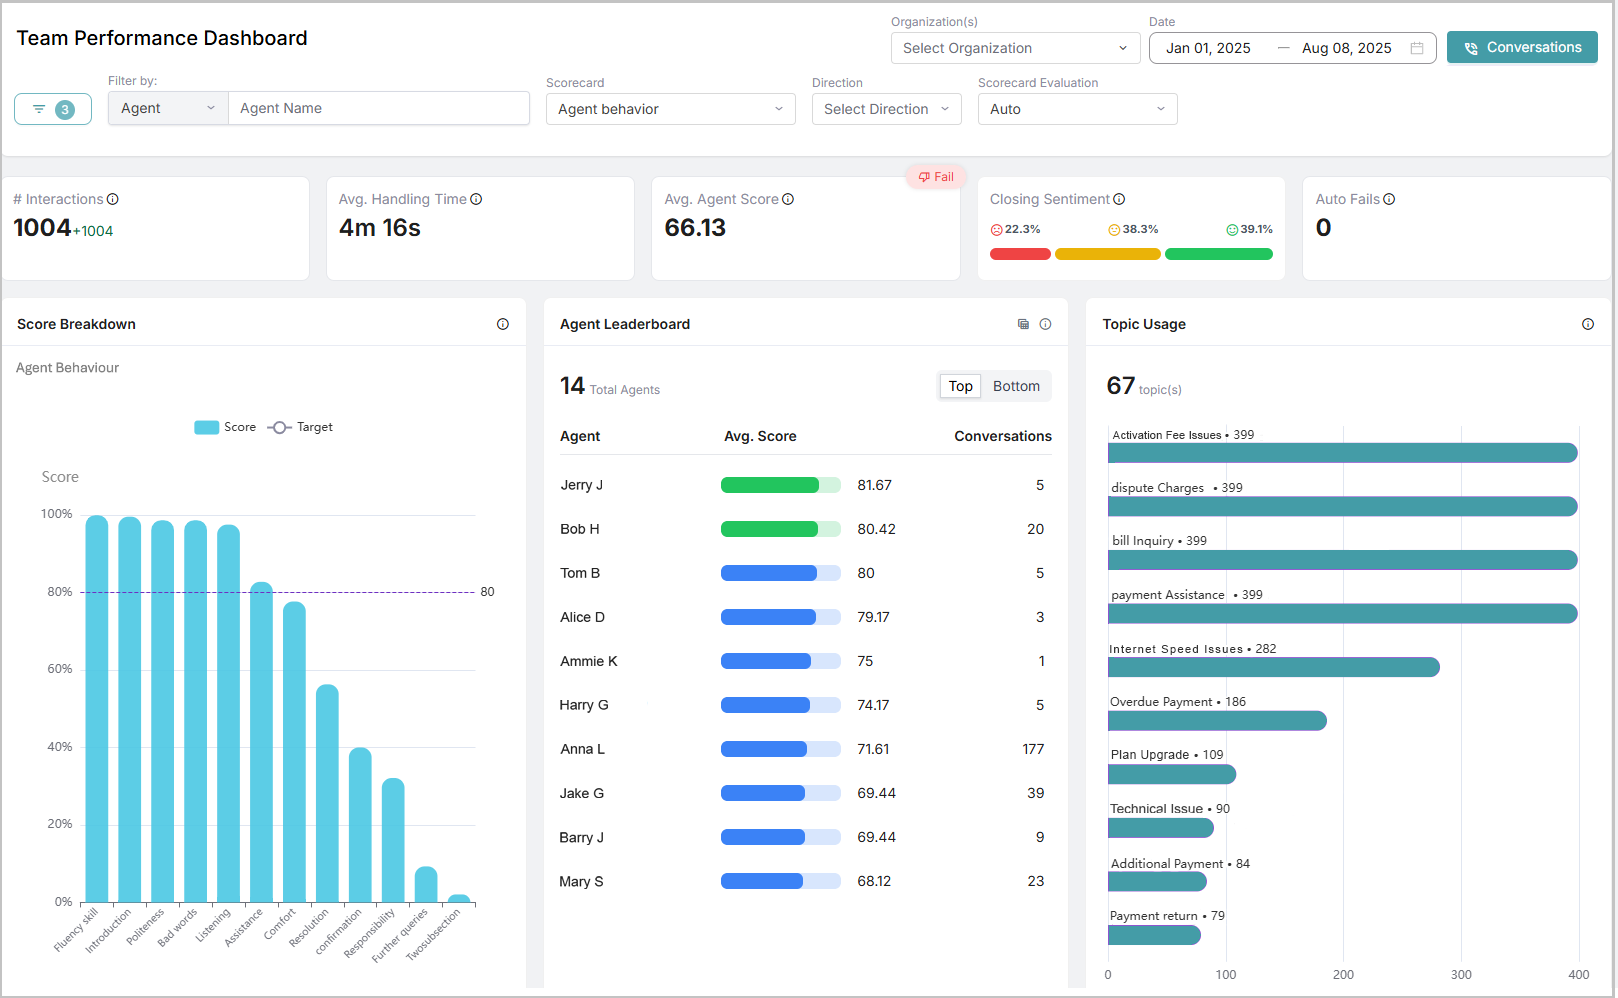
The delta value shows the difference in value between the current and previous date ranges. The current date range is based on the dates selected in the Date filter. For example, if the user selects November 1-5, the previous date range will be October 27-31 (the same number of days before the selected period).
In the Team Performance dashboard, the components Interactions, Average Handle Time, Average Agent Performance, and Auto Fails display data from the selected date range in bold, with a Delta value in smaller text.
Color Coding
If the team performs better than the previous range, the Delta value appears in Green with a + sign.
If the team performs worse, the Delta value appears in Red with a - sign.
Note
When one or more elements (bars or slices) of one or more charts (bar graph or pie chart) are selected, the Interactions, Average Handle Time, Average Agent Performance, and Customer Sentiments values will be changed accordingly.
For example, when you select Soft Skills in the Score Breakdown chart, the values of Interactions, Average Handle Time, Average Agent Performance, and Customer Sentiments will be based on that selection.
Name | Description |
|---|---|
Interactions | Total number of conversations for the selected date range and scorecard. |
Avg. Handle Time | Average handle time of conversations. |
Avg. Agent Performance | Average performance score of the agents. |
Closing Sentiment | Percentage of each sentiment across all conversations. The sentiments are categorized as follows: Positive Neutral Negative ImportantConversations with fewer than two turns are excluded from the Closing Sentiment calculation. As a result, the Closing Sentiment for these conversations appears as NA in the conversation listings. |
Auto Fails | Total number of auto-failed conversations. For more information on Auto Fail, refer to Create Question. |
Score Breakdown | The Team's average score for the selected Scorecard and its Pass criteria. Drill down to see the scores of the subsection and questions. |
Agent Leaderboard | Displays the top and under-performing agents along with the total number of Agents, Agent names, Average Score, and number of scored conversations in each category. Click Top or Bottom to view the list of top and under-performing agents, respectively, in both compact and expanded views. Click the Expand icon to see the Agent Leaderboard widget in an expanded view. When you click on an agent's name, it is applied as a filter, and the dashboard data is displayed accordingly. Click again on the agent's name to remove the filter. The color of the average score bar is based on configurable thresholds. The default configuration is Green for scores above 80, Blue for between 50 and 80, and Red for scores below 50. |
Topic Usage | Top 10 frequently discussed topics in conversations. Also, shows the overall count for the selected filter along with each topic's count. |


