Topic Discovery Dashboard
The Topic Discovery Dashboard identifies and analyzes trending topics over a selected date range. It features agent key phrases, customer key phrases, and conversation drill-downs to provide detailed insights into specific topics and trends.
To View the Topic Discovery Dashboard
Navigate to Analytics > Discovery > Topic Discovery.
Select the date range to filter the data within that specific time frame. The default filter is the Last 15 days.
Select the Organization to filter data by the Organization and its hierarchy. It is an optional field.
Agent/Supervisor (Optional): Filter by Agent(s) or Supervisor. This filter is also available in All Filters.
Filter by Agent(s): When you select the Agent option from the dropdown, both Agent ID and Agent Name are displayed. 10 Agents are displayed by default. To list the next set of 10 Agents, click Load more at the end of the dropdown. To find an Agent, enter the Agent's name in the box. This retrieves the Agent details even if they are not available in the currently loaded list. You can select up to 10 agents to filter the data.
Filter by Supervisor: When the Supervisor option is selected from the dropdown, the list of supervisors with their Name and Email ID is displayed. Selecting a supervisor displays their dashboard data, including conversations from all Agents, regardless of the supervisor to which they are assigned. The results also show the total number of mapped Agents and their names. Only one Supervisor can be selected at a time.
Note
The Agent(s) filter will not be displayed when the user is logged in as an Agent, as agents can only access their own data.
The Supervisor Filter is applicable to Administrators, Analysts, Quality Analysts, and Managers (Supervisors).
Direction (Optional): Filter by Call direction: Inbound or Outbound. This filter is also available in All Filters.
Click
 to filter data by Agent(s) and Call Direction. The All Filters shows the selected filters and the number of applied filters. For example, when two filters are applied, 2 is displayed.
Note
Any filter applied outside of All Filters is automatically reflected within it, and changes made within All Filters is reflected in the respective filter.
Agent/Supervisor (Optional): Filter by Agent(s) or Supervisor.
Direction (Optional): Filter by Call direction: Inbound or Outbound. This filter is also available outside All Filters.
End of Call Sentiment (Optional): Filter by End of Call Sentiment. The available options are Positive, Negative, and Neutral. The data is displayed in the dashboard based on the selected option.
Conversation Duration (Optional): Filter by the duration of the Conversation. Select the operator and enter the time in seconds.
Channel (Optional): Filter by Channel: All, Voice, Chat.
Auxiliary Metadata fields (Optional): Filter by Auxiliary Metadata fields of the conversation. Up to 20 auxiliary metadata fields are listed in the dropdown, of which any 15 fields can be used as filters. Select an Auxiliary Metadata field from the dropdown and add one or more values, separated by a comma. Click
 to add a field and
  to delete a field.
Note
Any filter applied outside of All Filters is automatically reflected within it, and changes made in All Filters is also reflected in the respective filters.
Reach out to your Uniphore Support Representative to include the set of Auxiliary Metadata fields for the filter.
To view conversation details, click Conversations on the top right corner of the page.
Note
The Filters label displays the count of the selected filters. For example, when two filters are applied, 2 is displayed in the filter label.
Cross Filter
Cross filtering enables data filtering by selecting multiple metrics and chart components within the dashboard.
When you select a topic in one chart, only that topic appears in the other charts. For example, when you select Payment Assistance in the Trending Topics chart, then that topic is only shown in the Topic Breakdown and Topic Trends charts.
Note
The selected topic is shown under the dashboard name.
Important
Conversations with fewer than two turns are excluded from the Topic Discovery Dashboard metrics. As a result, you may notice a discrepancy in the number of conversations listed on the Conversations page and the metrics displayed in the Dashboard for the same period.
Topic Discovery Dashboard Insights
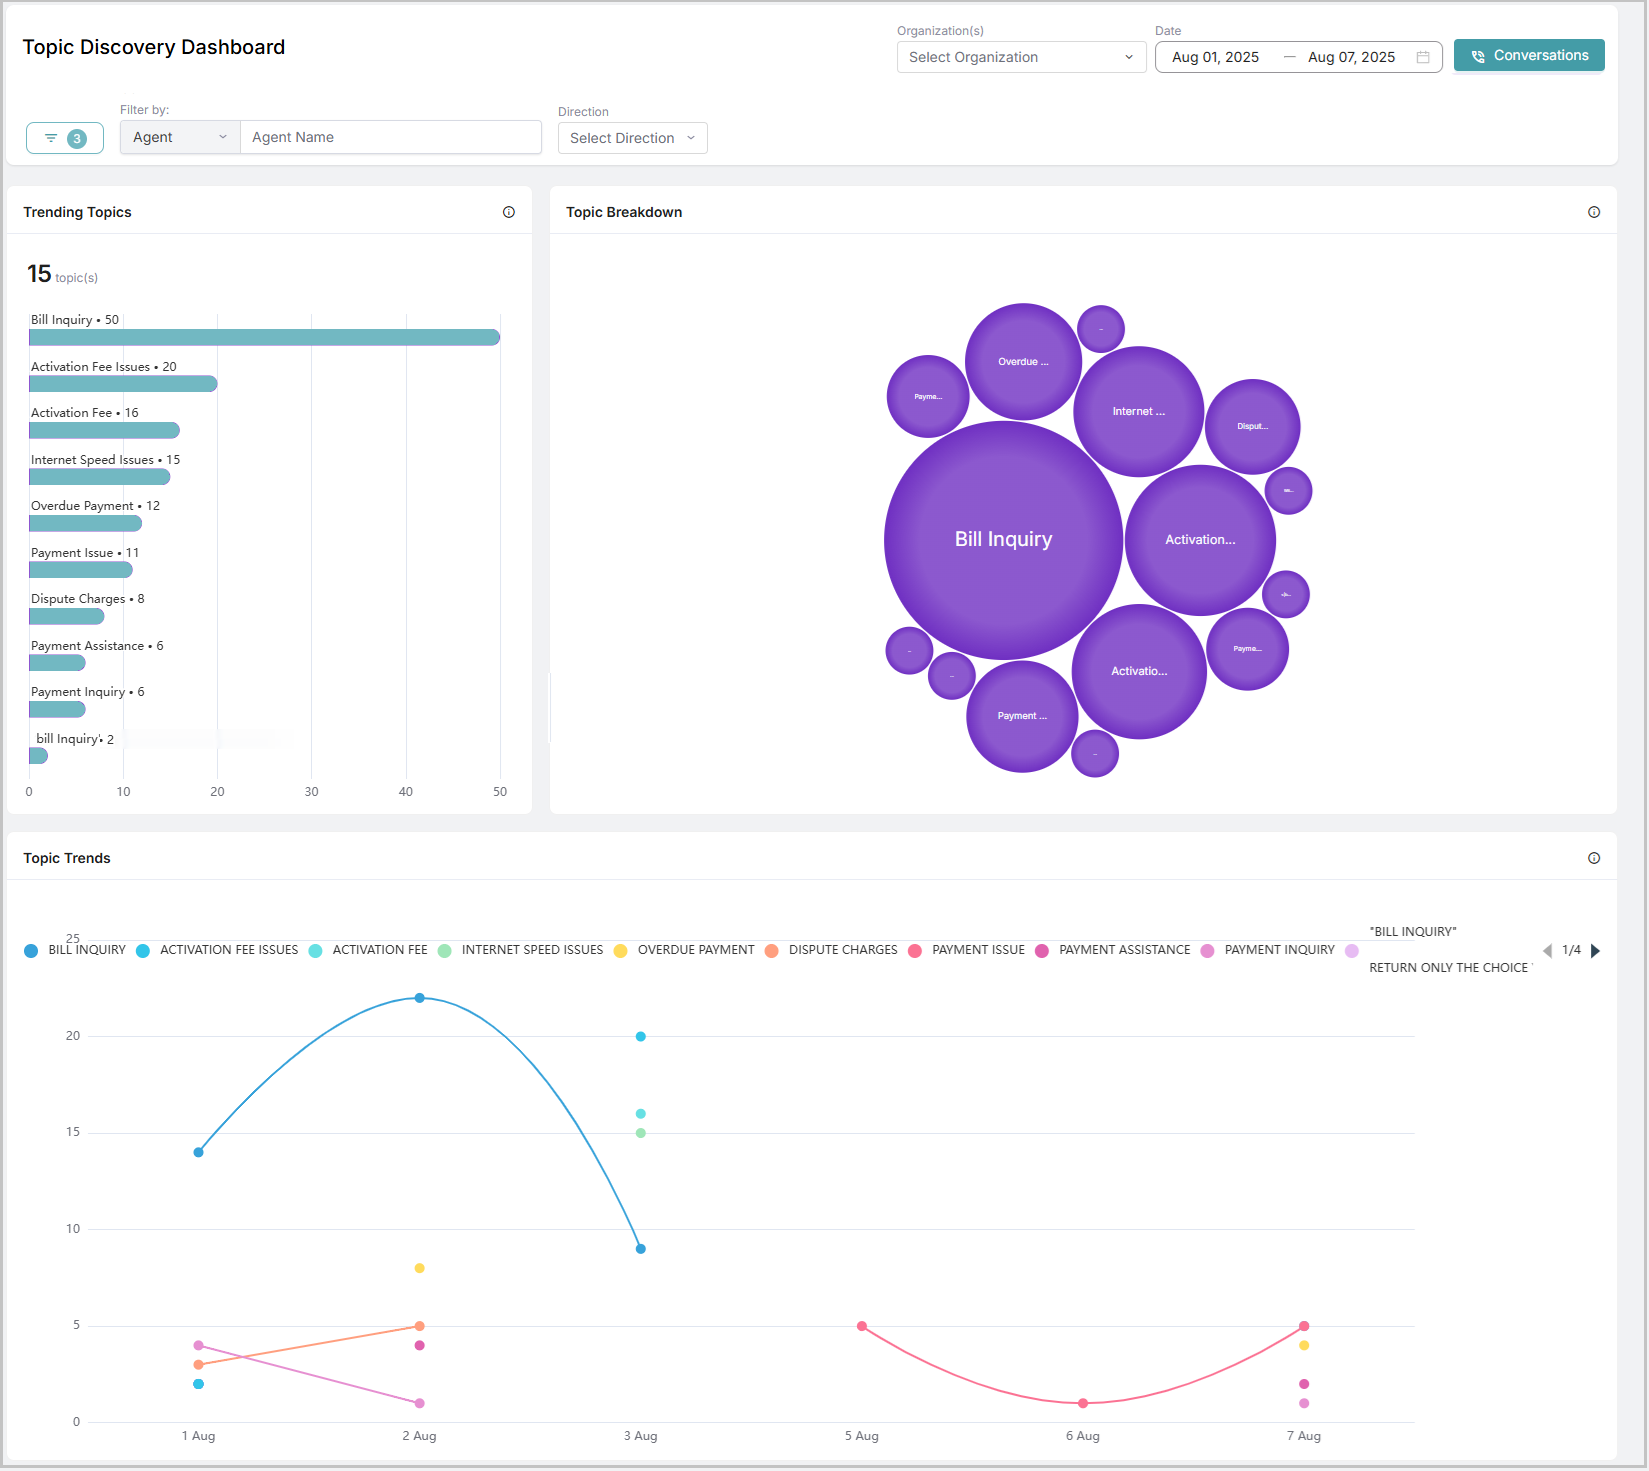
The Topic Discovery Dashboards display insights on Trending Topics, Topic Breakdown, and Topic Trends across three charts.
Name | Description | |
|---|---|---|
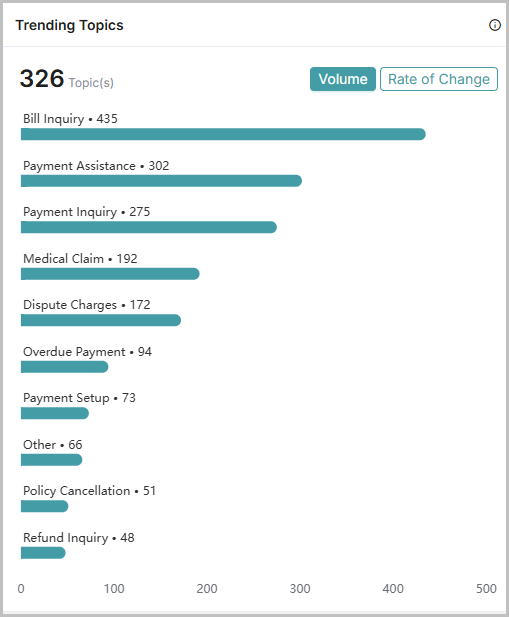
Trending Topics: Volume | Displays the top 10 most discussed topics in the Conversations, their count, and the total number of topics discussed. The result is based on the filters selected.
| |
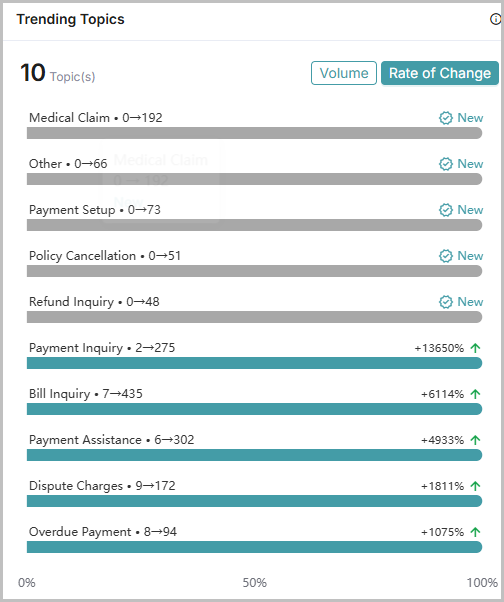
Trending Topics: Rate of Change | Displays actively growing or declining topics (10 topics) along with their percentage change. Topics appearing for the first time are marked with a New label. An upward green arrow (↑) indicates an increase in conversation volume, while a downward red arrow (↓) indicates a decrease.
| |
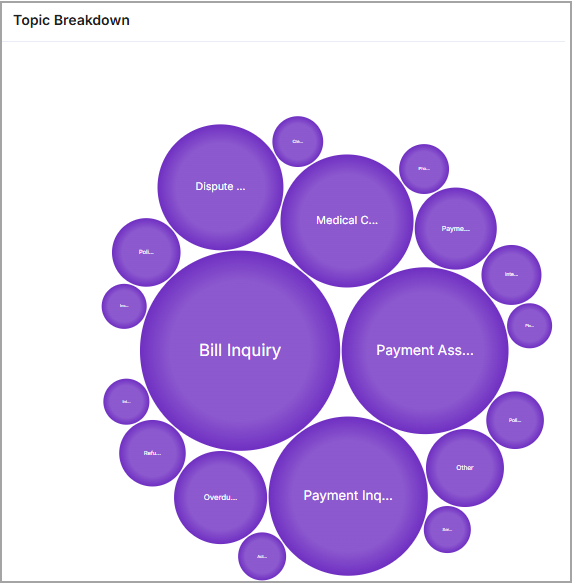
Topic Breakdown | Displays topic details categorized by Agent and Customer key phrases. To explore a topic in detail, right-click the bubble and select either Drill down to agent key phrases or Drill Down to customer key phrases. The respective key phrases are displayed. Hover over a topic name to view its Total Conversation Count. To view the list of conversations in which a specific key phrase is mentioned, click the desired key phrase and select Conversations. The list of conversations is displayed in a new window.
| |
Topic Trends | Graphical representation of trending topics. Mouse over a specific date to view the count for each trending topic on that day. 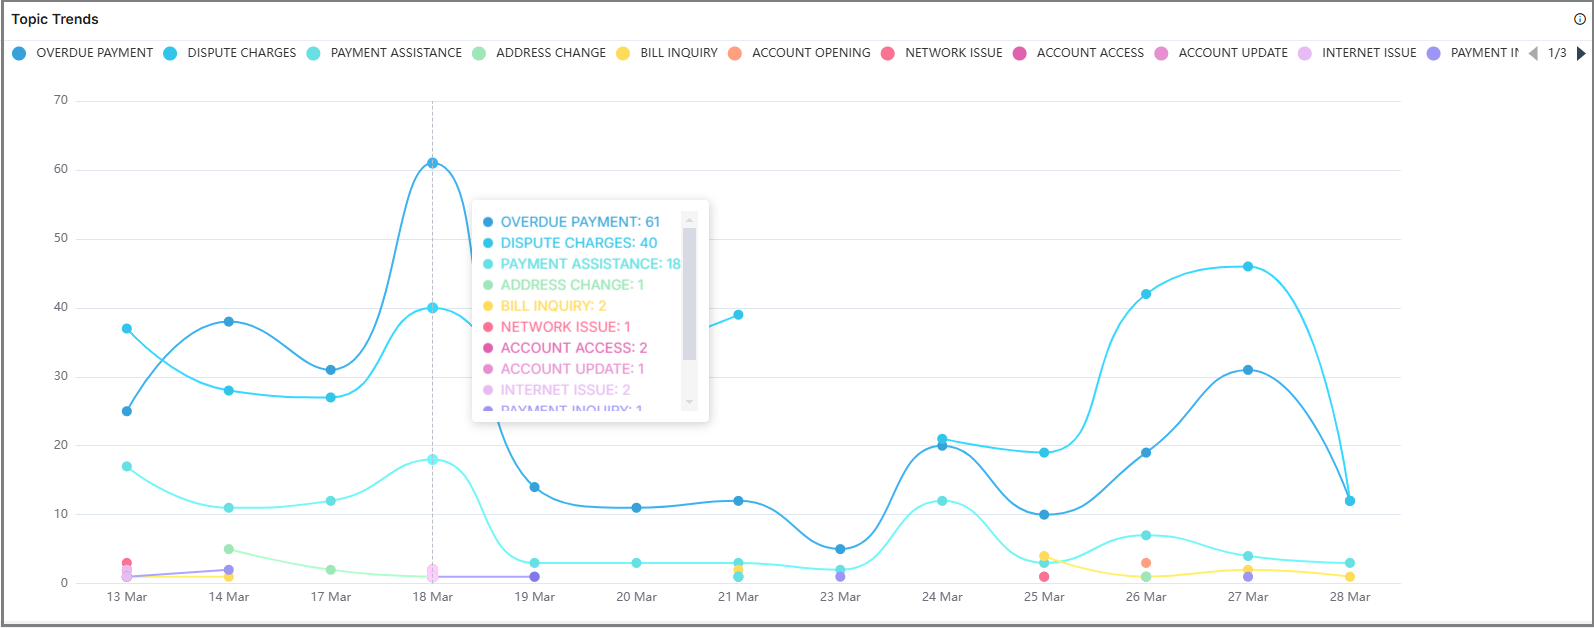 |
Note
When a topic is selected in Trending Topics, the Topic Breakdown highlights the chosen topic, and Topic Trends displays its trend. The same behavior applies when a topic is selected in Topic Breakdown.