Policies Dashboard
Use the Policies Dashboard to gain an overview of your policies by category, including the number of each and their effectiveness. You can also see the total number of policies, the total number of effective, new, and disabled policies in the system, and your policy effectiveness over the past weeks.
To view the Policies Dashboard, go to Analytics and select the Policies tab, if you're already on the Conversation Tracker Dashboard, click Policies on the right. If you have multiple applications deployed, you may need to hover over the CRA tab in the Analytics page to see Policies.
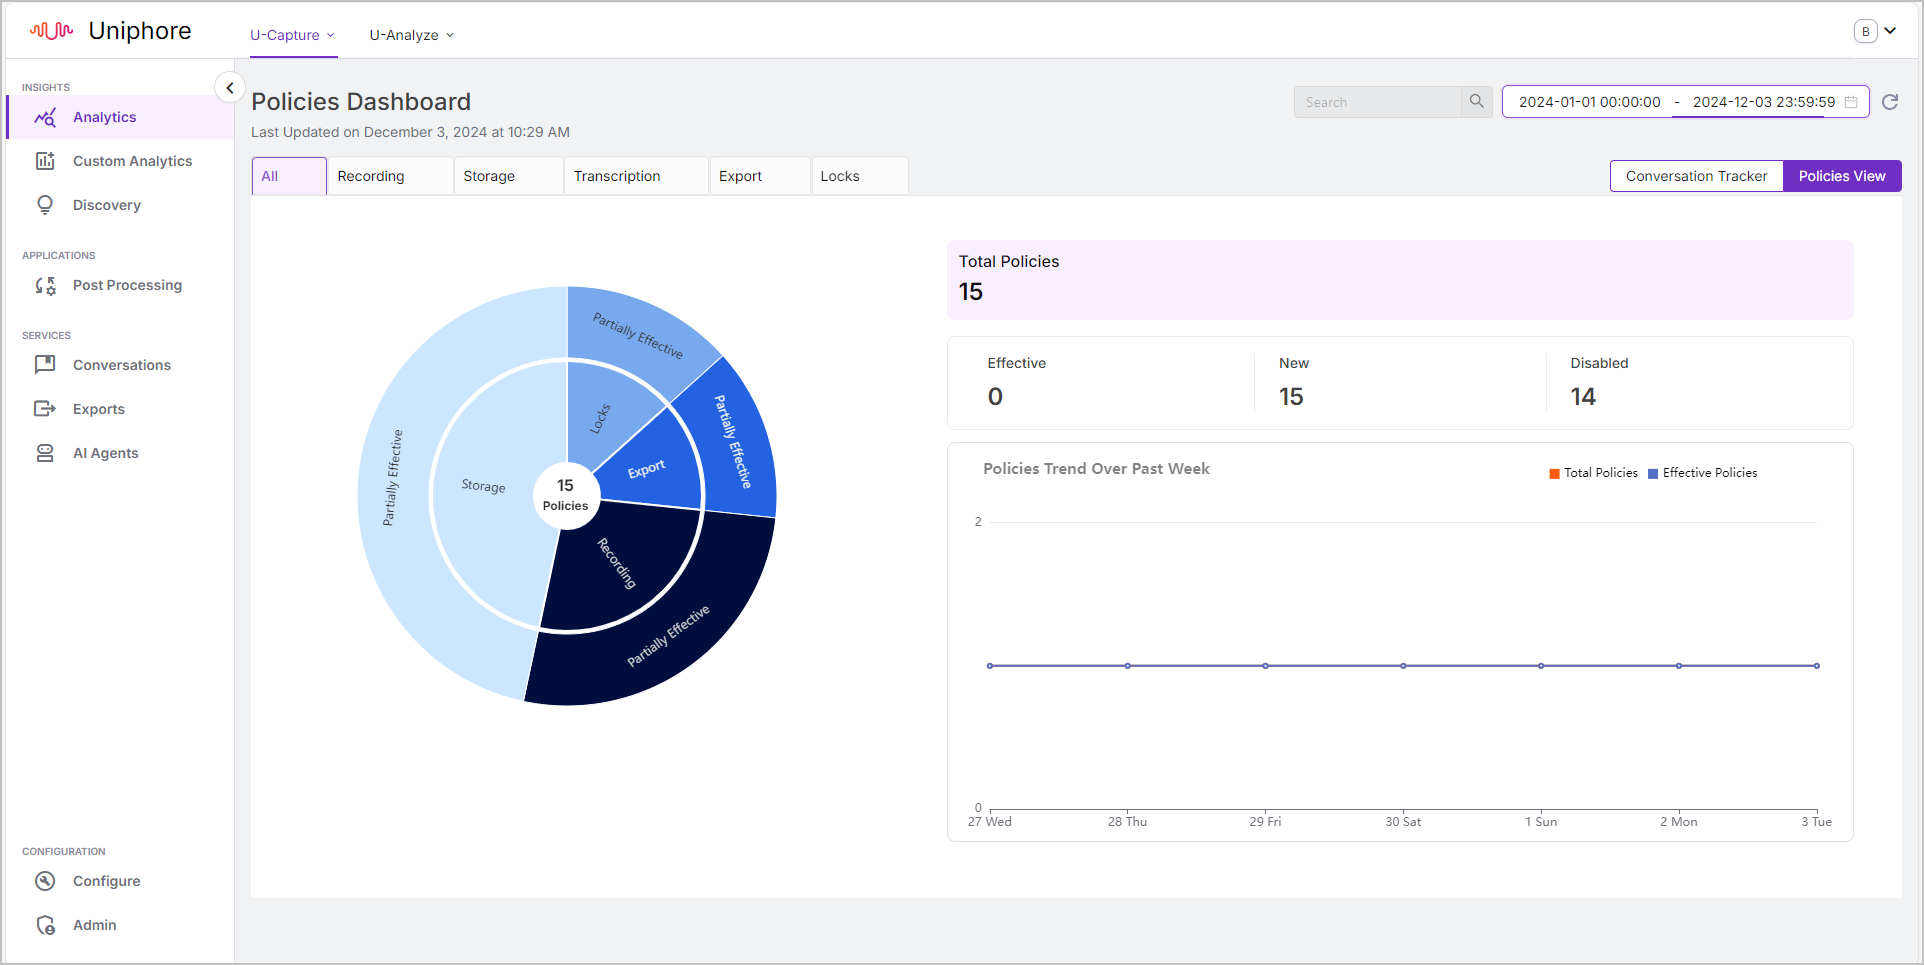
Set the Date and Time Range
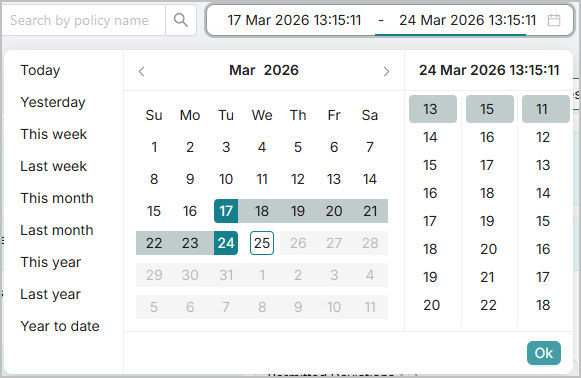
Consider the date range used to generate the information in the dashboard. Use the date range picker at the top right to set the date range. Once a date range is selected, the dashboard refreshes.
Click into the Date and Time Range picker in the top right of the dashboard screen.
|
Quick Insights
See Manage Policies for more information on understanding and configuring Communication Recording Agent Policies.
Click on a tab to filter the dashboard metrics by that policy category and update the sunburst chart and key metrics. Click the All tab to show effectiveness metrics on all policy categories.
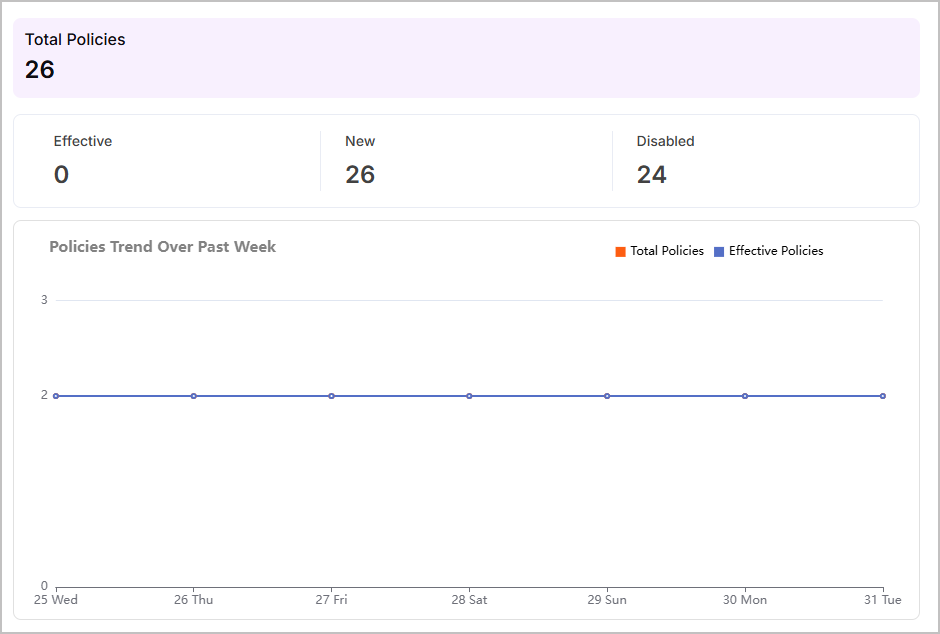
Key metrics on the Policy Dashboard include:
The total number of enabled policies in your system.
The total number of Effective, New, or Disabled Policies in your system.
The trend of your policies over the last 7 weeks, tracking the quantity of policies compared to the quantity of effective policies.
Sunburst Chart
The Policies Dashboard displays a sunburst chart of your policies, categorizing them by category and indicating their effectivness. Use the filter tabs to filter the chart by either all policy categories (using the All tab) or a specific policy category (Recording, Storage, Export, Transcription, and Locks). See Manage Policies for more information on policies.
A brief explainer video has been created to introduce you to the Policies Dashboard chart. See the Policies Chart Demo below.
The sunburst chart shows your policies by category and the effectiveness of each policy category. The levels of effectiveness are:
Fully Effective - the policies in the category were always active/enabled during the selected date/time range.
Partially Effective - the policies in the category were active/enabled for some of the selected date/time range.
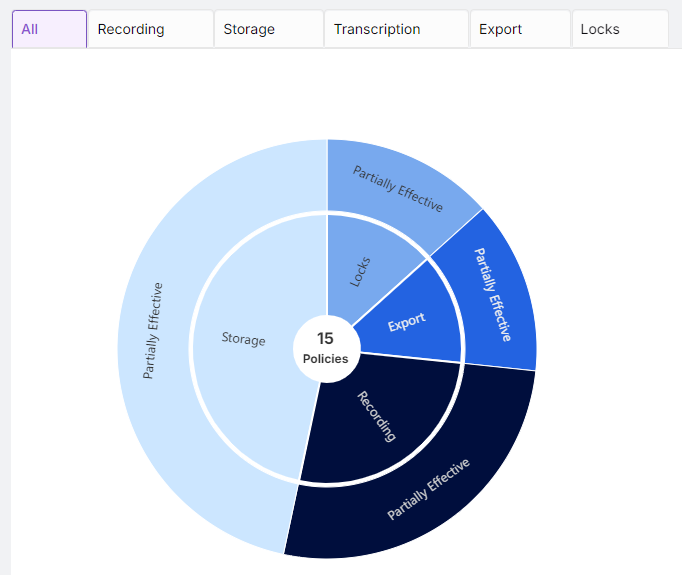
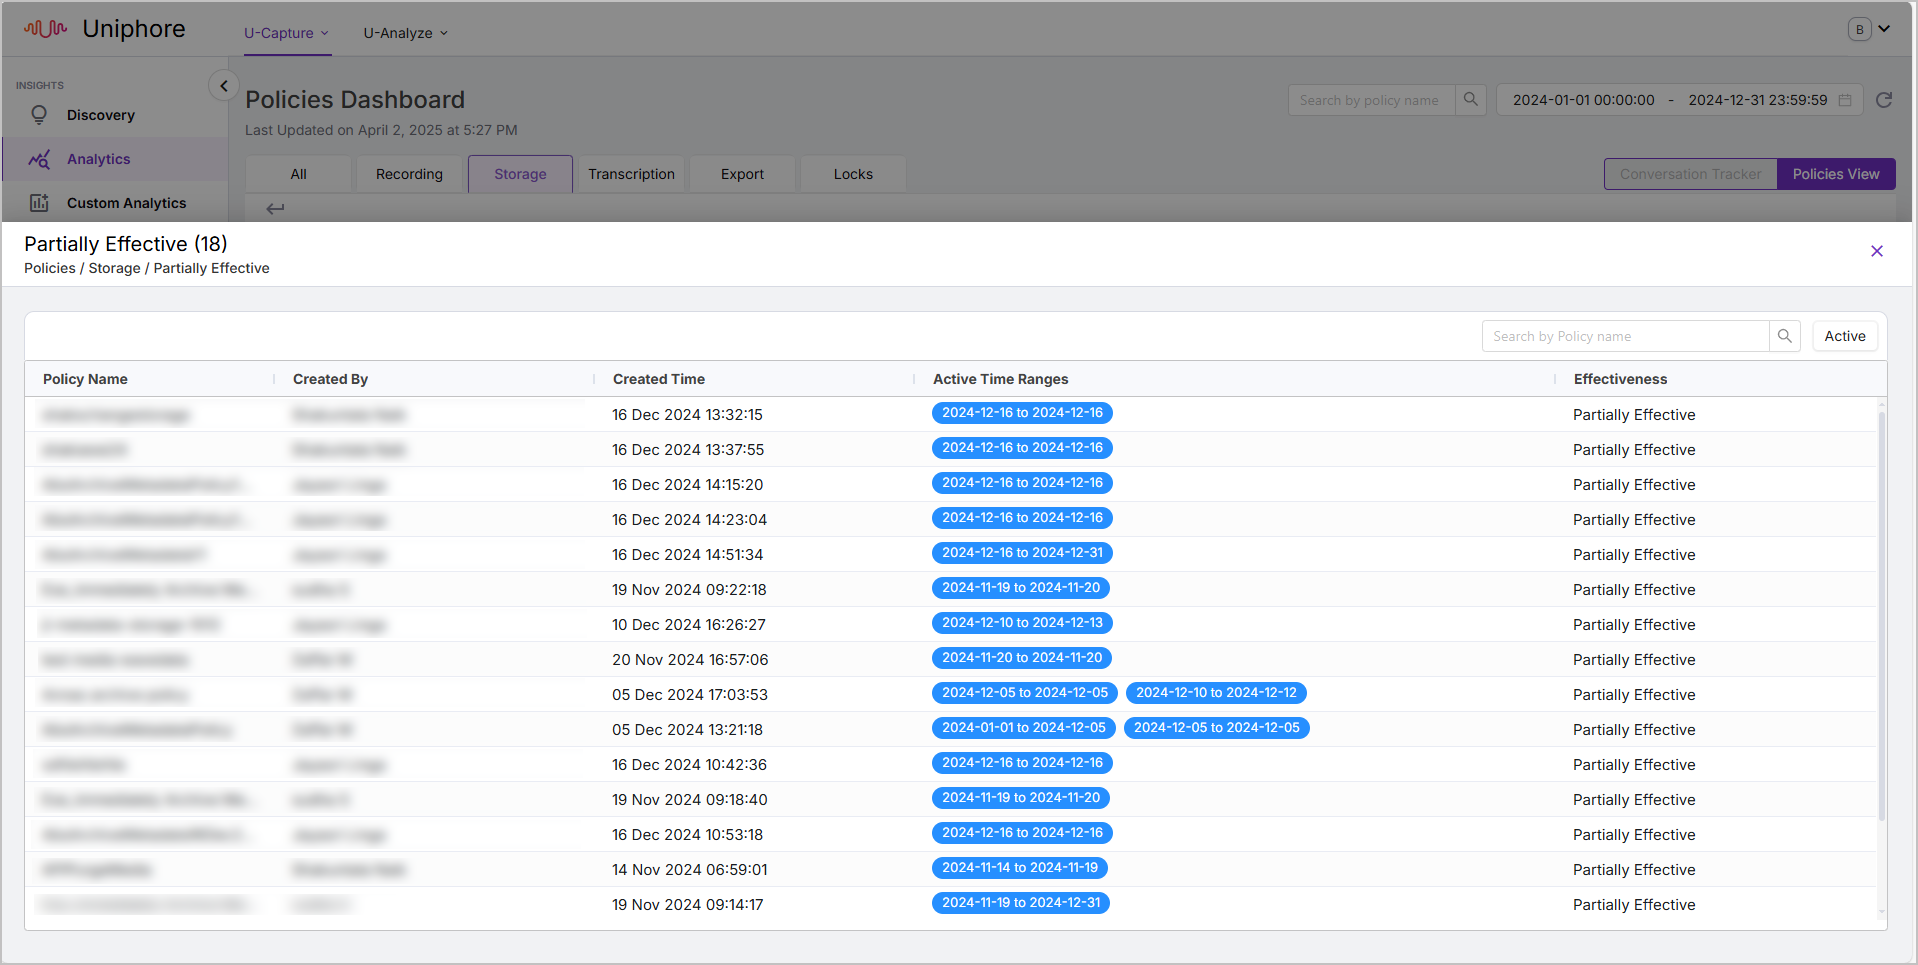
Click into a segment of the chart to dive deeper into that policy category. Click the effectiveness level (the outermost level) of the chart to get a list of the policies in that category that were active/enabled for at least some of the selected date/time range. From here, see the name of each policy, who created the policy and when, the active time ranges for the policies, and a summary of the policy effectiveness (using the same logic as the effectiveness ratings in the sunburst chart above).
Use the category tabs to swap between each policy category, refine the date range if needed (see Set the Date and time Range).
If you have a lot of policies in each category, you can set how many policies to see on each page using the Page Size dropdown in the bottom right.
The following video explains how to use the Policies Dashboard chart.