Conversation Metrics Dashboard
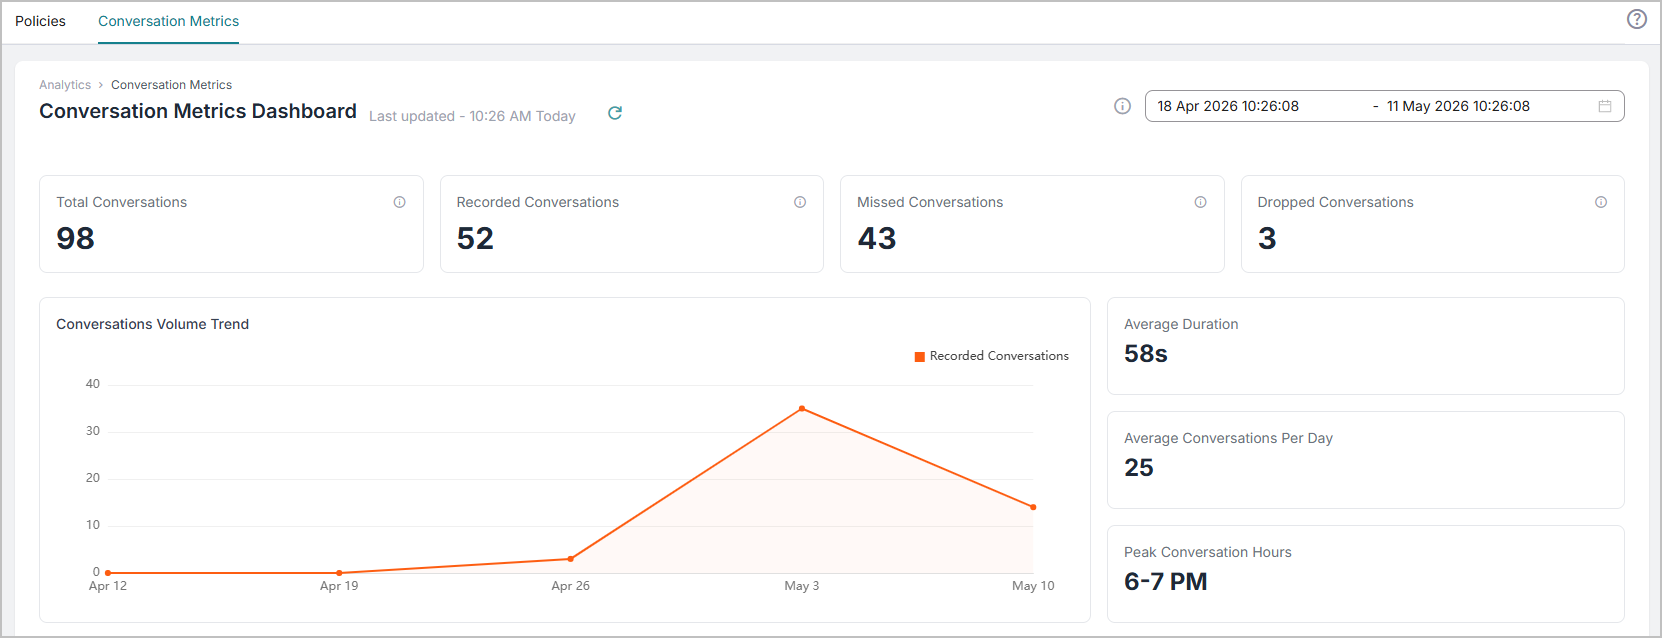
The conversation Metrics dashboard allows administrators to review call capture metrics for the last six months, including total recorded, missed, and policy-dropped calls, as well as the average call duration, the average daily volume, and the hours during which you typically capture the most calls.
This allows administrators to gain insights into how their recording is functioning, see whether the system is recording the expected number of calls, and detect any discrepancies. Based on these insights, administrators can take action. For example, an administrator could review the Blocklist Policy if more calls than expected are being blocked, investigate missed calls, or contact Uniphore for further support.
To view the Conversation Metrics Dashboard, go to Analytics and select the Conversation Metrics tab. If you have multiple applications deployed, you may need to hover over the CRA tab in the Analytics page to see Conversation Metrics.
This topic aims to help administrators understand and navigate the Conversation Metrics Dashboard, providing a comprehensive view of the conversation metrics in the system.
Set the Date and Time Range
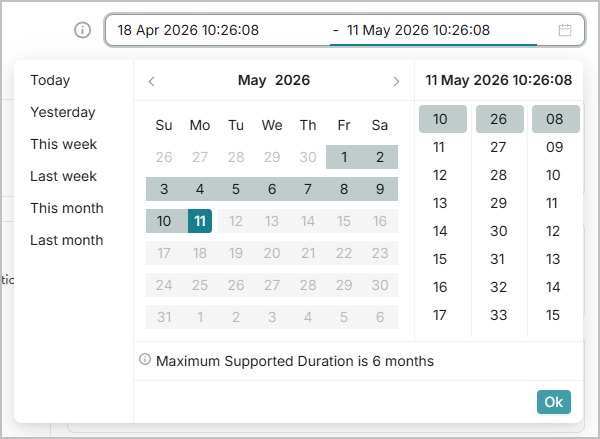
Consider the date range used to generate the dashboard information. Use the date range picker in the top-right corner to set the date range. Once a date range is selected, the dashboard refreshes.
Note
The Conversation Metrics Dashboard lets you review your call-capture metrics over the last 6 months.
To Set the Date and Time Range for the Dashboard:
Click into the Date and Time Range picker in the top right of the dashboard screen.
Consider if you want to use any of the preset options: Today, Yesterday, This week, Last week, This month, or Last month. Click one of the preset options to refresh the dashboard using the selected option.
To set a custom date and time range:
Click the start date (left) side of the date and time range picker and select the month, date, and time for the start date, then click OK.
Select the month, date, and time for the end date, then click OK to refresh the dashboard using the set date and time range.
Insights
Use the Conversation Metrics dashboard to gain the following insights into your call recording.
Capture Metrics: The first four tiles on the dashboard show your conversation capture metrics over the selected date and time range. Use these tiles to see the total number of conversations processed, successfully recorded, missed, and occurrences where recording was dropped due to an active Blocklist policy. Based on these insights, you can take action if needed. For example, you could review the Blocklist Policy if more calls than expected are being blocked, investigate missed calls, or contact Uniphore for further support.
Note
The Conversation Metrics Dashboard is under further development. Uniphore plans to expand the data available on missed conversations and help administrators investigate why they occur.

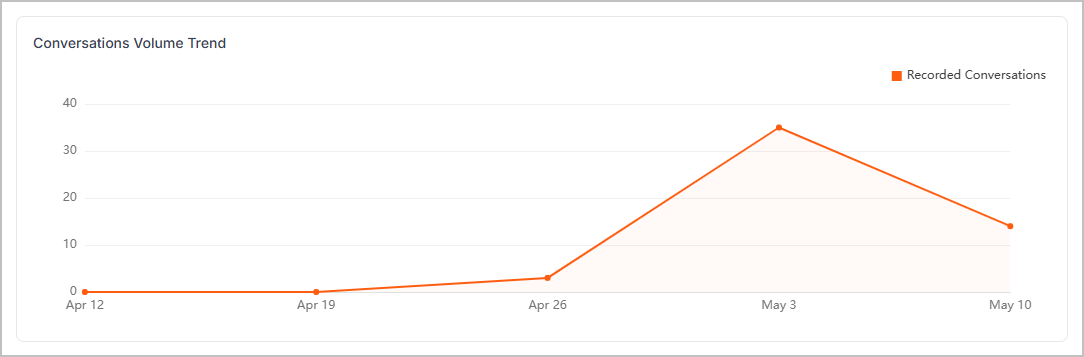
Capture Volume Trend: Use the Conversations Volume Trend chart to quickly see the volume of captured calls across the selected date and time range. This lets you quickly spot any unusual capture volume on a particular day, such as a spike or dip in conversation capture, and see any ongoing trends in your call capture, such as a steadily increasing number of calls captured.
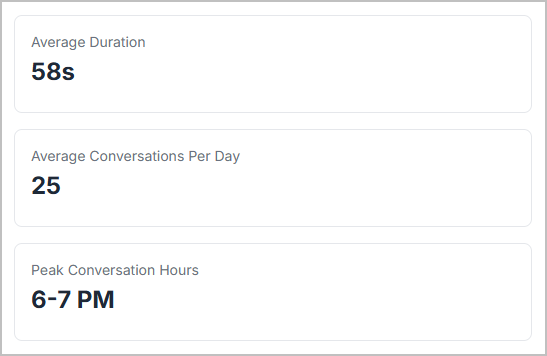
Averages: See key takeaways from your capture data across the selected date and time range, including the average duration of your captured calls, the average quantity of captured calls per day, and the hours your system typically captures the most calls.
Note
The time window shown in Peak Conversation Hours is local to your browser's time zone. For example, a browser in London (UTC) displaying 6-7 PM could represent calls captured 2-3 PM in New York (EDT).