Conversation Capture Dashboard
Use the Conversation Capture Dashboard to get information about your conversations, see the total number of conversations in the system, how many conversations are affected by each policy category, any exceptions, and any alerts. You can also see the total number of conversations unaffected by policies.
To view the Conversation Capture Dashboard, go to Analytics and select the Policies, if you're already on the Policies Dashboard, click Conversation Tracker on the right. If you have multiple applications deployed, you may need to hover over the CRA tab in the Analytics page to see Policies.
This topic aims to help you understand and navigate the Conversation Capture Dashboard, providing a comprehensive view of the conversations captured in your system.
Set the Date and Time Range
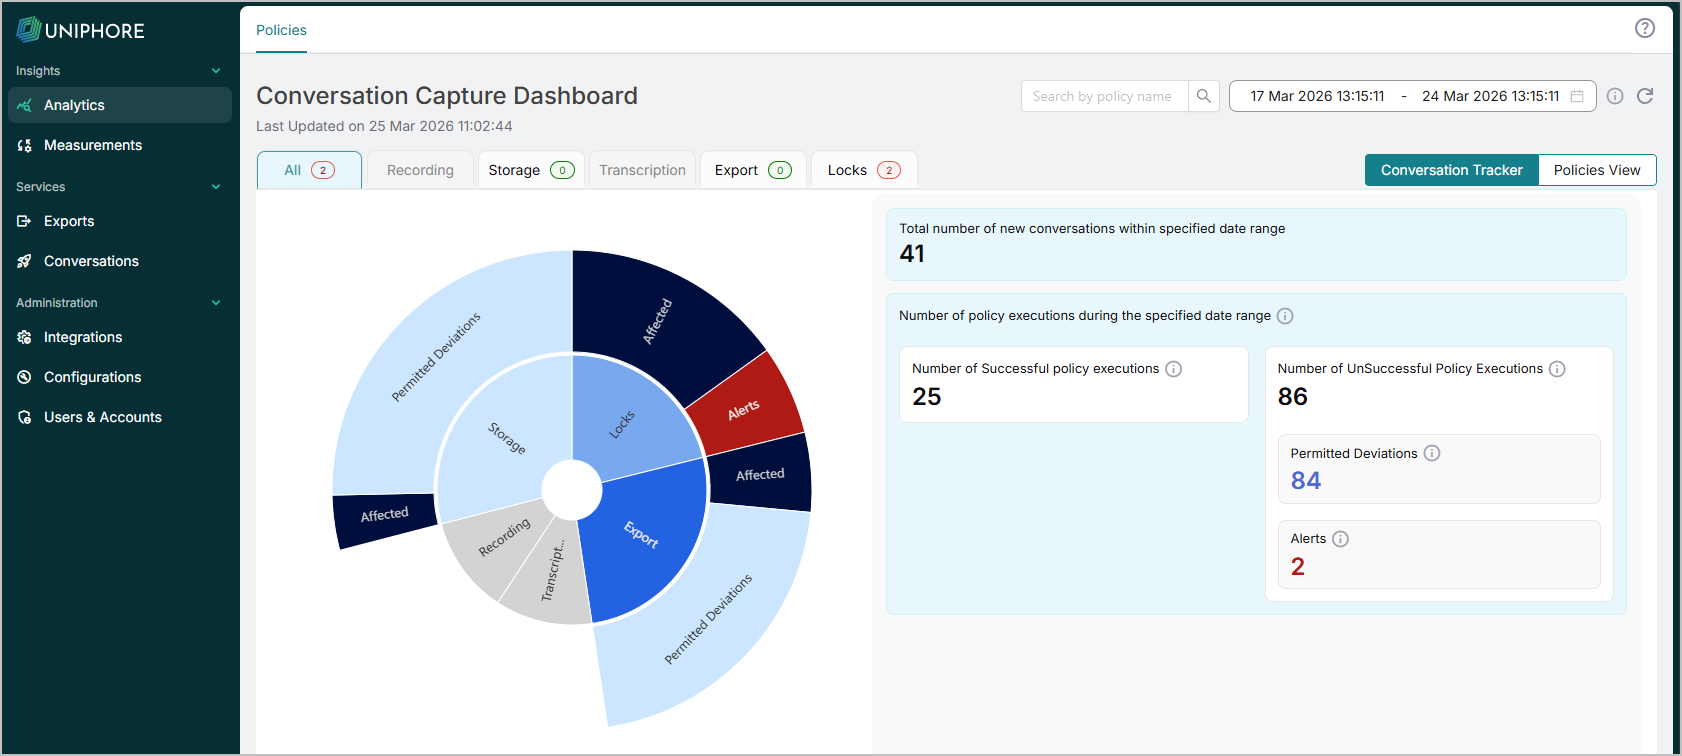
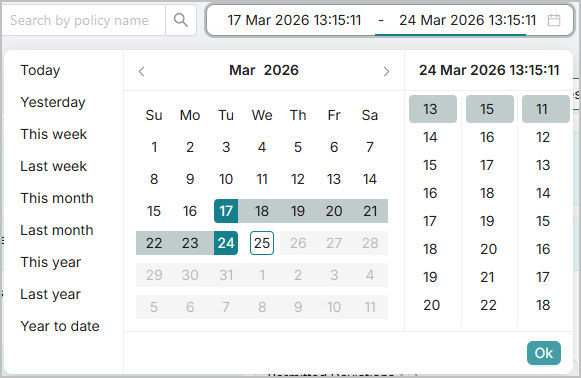
Consider the date range used to generate the information in the dashboard. Use the date range picker at the top right to set the date range. Once a date range is selected, the dashboard refreshes.
Click into the Date and Time Range picker in the top right of the dashboard screen.
|
Quick Insights
See if any conversations have not been affected by each policy category due to alerts by looking at the Filter tabs. The number of conversations that have not been affected is shown by the number in each tab. If a policy category has any unaffected conversations due to alerts, the number is displayed in red; otherwise, a green 0 is shown to indicate no issues. See the number in the All tab to see if there are any conversations that have not been affected by any policy due to alerts. See Manage Policies for more information on understanding and configuring Communication Recording Agent Policies.

Click on a tab to filter the dashboard metrics by that policy category and update the sunburst chart and key metrics. Click the All tab to show metrics for conversations applicable to all policy categories.
Key metrics on the Conversation Capture Dashboard include:
The total amount of conversations with applied policies, either by all policies (All tab) or by the selected policy category.
The total amount of conversations with policies not applied, either by all policies (All tab) or by the selected policy category. This is then split into two causes: for a permitted deviation, or due to an alert. Click on the conversation count under each to open the list of conversations along with the Policy Name, Policy Type, Created Time, Conflict/Alert, and other metadata. Permitted deviations are logical reasons why the policy can not be applied to a conversation. For example, Purge policies can not remove conversations that are locked.
Sunburst Chart
The Conversation Capture Dashboard displays a sunburst chart of your policies and the conversations matching the filters in those policies. Use the filter tabs to filter the chart by either all policy categories (using the All tab) or a specific policy category (Recording, Storage, Export, Transcription, and Locks). Access Control policies are not included as they do not impact your conversations. See Manage Policies for more information
A brief explainer video has been created to introduce you to the Conversation Dashboard chart. See the Conversations Chart Demo below.
The sunburst chart displays your conversations by policy category and their status in relation to the policy category. The statuses include:
Affected - any conversations affected by the policy category.
Permitted Deviations - any conversations permitted not to be affected by the policy category. For example, locked conversations are permitted deviations from Purge policies. If there are no conversations with permitted deviations, then the status is not displayed in the chart.
Alerts - any conversation where policies should have affected them but have not due to alerts. Alerts should be looked into. If there are no conversations with issues, then the status is not displayed in the chart.
Use the All tab to get an overview of all the policy categories and how they are affecting your conversations. The policy categories make up the inner level of the chart. Hover over each policy category to show a tool tip with how many conversations are under the policy category (total conversations, affected, permitted deviations, and alerts). Click on the policy category in the chart or use the tabs above for an isolated view of the sunburst chart and key metrics. Click the center of the chart to return to the full chart. The outer level displays their effectiveness across your conversations, split into Affected, Permitted Deviations, and Alerts.
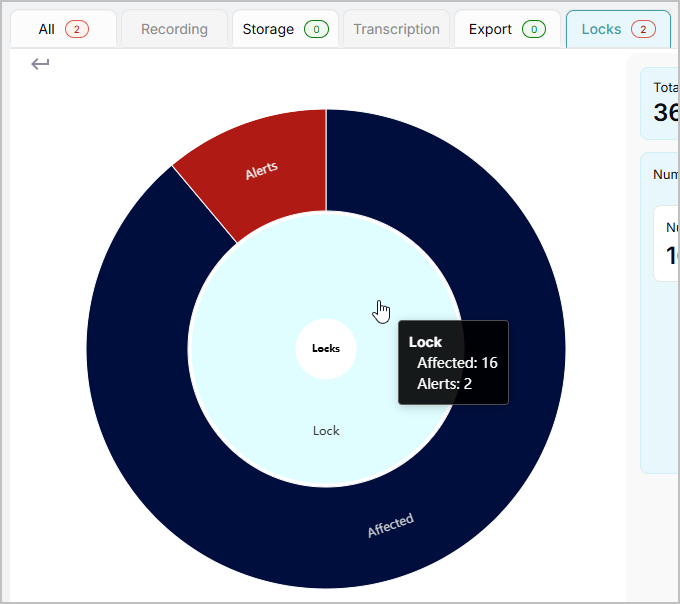
When viewing a specific policy category, the inner level of the chart shows the policy types. Hover over the policy types to show a tool tip with how many conversations are under the policy type (total conversations, affected, permitted deviations, and alerts). The outer level displays the effectiveness across your conversations for the above policy type, split into Affected, Permitted Deviations, and Alerts. Hover over each to show how many conversations there are for each status.
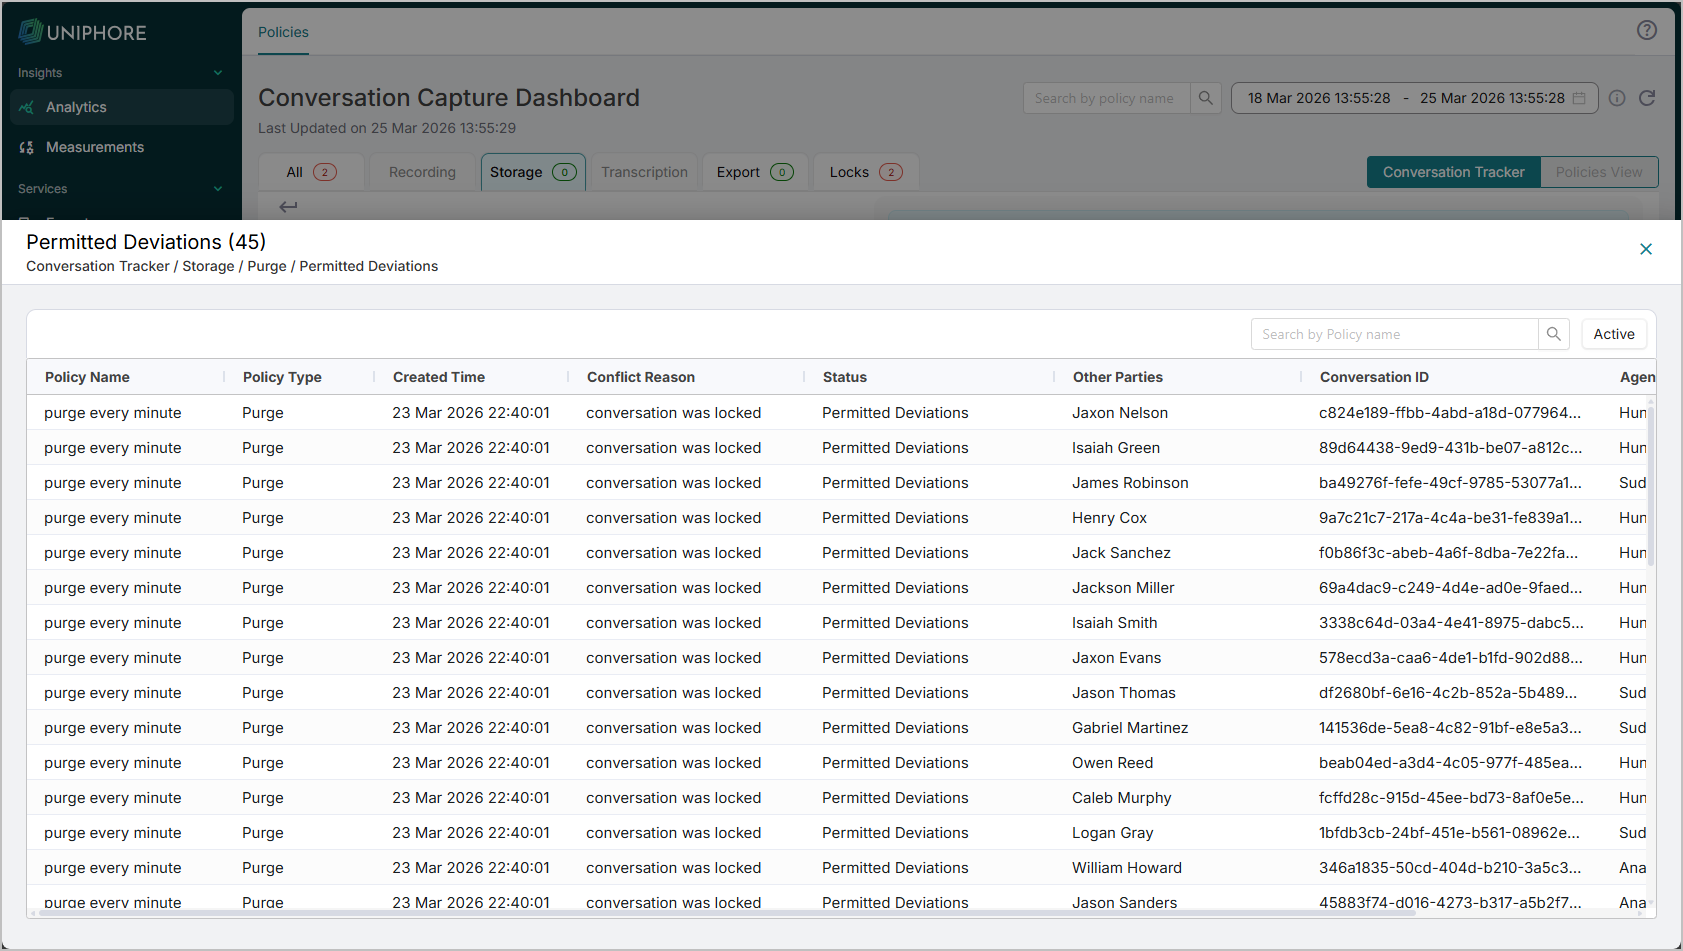
Click into the status segment to open a list of the conversations for that status. This list includes details on each conversation with that status for the policy category, including Policy Name, Policy Type, Created Time, Conflict/Alert, and other metadata.
The following video explains how to use the Conversations Chart.