Overview (Account View)
The account overview provides visibility into customer insights and sentiment/engagement trends gained over the course of multiple deals/opportunities under that account over the course of time.
With a few clicks, sales reps and managers can quickly view customer insights at a cumulative or individual account level, identify the potential risks and opportunities, pinpoint the associated discussion topics, and quickly relive meeting moments to gain accurate knowledge. They can then take those insights to mitigate risks and improve their probability of winning the deals associated with the account.
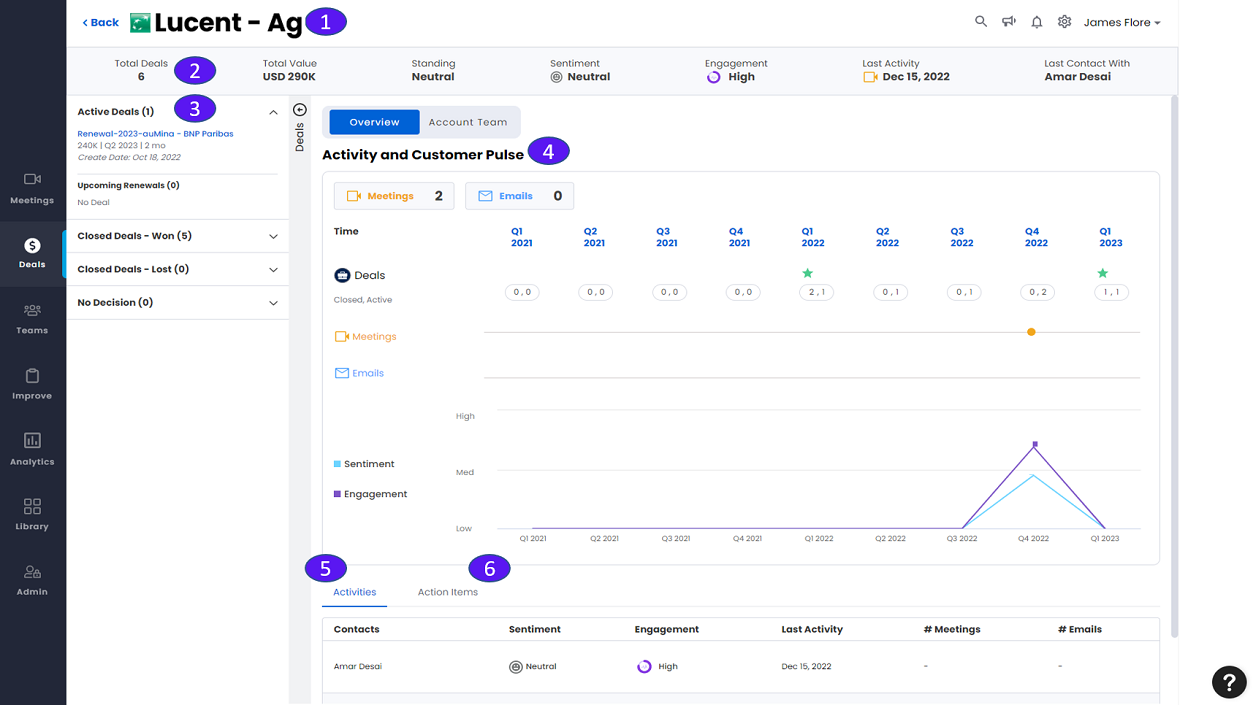
1. Account Name
Shows the name of the account.
2. Top Ribbon - Account Details
Shows the account details as follows:
Total Deals:
The total number of all the deals of this account which may be Active Deals, Upcoming Renewals, Closed Deals - Won, Closed Deals - Lost, and No Decision deals.
Total Value:
The total value of all the deals of this account in USD.
Standing:
The weighted average of the sentiment and engagement of an account. It can be High, Neutral or Low.
Sentiment:
The weighted average of the sentiment of all the deals of an account. It can be High, Neutral or Low.
Engagement:
The weighted average of the engagement of all the deals of an account. It can be High, Neutral or Low.
Last Activity:
The last activity in terms of any meeting that had occurred for any of the deals within an account.
Last Contact with:
The name of the last contact (Client side) who had participated in a meeting with any of the account's sales team members.
3. Left Pane
Active Deals:
The details related to the deals that are currently active within a particular account. The details shown are:
The renewal year.
The deal name.
The deal value in USD if available/assigned.
The deal quarter with year.
Number of months remaining for deal closure based on Projected Close Date.
Deal created date in MM/DD/YYYY format.
Upcoming Renewals:
The deals whose renewals are due shortly. The details shown are:
The renewal year.
The deal name.
The deal value in USD if available/assigned.
The deal quarter with year.
Number of months remaining for deal closure based on Projected Close Date.
Deal created date in MM/DD/YYYY format.
Closed Deals - Won:
The deals that are closed and won. The details shown are:
The deal name.
The deal value in USD if available/assigned.
The deal quarter with year.
Number of months remaining for deal closure based on Projected Close Date.
Deal created date in MM/DD/YYYY format.
Closed Deals - Lost:
The deals that are closed and lost. The details shown are:
The deal name.
The deal value in USD if available/assigned.
The deal quarter with year.
Number of months remaining for deal closure based on Projected Close Date.
Deal created date in MM/DD/YYYY format.
No Decision:
The deals for which no decision is taken yet. The details shown are:
The deal name.
The deal value in USD if available/assigned.
The deal quarter with year.
Number of months remaining for deal closure based on Projected Close Date.
Deal created date in MM/DD/YYYY format.
4. Activity and Customer Pulse
Here the various details that relate to different activities and customer pulse such as number of meetings and emails, closed and active deals quarter wise, meetings and emails timeline, and sentiment/engagement trend graph are shown.
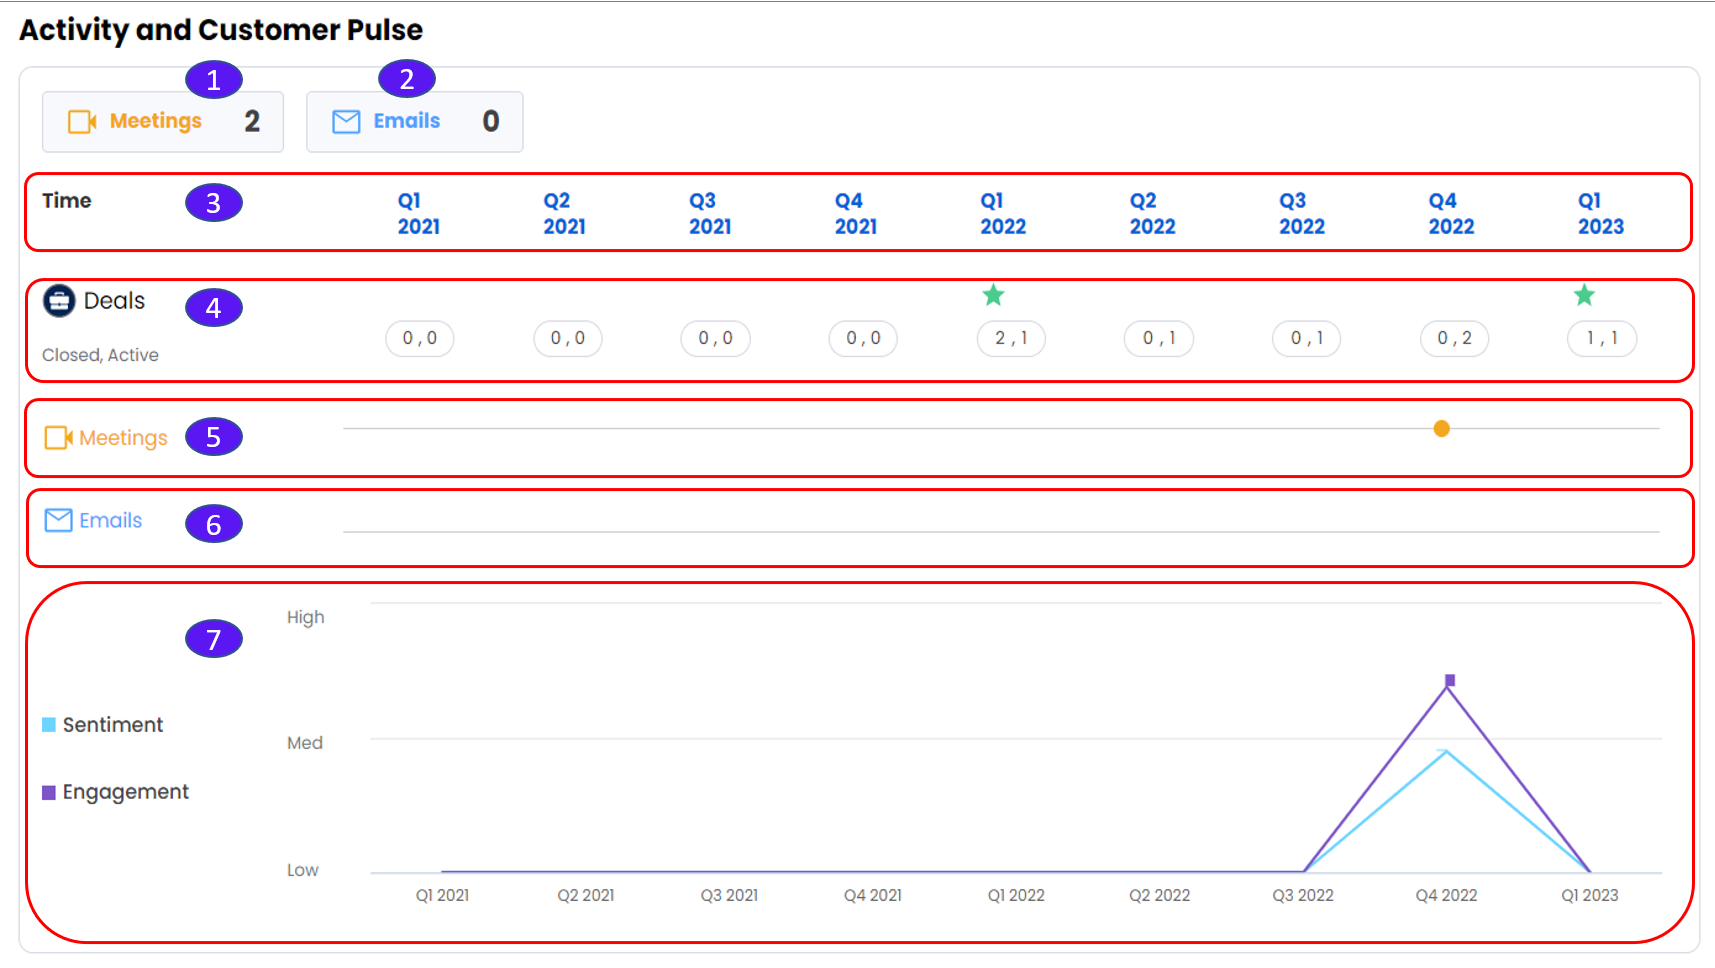
Meetings Tab:
Displays the total number of meetings of all the deals under an account.
Emails Tab:
Displays the total number of emails exchanged for all the deals under an account. For e.g., the figure shown above displays all the quarters of 2021. 2022, and the quarter 1 of 2023
Time Ribbon:
Displays the quarter and the year.
Deals Ribbon:
Displays all the closed and active deals quarter wise under an account. For e.g., in the figure shown above the quarter one of the fiscal year 2022 there are 2 closed deals and 1 active deal. A green star mark is shown above the number of closed deals when it is greater than or equal to 1. Similarly, in the same context a green star mark is shown above the number of closed deals of 2023 quarter 1. Click on the Closed, Active
 button to view the details of the closed and active deals in a popout.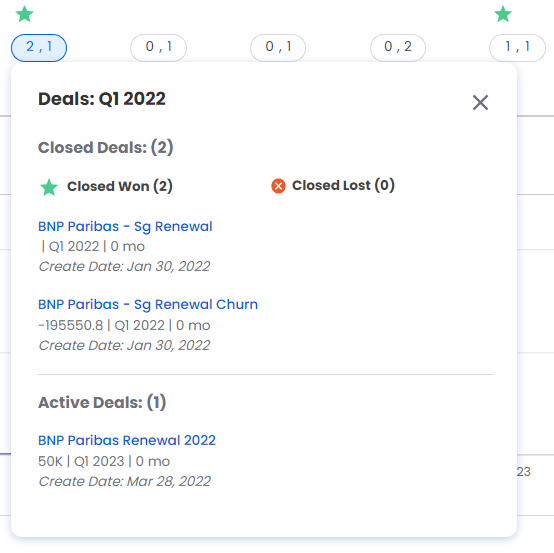
The popout shows the details of closed and active deals that follow:
The deal name.
The deal value in USD if available/assigned.
The deal quarter with year.
Number of months remaining for deal closure based on Projected Close Date.
Deal created date in MM/DD/YYYY format.
Meetings Timeline:
The meetings that have occurred in a quarter of a year are shown as light, orange-colored dots
 against the quarter of the year.
Emails Timeline:
The emails that have been exchanged in a quarter of a year are shown as light, blue-colored dots
 against the quarter of the year.
Sentiment/Engagement Graph
Sentiment Trend Graph:
Using this graph, you can review the accounts sentiment trends quarter wise. The sentiment trend can be Low, Medium or High. These sentiment trends Indicate the overall insights of the sales health condition. A downward trending sentiment is a warning signal to the sales rep and calls for corrective actions.
Engagement Trend Graph:
Using this graph, you can review the accounts engagement trends quarter wise. The sentiment trend can be Low, Medium or High. These engagement trends Indicate the overall insights of the sales health condition. A downward trending engagement is a warning signal to the sales rep and calls for corrective actions.
5. Activities
Displays the below information:
Contacts:
Shows the contact names.
Sentiment:
It can be:
Positive - Depicted as a green colored emoji
Neutral - Depicted as a grey colored emoji
Negative - Depicted as a red colored emoji.
Engagement:
It can be:
High
Medium
Low.
Last Activity: The date of the last activity in mm/dd/yyyy format.
#Meetings:
The number of meetings of this account.
#Emails:
The number of emails exchanged in this account.
6. Action Items
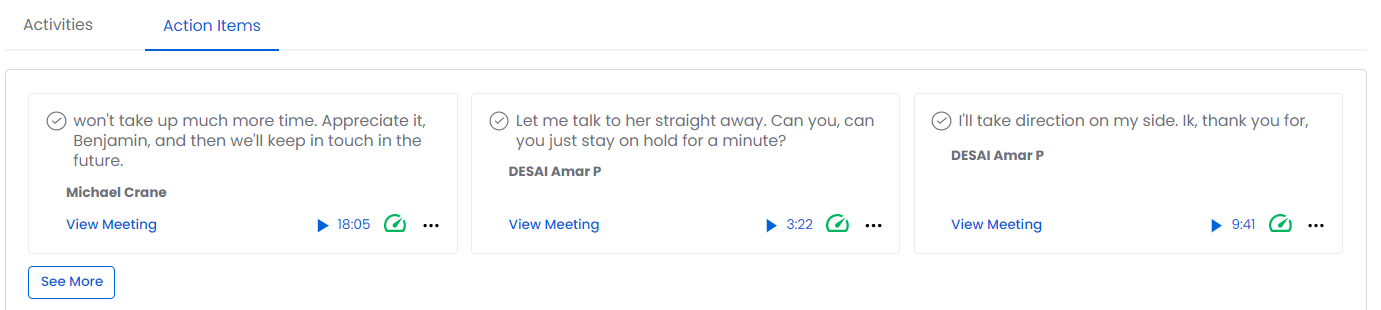
Displays the action items at particular timelines in the meeting. Click the play button to view the action item in the meeting starting from the time at which the action item was captured till the end of the meeting. The time at which the action item was captured is shown besides the play button. Click View Meeting to view the complete meeting.
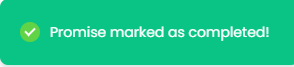
Click the "Mark as complete/Completed" checkbox to mark the action item as completed. Upon clicking this checkbox, a popout notification is seen at the upper right corner of the app with the message "Promise marked as completed!" as shown below. After this checkbox is marked as completed you can again select it to mark it as "Promise marked as incomplete!", which is shown as a popout similar to the completed popout.
Click the horizontal ellipsis icon to view the Delete (Dismiss Promise) icon. Click it to delete the action item.