Summary
Provides the summary of a deal.
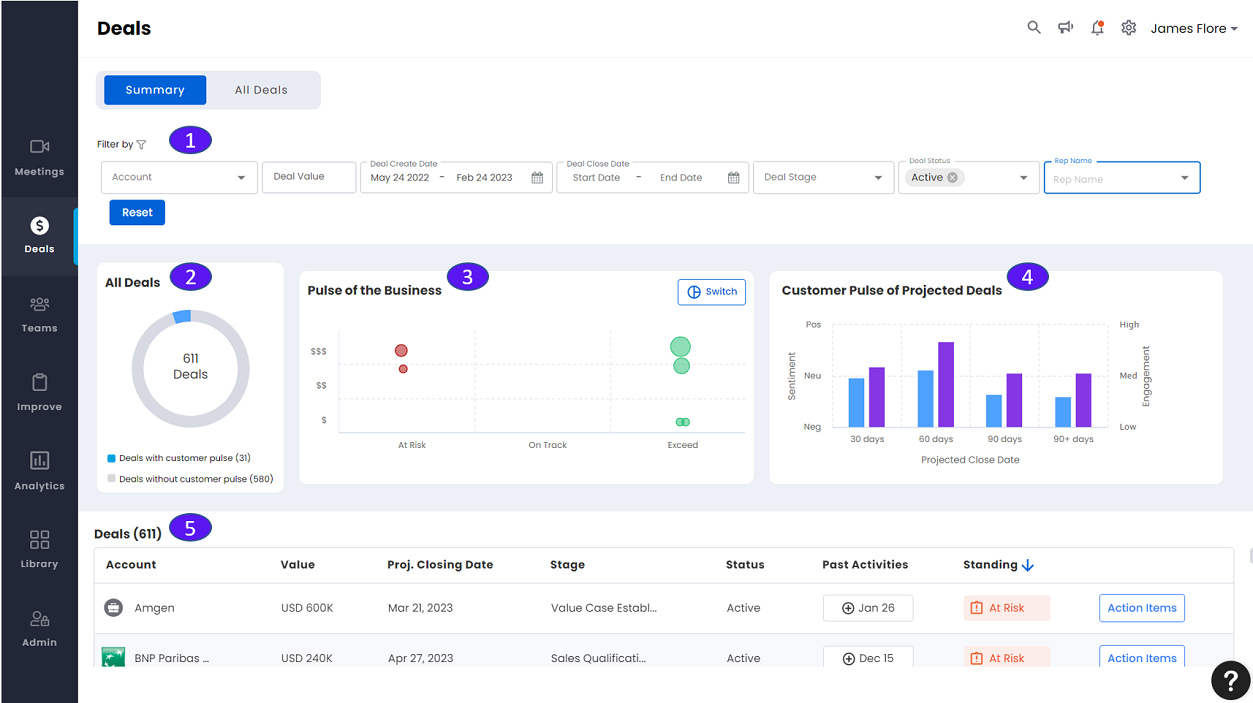
1. Filter Ribbon
You can filter by:
Account
Deal Value
Deal Create Date
Deal Close Date
Deal Stage
Deal Status
Rep Name
2. All Deals
Shows the Deals with customer pulse and Deals without customer pulse as a pie chart of the data. Click on the respective colored zone on the donut chart to view the details in the Deal List. See 4. Customer Pulse of Projected Deals.
3. Pulse of the Business
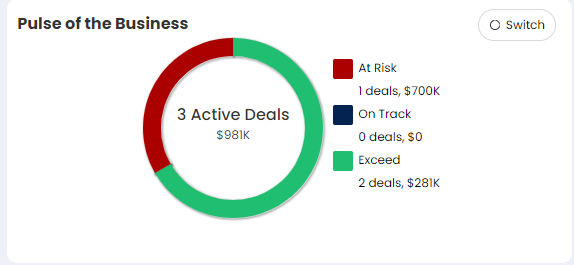
Provides a graphical view of the deal insights in progress. It shows the number of deals and total amount and Number at Risk, On Track, and Exceed with amounts, respectively.
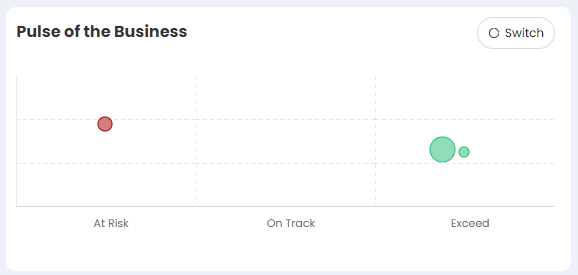
Vertical Axis:
Value of deal.
Horizontal Axis:
Relative likelihood of winning deals based on customers’ emotional state. The aggregated value of all deal meetings tells how likely the deal will be closed compared with the historical average of prior closed deals. At-Risk, On Track, Exceed expectation.
Data Point:
Click on a data point to see only that deal in the list at the bottom (Account, Value, etc.).
Switch:
Click on Switch to see a donut chart of the data.
4. Customer Pulse of Projected Deals
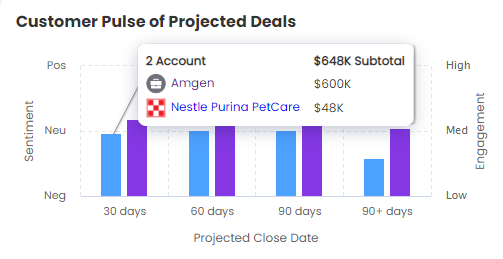
Shows the customer pulse of projected deals in the next 30, 60, and so forth up to 180 days. Mouse over the data points to see more sentiment and engagement.
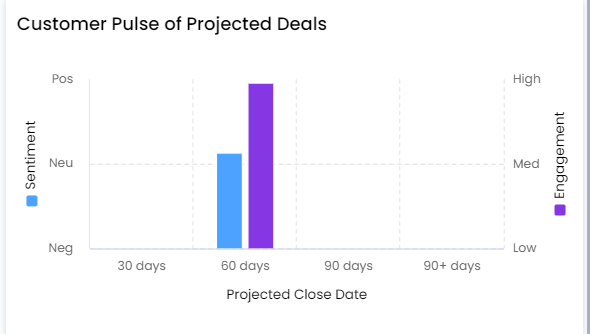
Hover above the sentiment or engagement colored bar to view the account details.
5. Deal List
Summary information with sortable columns for all deals:
Account icon and name:
Click to see the Individual Account View.
Value:
Shows the value of the deal.
Proj. Closing Date:
Shows the date when the deal is projected to be closed.
Deal Stage:
Shows the progress of the deal in terms of what stage the deal is at. The various deal stages could be Pre Qualification, Value Case Established, Solution Demonstration, Sales Qualification etc.
Past activities:
Click to show the detailed Activity Timeline of this deal. Use the date pulldown to set the range up to 6 months. Mouse over the timeline and click to see detailed activity information. The blue icon indicates the email activity, and the orange bubble indicates the meeting activity.
Action items:
Click to show the committed action items based on all prior sales meetings in reverse chronological order (from most recent to going back).