Q Usage
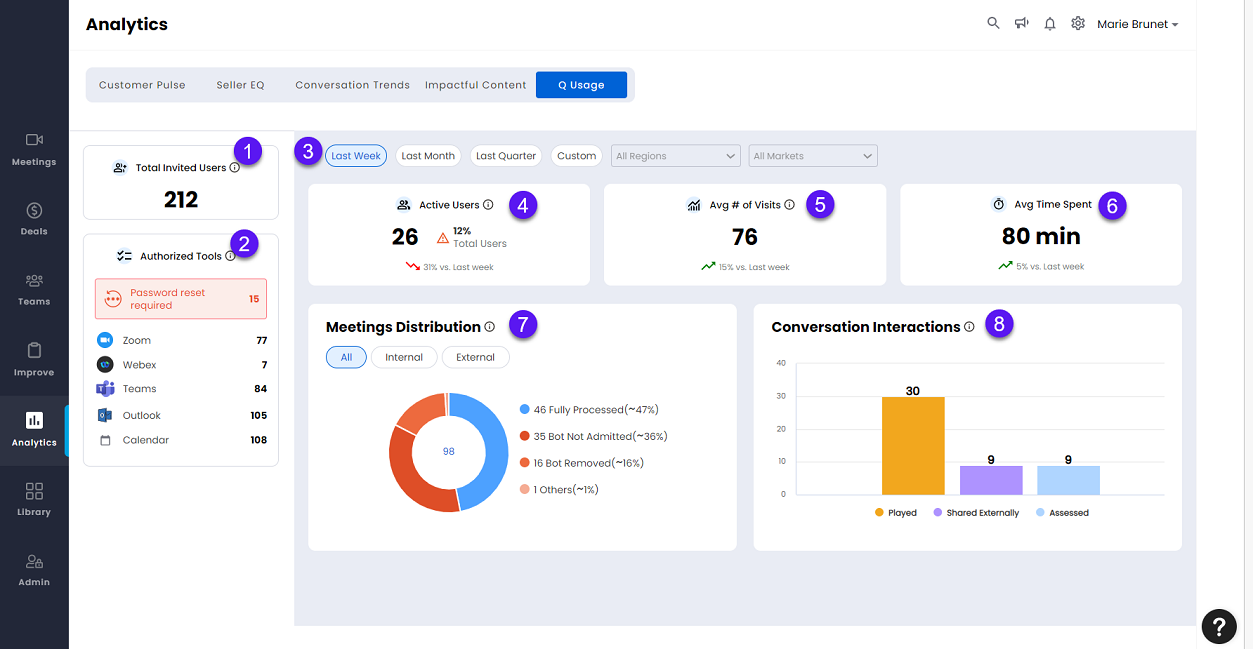
This page displays the "Sales Interaction Agent" usage dashboard in terms of user metrics and meeting metrics.
The user metrics are:
The meeting metrics are:
1. Total Invited Users
The total number of users who have received an invitation notice as authorized users of "Sales Interaction Agent" from the beginning of app usage till present. Click to view the details of Meetings Distribution Per User in a slide out. Key in the username to search in the Search box. The details can be sorted (ascending/descending) by any of the columns. By default, they are arranged in ascending order of Meeting Recorded. Also, by default Last Week is selected as the date range filter. Click on Export to download an excel file of the data.
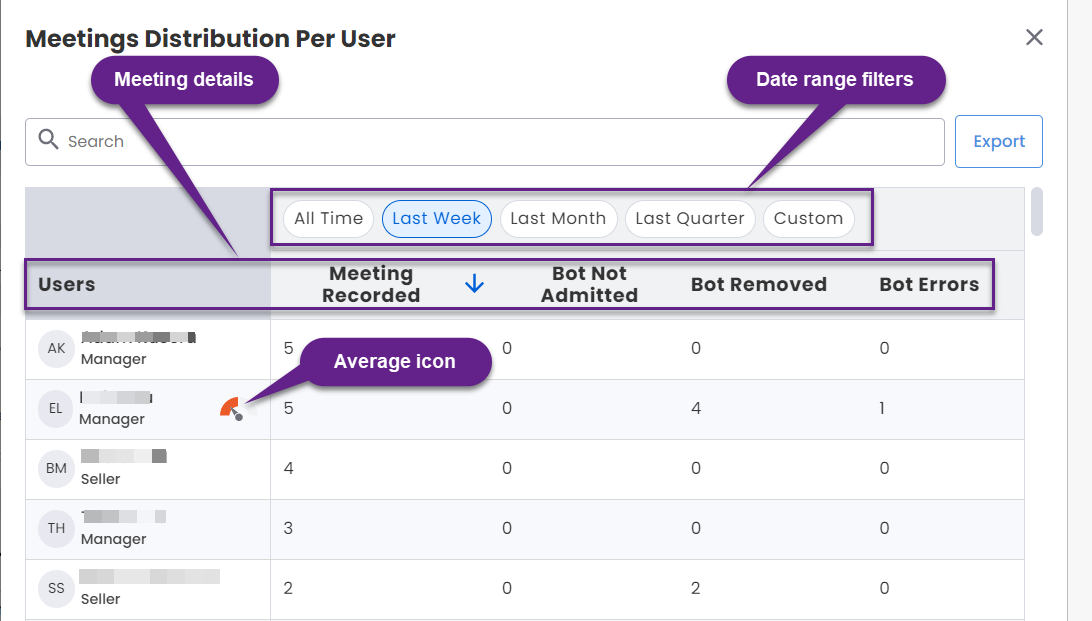
It displays the information that follows:
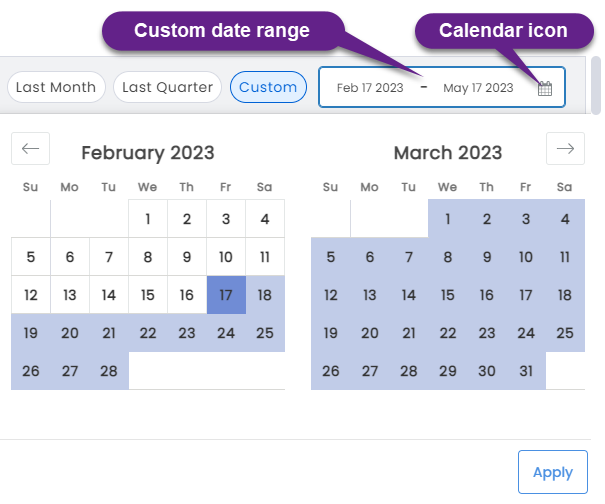
Date Range Filters: Allows the meetings to be filtered by All Time, Last Week, Last Month, Last Quarter or Custom. If you select Custom you can set a desired date range. Click on Custom to view the custom date range option. By default, a three-month period is selected. Click on the calendar icon to view the from and to selection calendars. Select the desired date range from the calendar and click Apply.
Meeting Details: Displays the username, user icon, and user role such as manager, seller etc.) in the Users column. Displays the number of meetings for Meeting Recorded, Bot Not admitted, Bot Removed, Bot Errors for the respective users. The average icon (
 ) is shown against the users who have a higher-than-average number of meetings that are not recorded.
2. Authorized Tools
The total number of users who have authorized each type of collaboration tool (e.g., Zoom, WebEx, Teams etc.). Click to view the details in the Authorized Tools per User slide out. Key in the username to search in the Search box of the slide out. The details can be sorted (ascending/descending) by any of the columns. By default, they are arranged in ascending order of username. Click on Export to download an excel file of the data.
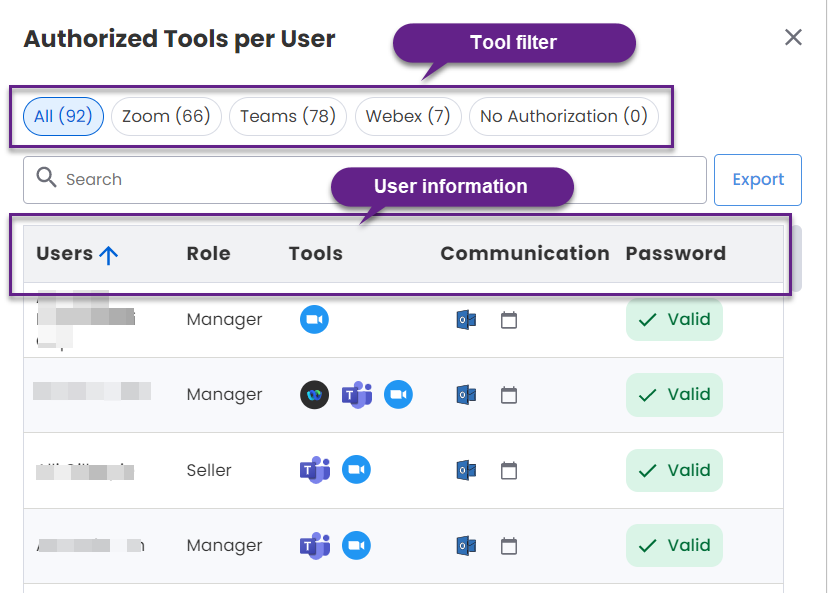
It displays the information that follows:
Tool Filter: Click on the tool in the tool filter to view the details of users who have authorized the selected tool.
User Information: Displays the user related information; Users (Username), Role (Manager, Seller etc.), Tools (Tools authorized by the respective users), Communication (Communication tools used by the respective users), and Password (Validity of the password - Valid or Invalid).
3. Filter Ribbon
The user metrics (except Total Invited Users and Authorized Tools) and meeting metrics can be filtered by:
Last Week (Default)
Last Month
Last Quarter
Custom (See Date Range Filters)
All Regions (Currently inactive, will be available soon.)
All Markets (Currently inactive, will be available soon.)
4. Active Users
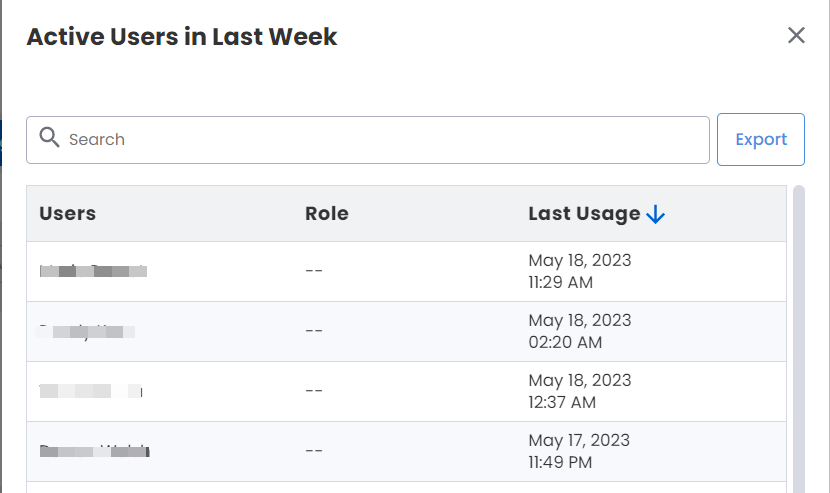
The number of users who have visited "Sales Interaction Agent" in the selected filters(s). Shows the percentage of total users who are active, and the upward/downward trend compared to the previous period for the selected filter(s). Click to view the details in a slide out. Key in the username to search in the search box. The details can be sorted (ascending/descending) by any of the columns. By default, they are arranged in descending order of last usage date. Click on Export to download an excel file of the data.
The user related information displayed are Users (Username), Role (Manager, Seller etc.), and Last Usage (last usage date).
5. Avg # of Visits
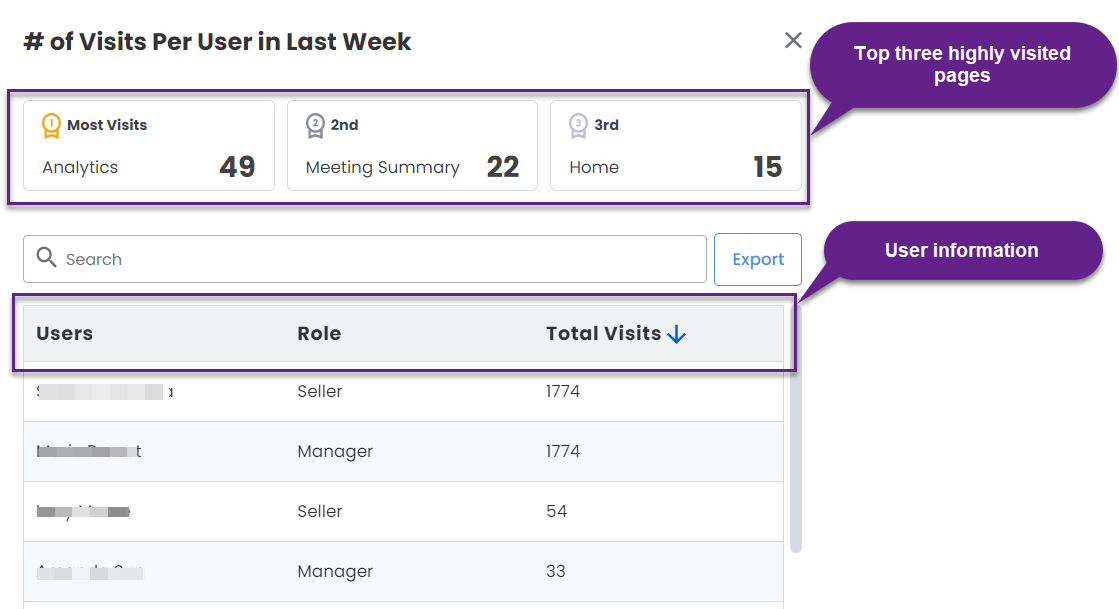
The average number of visits per user for the selected filter(s). Shows the upward/downward trend compared to the previous period for the selected filter(s). Click to view the details in a slide out. Key in the username to search in the search box. The details can be sorted (ascending/descending) by any of the columns. By default, they are arranged in descending order of total visits. You can filter by the top three highly visited pages. Click on Export to download an excel file of the data.
The user related information displayed are Users (Username), Role (Manager, Seller etc.), Total Visits.
6. Avg Time Spent
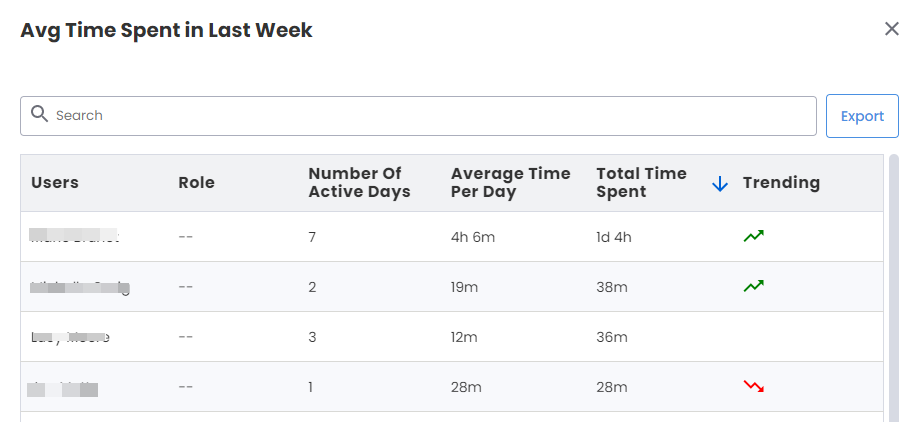
Shows the average time spent in meetings for the selected filter(s). Shows the upward/downward trend compared to the previous period for the selected filter(s). Click to view the details in a slide out. Key in the username to search in the search box. The details can be sorted (ascending/descending) by any of the columns. By default, they are arranged in descending order of average time per day. Click on Export to download an excel file of the data.
The user related information displayed are Users (Username), Role (Manager, Seller etc.), Number Of Active Days, Average Time Per Day, Total Time Spent, and Trending.
7. Meetings Distribution
It consists of three tabs:
All: It shows the donut chart for all the meetings that includes both the internal and external meetings
Internal: It shows the donut chart for all the internal meetings only
External: It shows the donut chart for all the external meetings only.
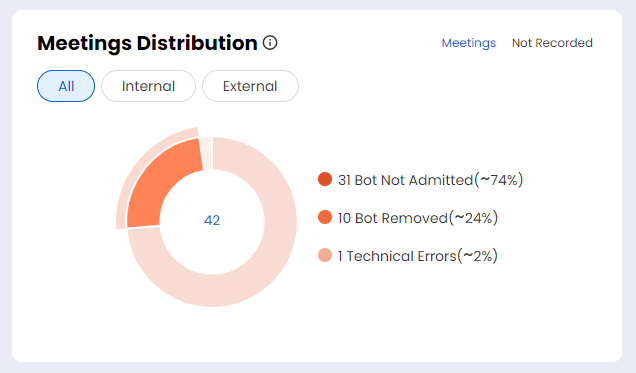
Shows the meetings distribution with respect to meetings that are processed and meetings that are not processed for various reasons as a donut chart for the selected filter(s). Hover above any of the colored zone in the donut chart to view the number of meetings and the approximate percentage in a pop out. Click the colored zone in the donut chart or the color legend to view the meeting details in a pop out on the right.
The meetings distribution is as follows:
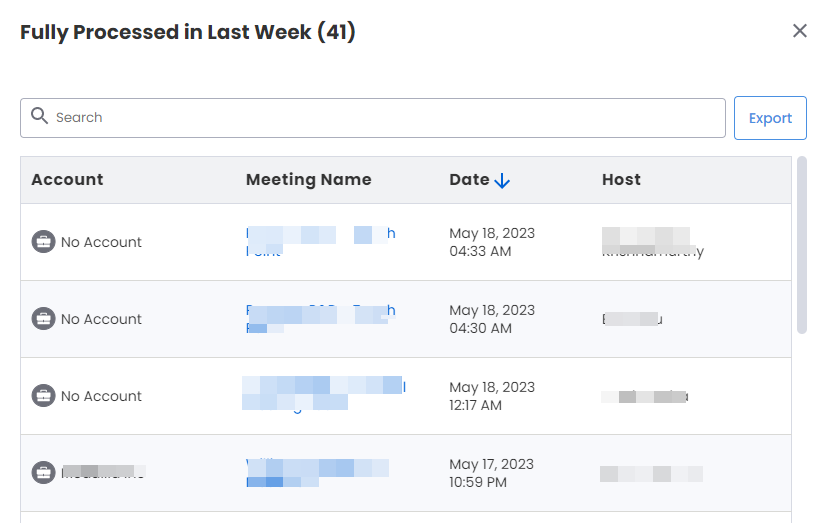
Fully Processed: Meetings recorded and successfully processed/analyzed for the selected filter(s). Click to view the details in a slide out. Key in the account or meeting name to search in the search box. The details can be sorted (ascending/descending) by any of the columns. By default, they are arranged in descending order of date. Click on Export to download an excel file of the data.
The user related information displayed are Account (Account name), Meeting Name, Date, and Host (Host name).
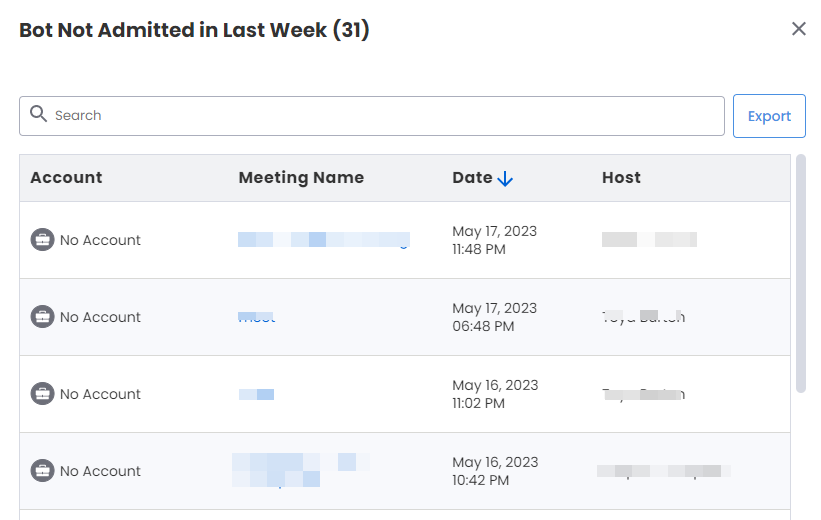
Bot Not Admitted: Meetings not processed/analyzed since the bot was not admitted to the meeting by the host for the selected filter(s). Click to view the details in a slide out. Key in the account or meeting name to search in the search box. The details can be sorted (ascending/descending) by any of the columns. By default, they are arranged in descending order of date. Click on Export to download an excel file of the data.
The user related information displayed are Account (Account name), Meeting Name, Date, and Host (Host name).
When you click on Bot Not Admitted, Bot Removed or Others the donut chart view changes to show only the not recorded (not processed/analyzed) meetings as follows:
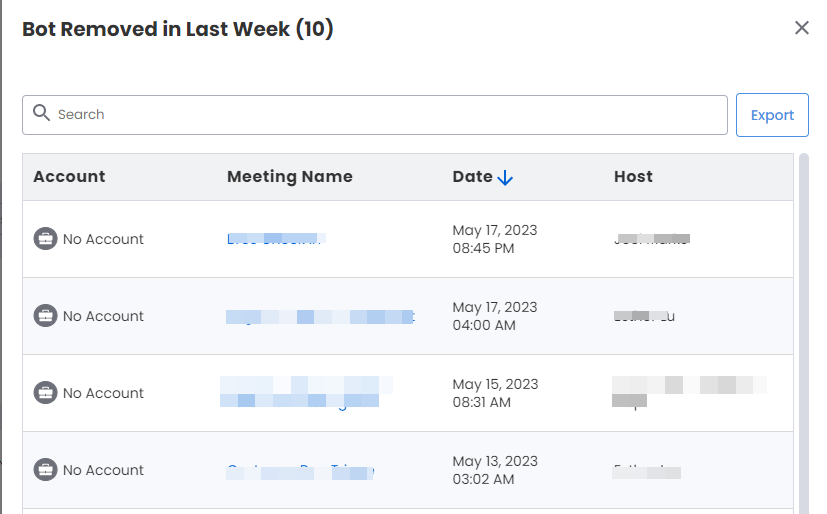
Bot Removed: Meetings not processed/analyzed since the bot was manually removed from the meeting by the host for the selected filter(s). Click to view the details in a slide out. Key in the account or meeting name to search in the search box. The details can be sorted (ascending/descending) by any of the columns. By default, they are arranged in descending order of date. Click on Export to download an excel file of the data.
The user related information displayed are Account (Account name), Meeting Name, Date, and Host (Host name).
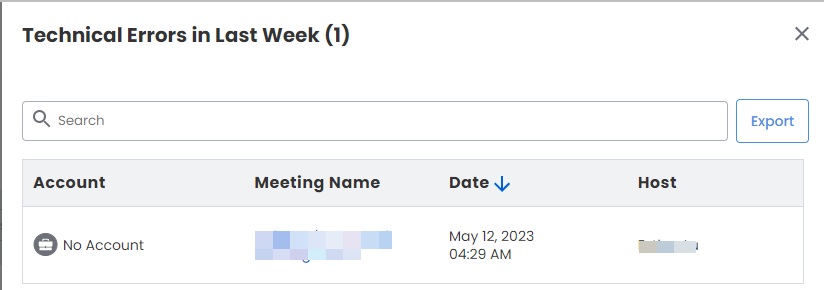
Others: Meetings not processed/analyzed due to other reasons for the selected filter(s). This may include meetings with other issues such as technical errors etc. Click to view the details in a slide out. Key in the account or meeting name to search in the search box. The details can be sorted (ascending/descending) by any of the columns. By default, they are arranged in descending order of date. Click on Export to download an excel file of the data.
The user related information displayed are Account (Account name), Meeting Name, Date, and Host (Host name).
8. Conversation Interactions
The Reviewed Meetings section is renamed as Conversation Interactions. It shows the meetings as a colored bar graph classified as follows:
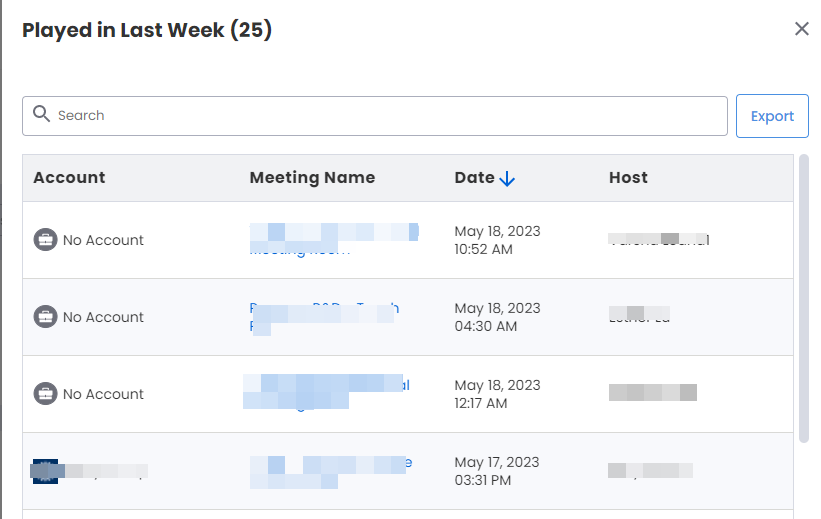
Played: The number of meetings that were replayed/viewed at least once by "Sales Interaction Agent" users for the selected filter(s). Click on the colored bar to view the details in a slide out. Key in the account or meeting name to search in the search box of the slide out. The details can be sorted (ascending/descending) by any of the columns. By default, they are arranged in descending order of date. Click on Export to download an excel file of the data.
The user related information displayed are Account (Account name), Meeting Name, Date, and Host (Host name).
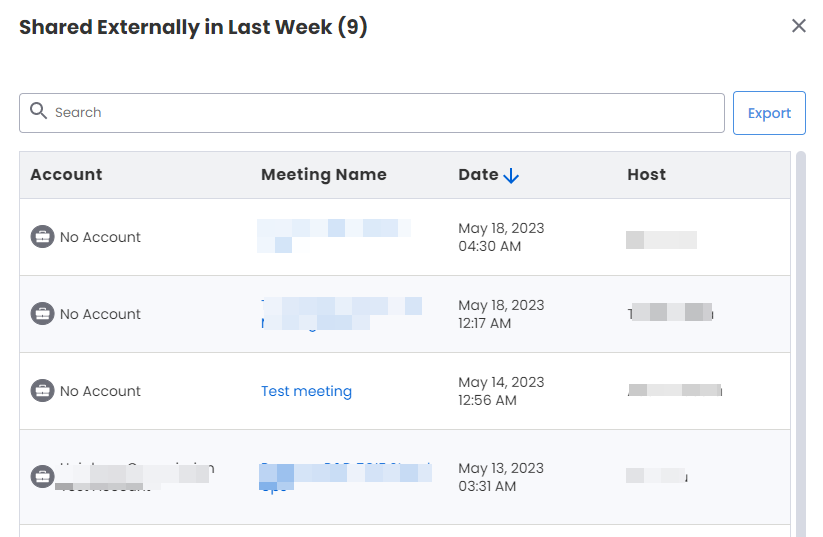
Shared Externally: The number of meetings that were shared with and viewed by non "Sales Interaction Agent" users for the selected filter(s). Click on the colored bar to view the details in a slide out. Key in the account or meeting name to search in the search box of the slide out. The details can be sorted (ascending/descending) by any of the columns. By default, they are arranged in descending order of date. Click on Export to download an excel file of the data.
The user related information displayed are Account (Account name), Meeting Name, Date, and Host (Host name).
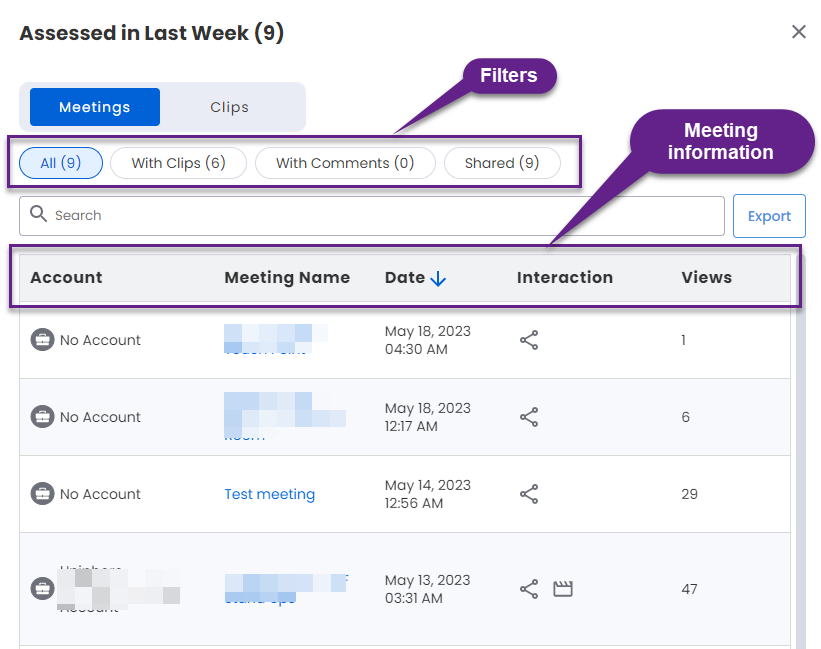
Assessed: The number of meetings with user actions such clips created, comments added, and are shared for the selected filter(s). Click on the colored bar to view the details in a slide out. Key in the account or meeting name to search in the search box. The details can be sorted (ascending/descending) by any of the columns. By default, they are arranged in descending order of date. Click on Export to download an excel file of the data.
The user related information displayed are Account (Account name), Meeting Name, Date, Interaction (shared, clips created, and comments added) and Views (number of views).