Process Intelligence
Process Intelligence automatically identifies and models how work actually happens across your organization by analyzing recorded agent interactions, including screen recordings, audio, and transcripts. By observing real execution patterns across people, systems, and conversations, Process Intelligence surfaces friction, highlights inefficiencies, and reveals where improvement and automation make the most sense. Use Process Intelligence to explore discovered processes, compare path variants, examine individual occurrences, and create Standard Operating Procedures (SOPs) that reflect how your organization actually operates.
Who Should Use Process Intelligence
Process Intelligence is built for any organization that wants to understand, document, or automate its repeating operational work. Typical users include:
Operations leaders and process owners: responsible for the throughput and quality of repeating work.
Automation strategists: building a pipeline of high-value automation candidates and the artifacts to deliver them.
Contact-center managers: measuring agent workflows across calls and case-handling.
Back-office and shared-services teams: documenting and standardizing internal procedures.
A typical engagement: a head of customer operations wants to know which steps in their refund-handling process consume the most agent time, which tools agents context-switch between, and which steps would deliver measurable savings if automated.
From diagnosis to delivery: Process Intelligence is more than an analysis tool. It produces the building blocks for automation. Once a candidate is identified, Process Intelligence generates ready-to-use automation artifacts: Skills, Tools, Entities, and Business Rules. These plug directly into LLM-powered agents. The same pipeline that diagnoses where to automate also produces what's needed to ship the automation.
How Processes Are Imported and Identified
A process is a standardized, end‑to‑end sequence of steps used to achieve a specific business intent (e.g., "New Account Opening" or "Password Reset").
For Process Intelligence to identify processes and make initial assessments, your organization's source data (recordings and other data files) must be made available to it.
Ingesting Data
Process Intelligence offers two methods for data import:
Automatic importing of Chronos screen recordings via connectors. This is how the bulk of the data should be ingested.
Manually importing additional data files as a quick means of filling gaps, testing, etc.
The best solution for your environment might involve one or both methods. For example, if you have a repository of historical transcripts in JSON format or audio/video files, you can manually upload those artifacts. If you install Chronos to record customer sessions, that data is automatically ingested into Process Intelligence for analysis via a connector you configure.
Depending on your level of access, some controls, pages, or information may not be available to you. Contact your administrator if you have questions about role-based access.
Data Security
A chief concern when uploading recordings of customer interactions is data security. Keeping Personally Identifiable Information (PII) safe is critical.
You can configure Process Intelligence to automatically remove or redact PII from files as they are uploaded into Process Intelligence via connectors, so the information is never at risk of exposure.
You can configure redaction behavior via the Connector configuration.
For manual file upload, contact Uniphore for PII redaction options.
Screen Recordings vs. Explainer Videos
In Process Intelligence, screen recordings and explainer videos are two distinct video input types, each ingested differently.
Screen Recordings: Uniphore's client-side tool, Chronos, runs in the background and continuously records the user's desktop. This produces many hours of raw screen activity captured across multiple associates (human agents/employees). Chronos screen recordings can only be uploaded via connectors.
Explainer Videos: You provide tutorial-style videos that walk through a specific process end-to-end. Each video maps to exactly one process, so the pipeline skips clustering and treats the video as a single, authoritative demonstration. You can split a single long process across multiple shorter videos. If you do, submit the segments together as a group, and the pipeline stitches them into a single process rather than treating each segment separately. Follow these best practices when creating an explainer video.
Data Ingest Overview
Connector (Chronos) | Connector (BYOD) | Manual Upload | |
|---|---|---|---|
Connector Type | GCS or FTP | GCS or FTP | n/a |
Supported Data Types | Chronos Screen Recording | Explainer Video, Transcript (JSON), Audio, other .pdf files | Explainer Video, Transcript (JSON), Audio, other .pdf files |
PII Redaction | Via Connector config | Via Connector config | Contact Uniphore |
Best for | Ongoing real-time capture across your team | Historical data repositories where PII redaction is needed; explainer videos | Ad hoc uploads; one-off explainer videos |
Importing Screen Recordings via Connector
Ensure Chronos is installed on your team's computers to record interactions, which are automatically uploaded to a cloud location you specify. See the installation instructions on the Chronos site.
Configure Connectors (including PII redaction) via the Connectors page once you have Chronos installed. A connector pulls Chronos recordings from the customer cloud to the specified GCP or SFTP server and makes them available for discovery.
Process all uploaded data files and Chronos recordings by clicking Run Process Discovery on the Data View page.
Process Intelligence begins discovery. Go to the Cognitive Analysis page to view the discovered processes.
Importing Additional Data Artifacts via Connector
You can import additional data artifacts via a connector by using the "Bring Your Own Data" (BYOD) connector type. When you use a connector to import data, you can enable PII redaction.
Configure Connectors (including PII redaction) via the Connectors page. Select the "Bring Your Own Data" (BYOD) connector type.
Process all uploaded data files and Chronos recordings by clicking Run Process Discovery on the Data View page.
Process Intelligence begins discovery. Go to the Cognitive Analysis page to view the discovered processes.
Manually Uploading Additional Data Artifacts
The Upload Files option is best suited for smaller, one-off uploads. Uploading a large number of files or very large files manually may be less reliable, as long-running uploads can be affected by browser or network interruptions. For recurring, large-scale, or production data ingestion, use Connectors, as they provide a more reliable and scalable ingestion workflow.
Manually upload additional data files (including explainer videos) via the Data View page.
Process all uploaded data files and Chronos recordings by clicking Run Process Discovery on the Data View page.
Process Intelligence begins discovery. Go to the Cognitive Analysis page to view the discovered processes.
Working with Processes
Once your source files have been uploaded and Process Intelligence has identified your processes, you can:
View Artifacts - Review the source data behind the processes. Examine the raw recordings, logs, and transcripts that underpin all Process Intelligence data. Use the Data View page in the Artifacts section of the navigation panel.
Discover - Gather insight and explore the processes Process Intelligence identified to learn more about them. Use the Process Explorer and Process Occurrences pages available in the Discovery section of the navigation panel.
Perform Analysis - Build understanding and see how the processes are used. Process Intelligence provides both metrics and actionable insights. View process usage and identify bottlenecks, inefficiencies, and other issues. Use the Cognitive Analysis and Variant Analysis pages in the Analysis section of the navigation panel.
Optimize Process - Identify and implement process improvements. Use the SOP Studio page in the Optimization section of the navigation panel. SOP Studio captures the target behavior. Process Optimization and Automation Journey turn diagnosis into an action plan. ROI Analysis quantifies the value of each action.
Getting Started
To begin, go to the home page > Agents > Data Layer > Process Intelligence.
The Cognitive Analysis page for your project opens. This is the default landing page for your project, and the best place to get started. If you have access to multiple projects, you can select a project via the Project dropdown available on each Process Intelligence page.
Depending on your level of access, some controls, pages, or information may not be available to you. Contact your administrator if you have questions about role-based access.
Learn More
For more information about Process Intelligence, see:
Cognitive Analysis
When you first select a project or click Cognitive Analysis in the navigation panel, the Cognitive Analysis page is displayed.
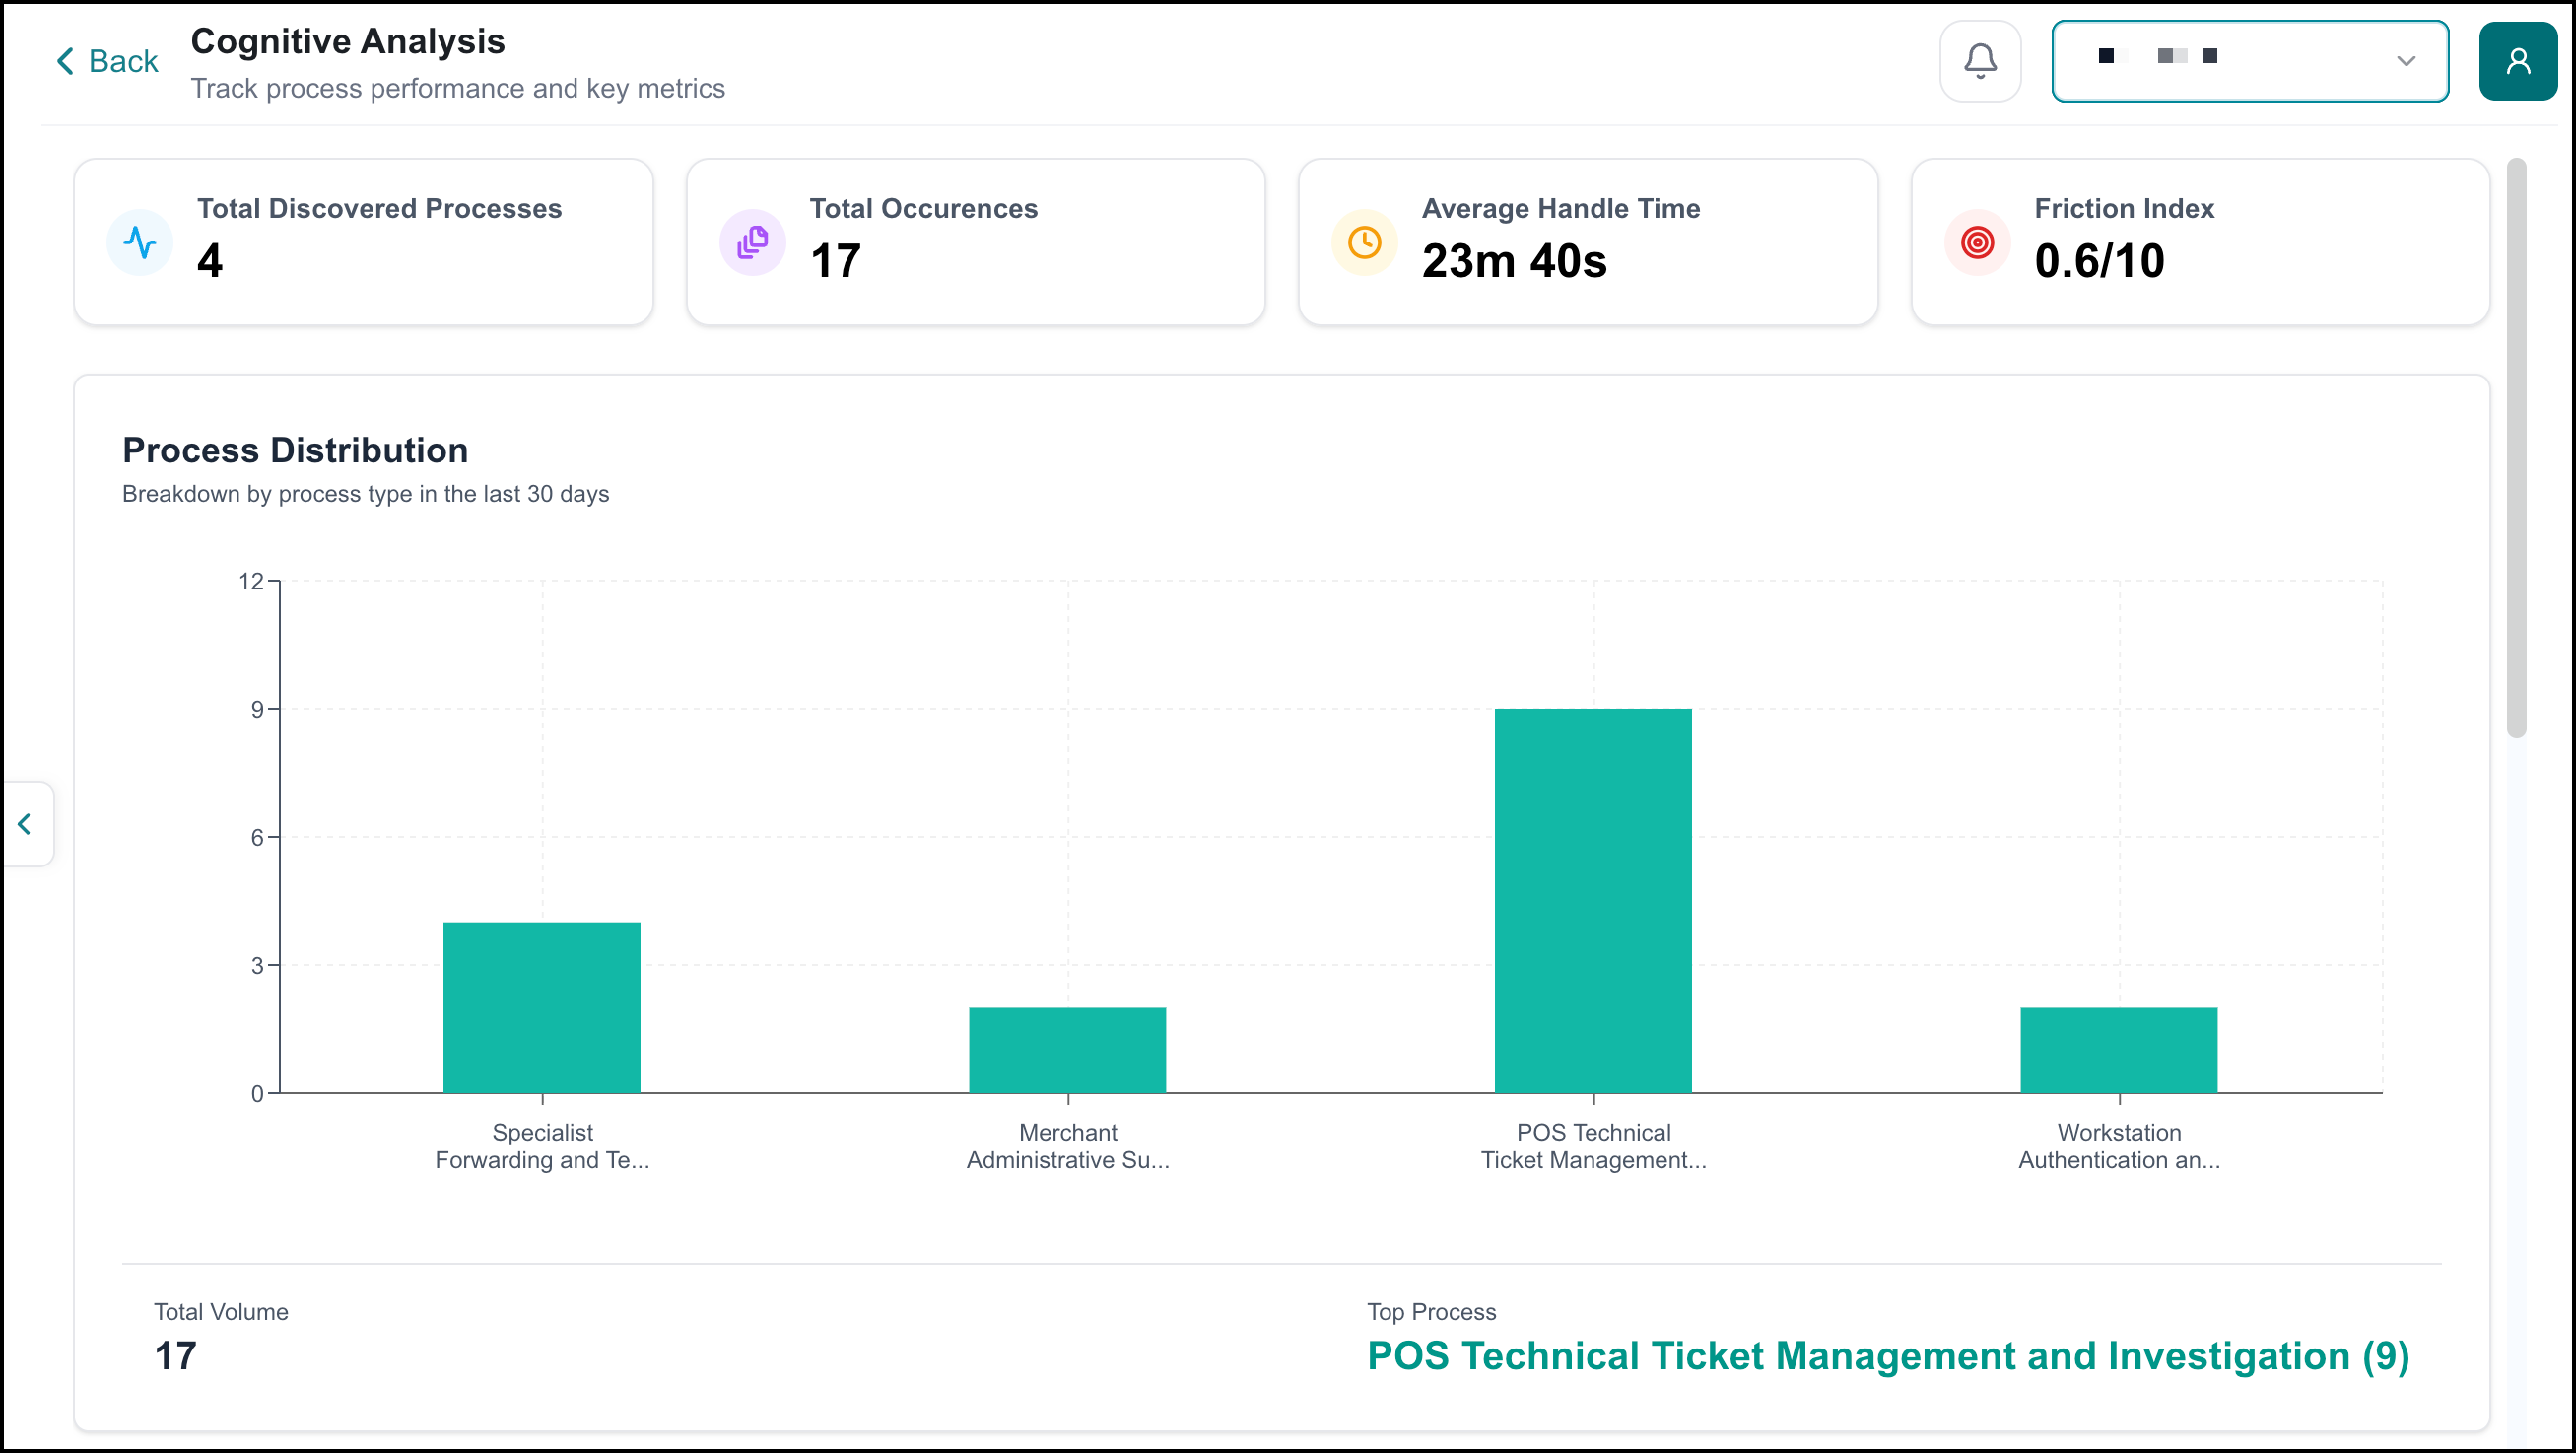
The Cognitive Analysis page provides insight into your project's overall status and is organized into the following sections:
Metrics - High-level summary statistics give you an at-a-glance snapshot of your project's overall health and scale.
Total Discovered Processes - Number of identified processes in the project.
Total Occurrences - Number of identified transactions/interactions in the dataset.
Average Handle Time - Average total time taken to complete the process from start to finish, including hold times.
Friction Index - A 0-10 score quantifying operational drag based on system switching, loops, and silence.
Process Distribution Chart – A visual breakdown shows how discovered processes are distributed across your dataset.
Performance Trend Chart – A combined chart displays Average Handle Time (AHT) and instance volume trends, and allows you to assess process performance over time.
Process Inefficiencies – Listings identify common process inefficiencies in your project:
Top Bottlenecks – Steps or handoffs where work is stalling or delayed.
Ping-Pong Behavior – Repetitive back-and-forth patterns between departments or teams. Coming soon.
Manual Process Steps – Activities requiring human intervention that present automation potential. Coming soon.
Process Explorer
The Process Explorer page is your primary tool for examining the processes identified in your project. It provides a structured view of all discovered processes, key performance metrics, and AI-generated recommendations. Use Process Explorer to drill down into a specific process and examine how it is executed, including any variants or alternate paths.
To open Process Explorer, click Process Explorer in the navigation panel under Discovery.
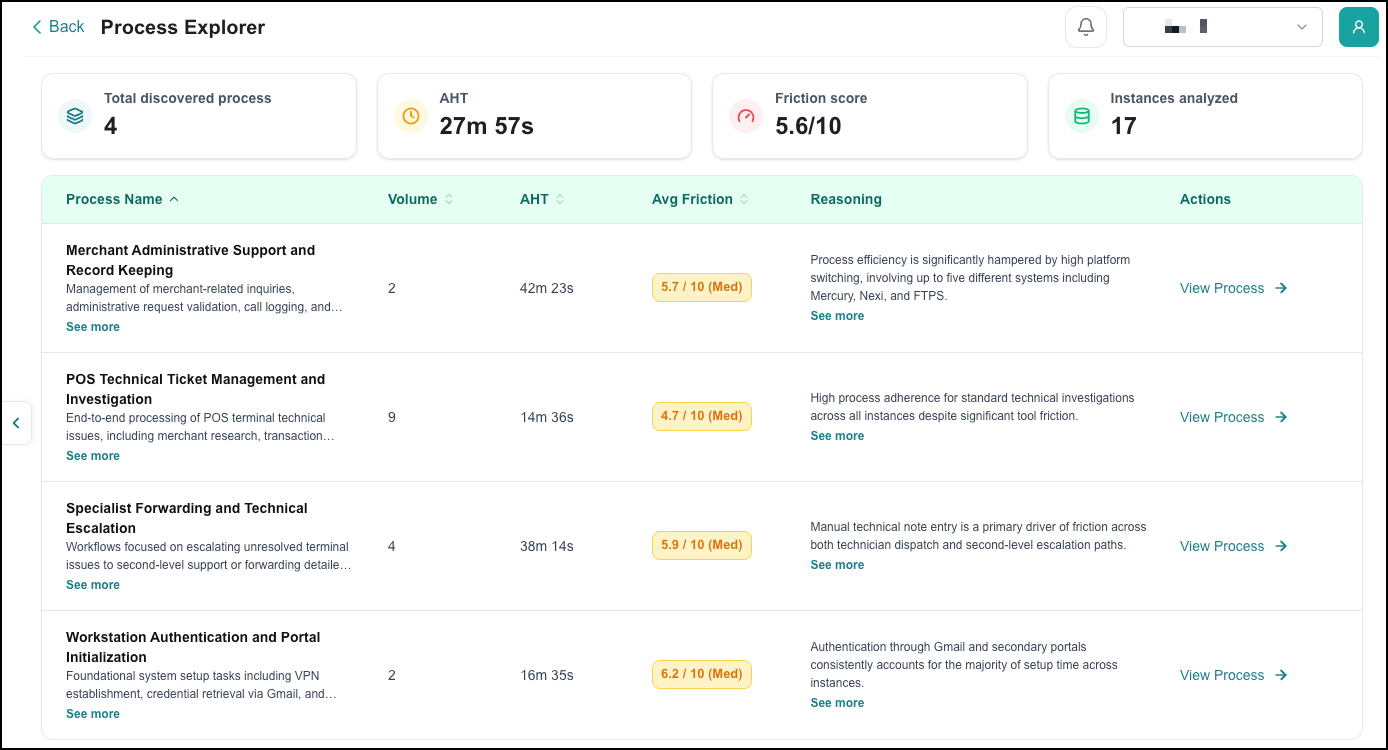
The Process Explorer page opens and displays a list of processes based on selected workspace, along with summary metrics.
Using the Process List
The process list displays all discovered processes in your project.
Each row in the process list represents a single discovered process and includes the following columns:
Column | Description |
|---|---|
Process Name | The name of the identified process. Click the name to open the detailed process view. |
Volume | The number of times this process occurred in the dataset. |
AHT | Average Handle Time — the average time to complete this process from start to finish. |
Average Friction | The average Friction Index score (0–10) for this process, with a qualitative label (High/Med/Low). Higher scores indicate more operational drag. |
Reasoning | A brief AI-generated summary of the key factors contributing to friction, inefficiency, or complexity in this process. |
Actions | A View Process link that opens the detailed process view for this process. |
Viewing an Individual Process
In Process Explorer, you can drill down into a specific process to understand exactly how it executes and which variants or alternate paths exist. While your organization may have one documented "happy path" for a process, analysis of actual recordings typically reveals several variants: different paths agents actually take to complete the same process. These variants may reflect different outcomes, escalation paths, workarounds, manual interventions, and more.
To open a process, either click its name in the process list or click View Process in the Actions column.
From here, you can view and compare paths, review metrics, see root cause analysis and recommended actions for each path, and export a report about the process.
Process View Overview
When you open a process, you are viewing it at an aggregate level, so the view reflects all recorded occurrences of that process across your dataset, not a single instance. Once opened, the process view provides:
Paths used in the selected process.
The Map view, which shows the process flow for the selected path or paths. The Map view includes additional insights about root causes and potential next steps.
The Analytics view, which provides deeper information on the identified process bottlenecks, root causes, and possible recommendations to improve the process.
A link to create an SOP for the process via the SOP Studio.
You can use this view to see which processes are running in your organization and where bottlenecks happen.
Paths
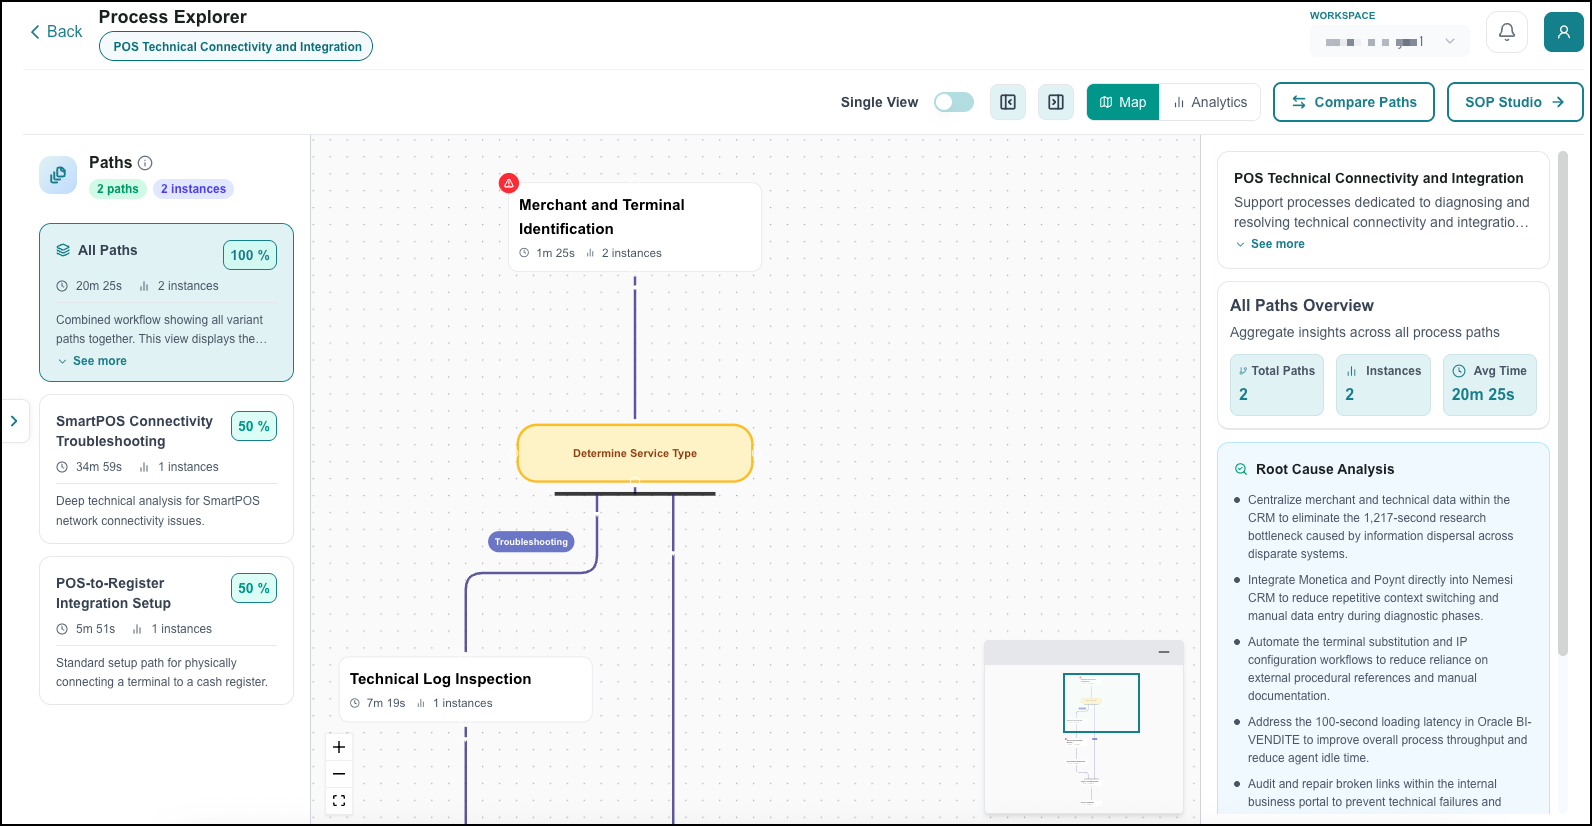
All identified paths for a process are displayed in a stack view next to the Map or Analysis screen. Each path represents a distinct way the process is being executed.
In addition to individual paths, Process Explorer includes an "All Paths" path that combines workflow information from all variants into a single process map, and shows all possible execution paths, decision points, and outcomes.
Click a path to view its details in the Map or Analysis view.
Map View
The Map view displays the process flow for the selected path, and shows each step in sequence, including branches, decision points, and outcomes.
Toggle the level of detail shown in the flow to focus on the information most relevant to your analysis.
You can drag (move) or resize paths:
Click + to zoom in.
Click - to zoom out.
Click the Fit
 icon to fit the path in the view.
To view all of the paths side-by-side, change from Single View to View Paths.
 |
This provides an at-a-glance view of all of the paths. Use Compare Paths to view the path in the Variant Analysis page and get a more detailed comparison between two or more paths.
Insights
The side panel provides general insights into the selected path, including Root Cause Analysis and suggested actions.
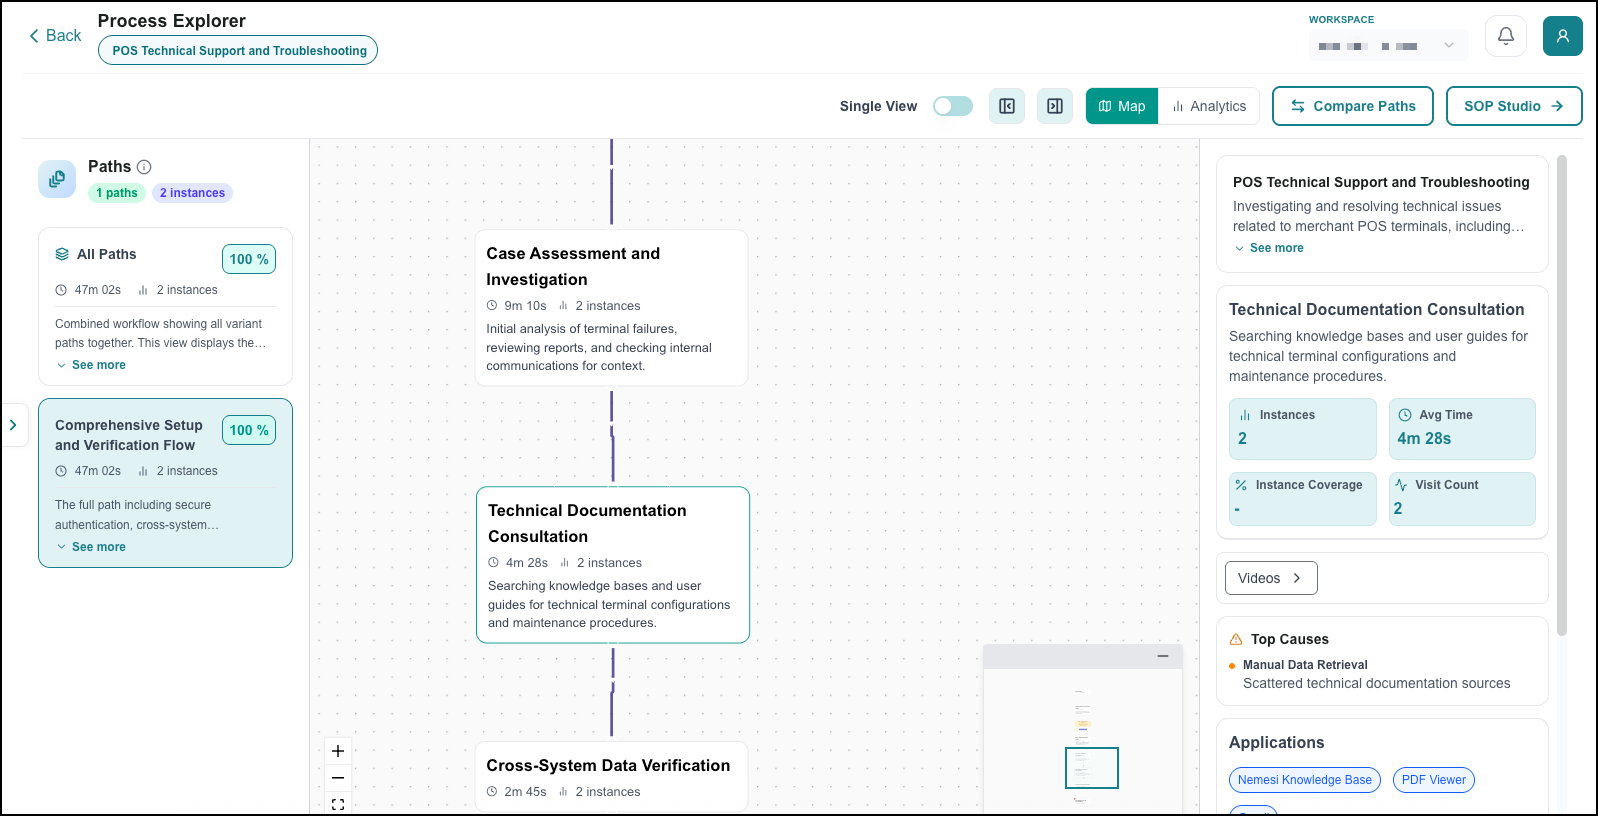
Click any step in the process flow to drill down and see more information. You can explore the source material (video, transcript, or audio) that Process Intelligence used to build the map. Use these sources to validate accuracy and understand the context behind specific steps or decisions. The detailed view also highlights the identified bottlenecks, the applications involved, and the activities performed for that step in the path.
Analytics View
The Analytics view shows detailed metrics and graphs for the selected process. The page shows:
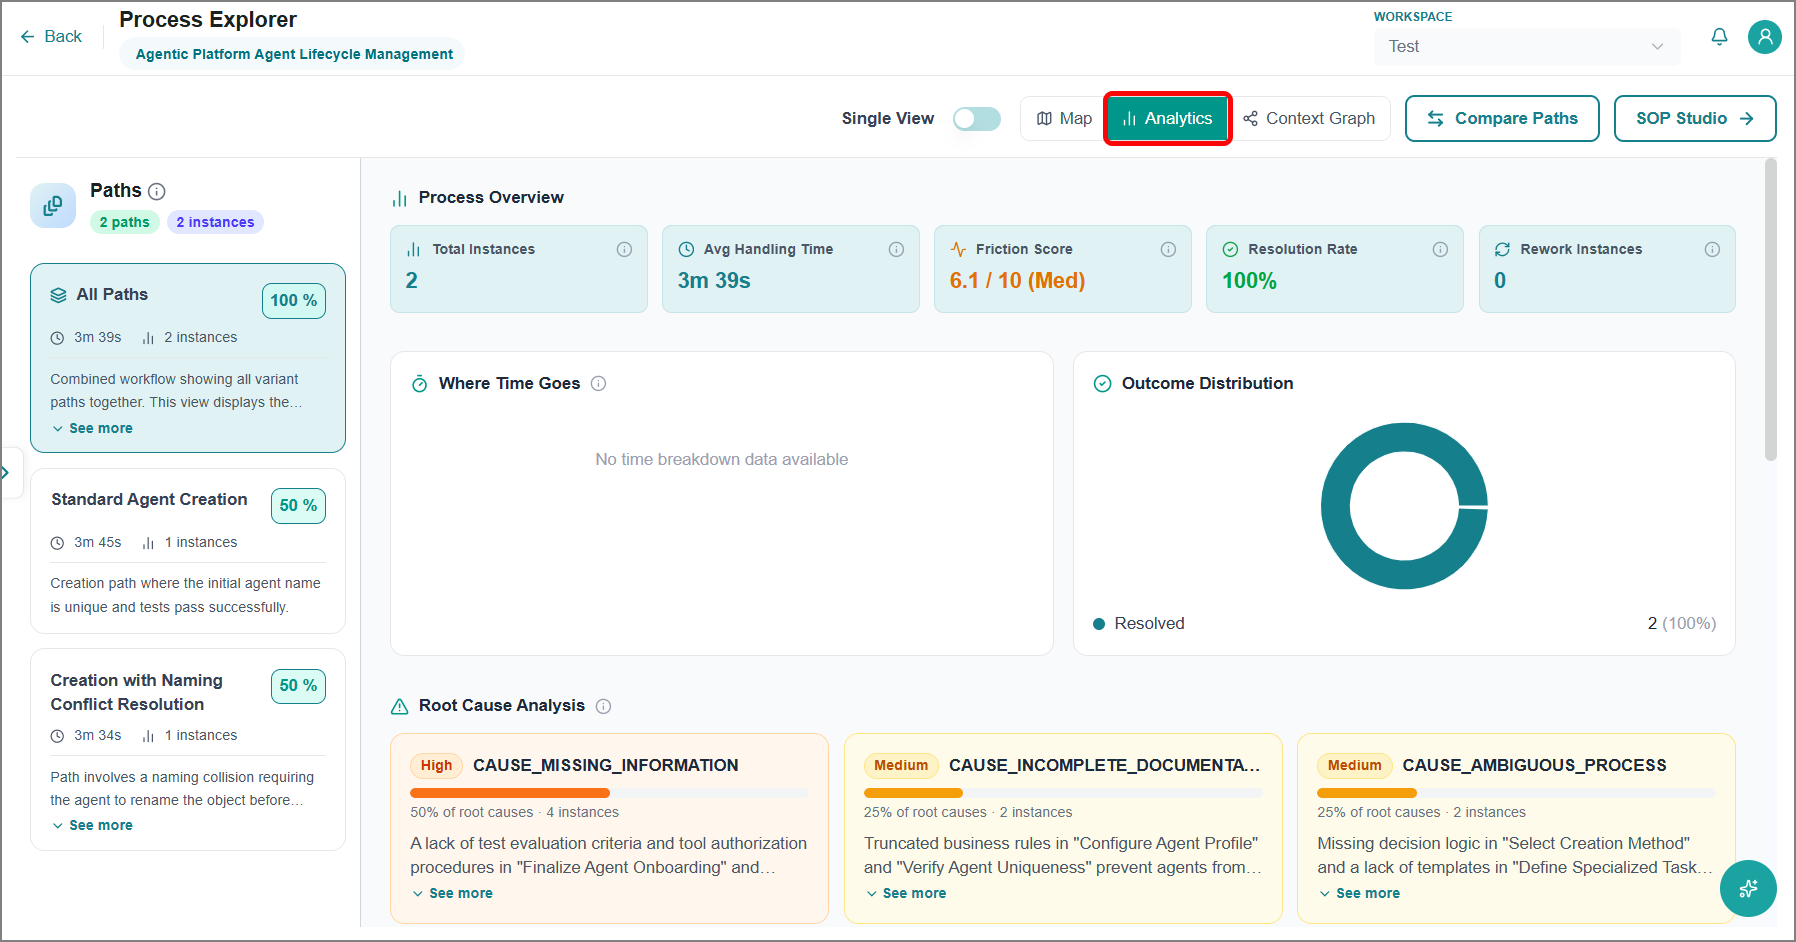
Time Usage Breakdown (chart, available only for screen recording video sources): The amount of time spent on each phase of the process.
Outcome Distribution (chart): The amount of time spent in each application.
Bottleneck Information: Two views of where the process is slowing down.
Step Bottlenecks - A ranked list of individual workflow steps with a percentage showing how often that step drags out. A "vertical" view of information about a single step.
Bottlenecks - Observations across the entire process. Less specific than Step Bottlenecks, but a "horizontal" view across steps.
Root Cause Analysis and Summary: What is fundamentally driving the inefficiency. While bottlenecks describe the symptoms of the issue, the Root Cause Analysis shows what is actually causing it.
What's Going Well: Where the process is working as intended.
Recommended Next Steps: How and where to address the issues called out.
Context Graph View
The Context Graph view shows how the entities, steps, and processes within a selected process relate to one another as an interactive node graph. Instead of viewing the process as a linear sequence, you can see how process steps connect to data entities and how relationships. Use the Context Graph to understand data dependencies and structural relationships within a process.
To view the Context Graph:
From the Process Explorer page, select a process to open its detailed view.
Select the Context Graph tab.
The Context Graph opens and displays the process as a network of connected nodes, starting from the top-level process node.
Select a node to view more information about that step, entity, process, or path.
Click Settings to modify the graph view.
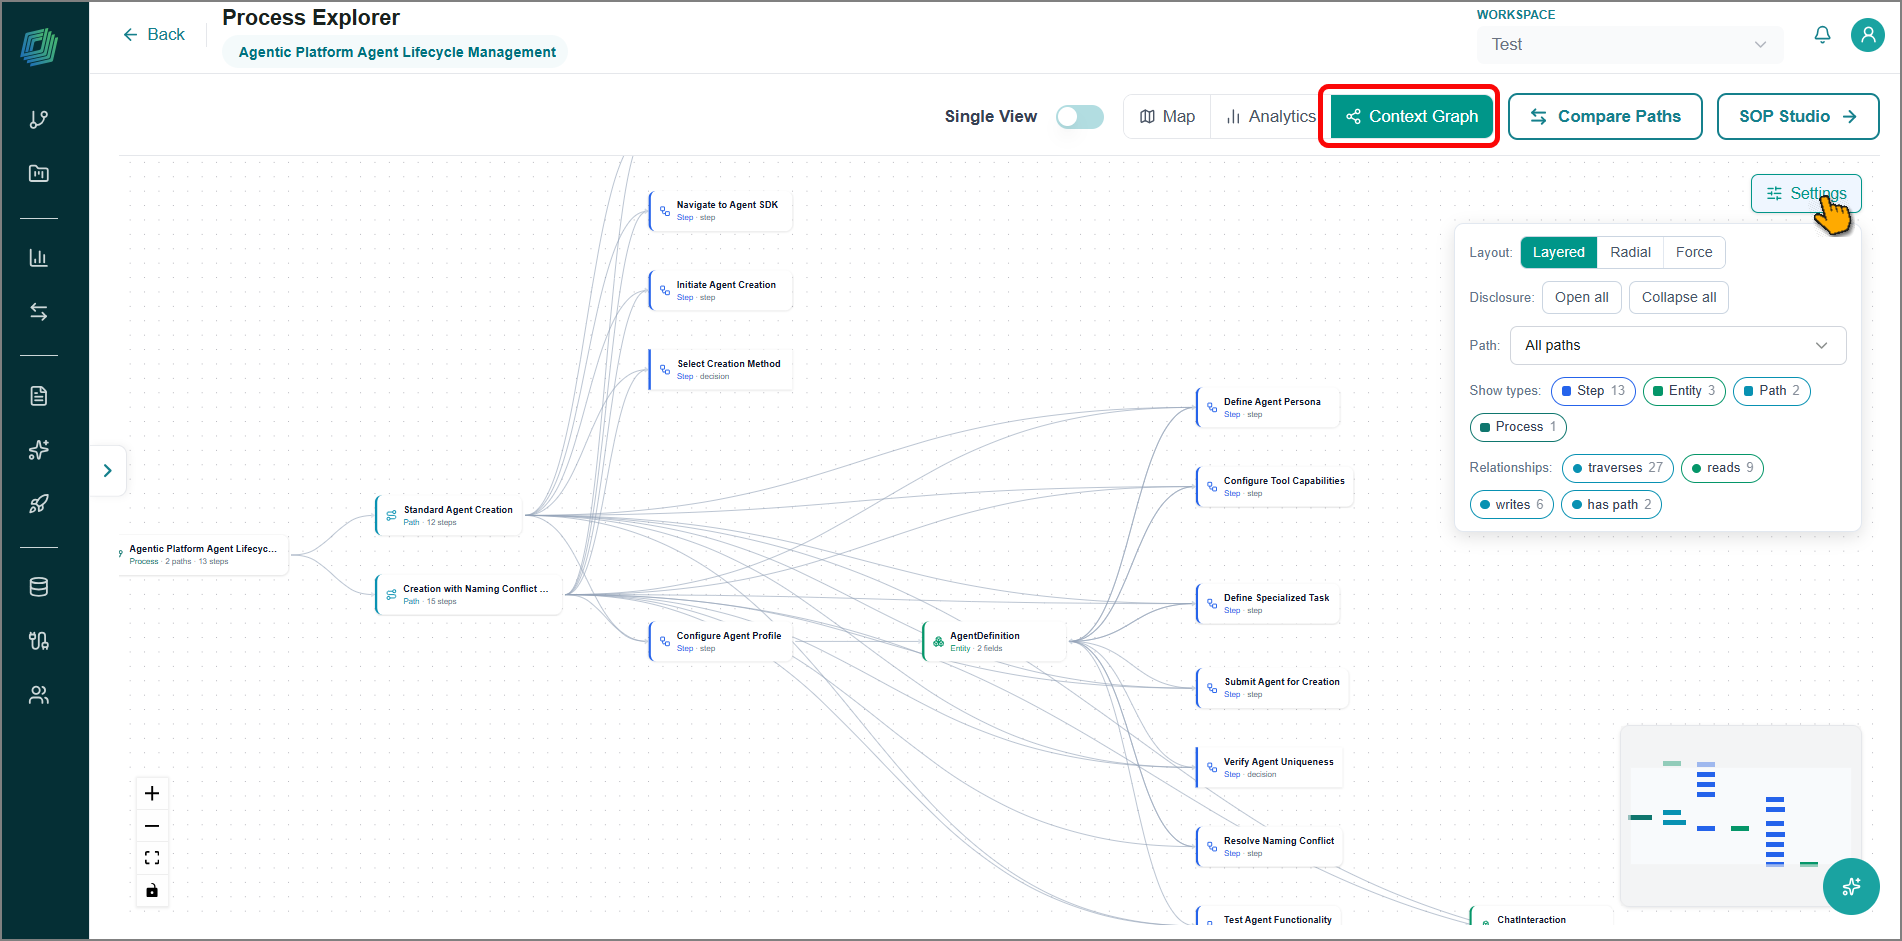
Use the Path dropdown to select which path to display. The graph updates to show only the steps and entities associated with the selected path.
Select a Layout option to change how the graph is arranged:
Layered - Arranges nodes in a hierarchical, left-to-right flow.
Radial - Arranges nodes in a circular pattern around a central node.
Force - Arranges nodes dynamically based on their relationships.
Under Disclosure, select Open all to expand every node, or Collapse all to show only top-level nodes.
Under Show types, select or clear the node types you want visible: Step, Entity, Process, or Path. Select Show all to display every type.
Under Relationships, select or clear the visible relationship types. Select Show all to display every relationship.
Use the mini-map in the bottom-right corner to navigate large graphs without losing your place.
Viewing Processes with BAIC Copilot
The BAIC Copilot in Process Explorer lets you ask questions about your process data in plain language and get an immediate answer, without manually navigating charts or tables. This helps you find specific details, such as friction scores or bottlenecks, faster than browsing the process list yourself.
To access a BAIC Copilot:
Go to the Home page > Data > Process Intelligence.
Select Process Explorer in the navigation panel under Discovery.
The Process Explorer page opens and displays the list of discovered processes.
Select the Process Agent icon at the bottom left.
The BAIC Copilot panel opens.
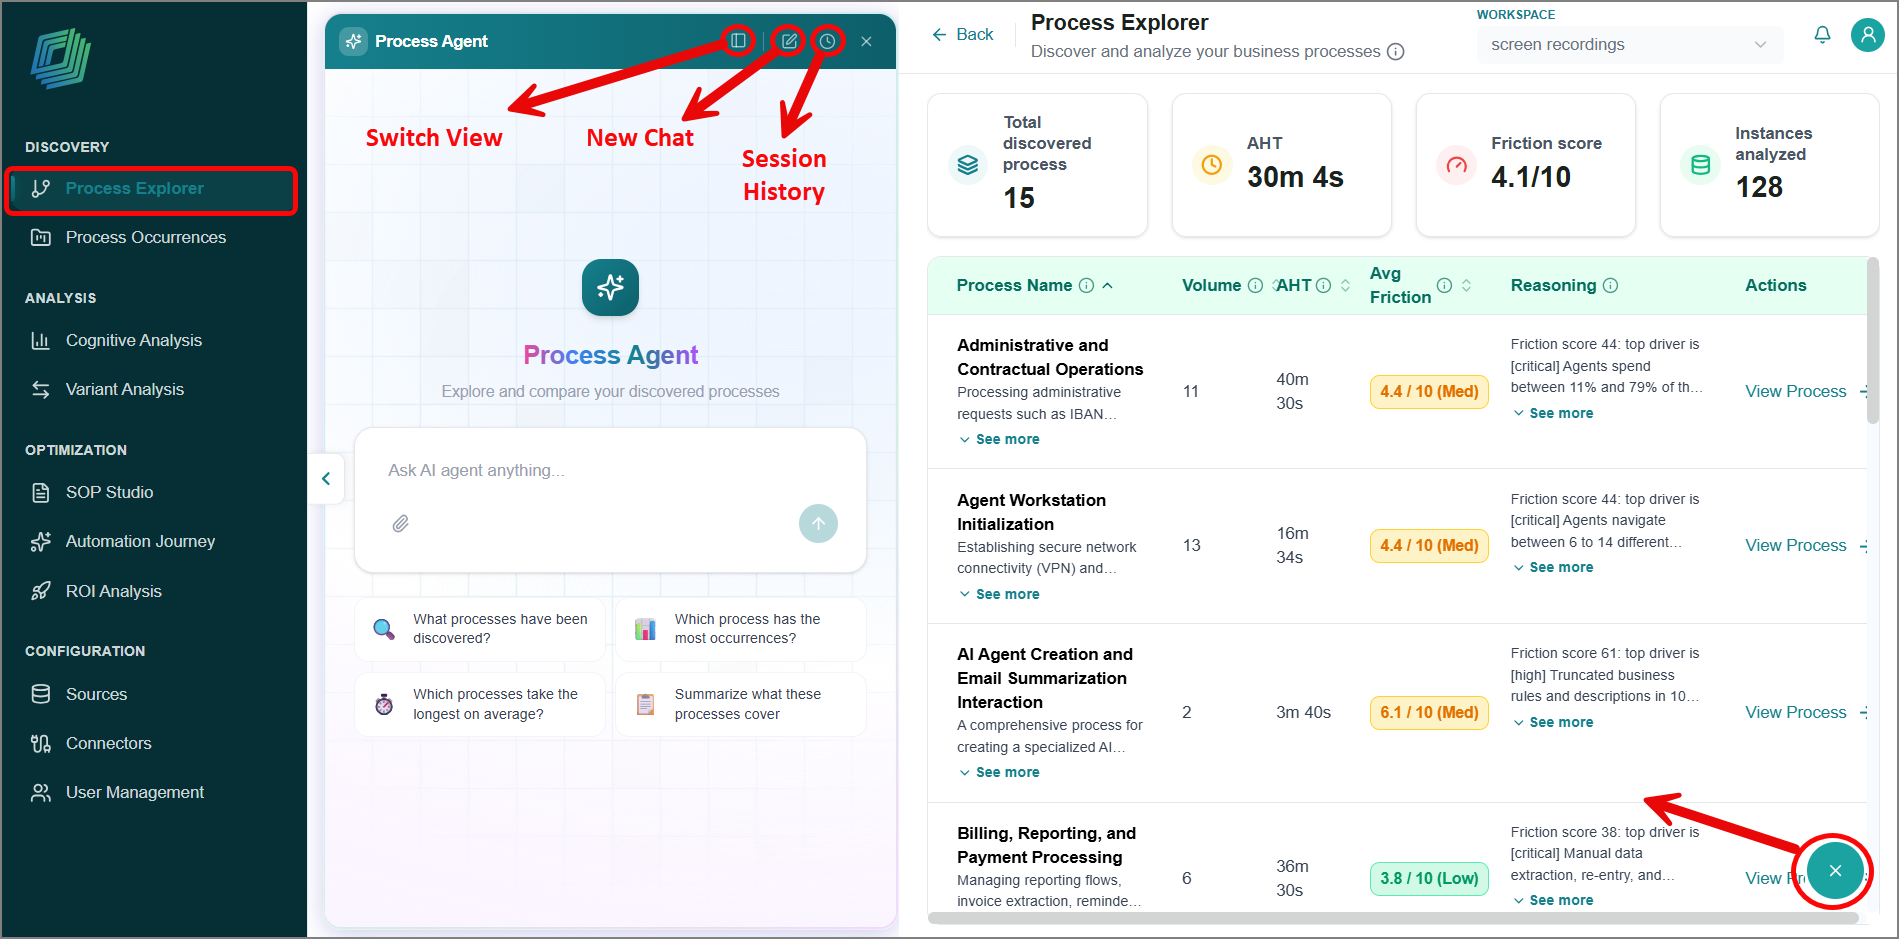
Type your question in plain language and press Enter.
The BAIC Copilot returns a direct answer based on your process data.
The panel has other capabilities:
View session history
Switch panel view
Create a new session
Process Occurrences
Process Occurrences lets you inspect the catalog of individual occurrences across all processes. This is the entry point for drilling into specific runs. An occurrence is a single, end-to-end execution of a process (for example, one specific call or one ticket) derived from raw evidence.
While Process Explorer is organized by process, Process Occurrences is organized by individual run. The screen is scoped to one process at a time, surfacing every occurrence of that process for inspection, sorting, and drilling into.
To access this page, click Process Occurrences in the navigation panel.
The Process Occurrences page opens and shows statistics and a list of individual occurrences for a given process. To change the process being examined, select it from the dropdown. To sort the list by Pathname, Agent, or Date, click the appropriate column header.
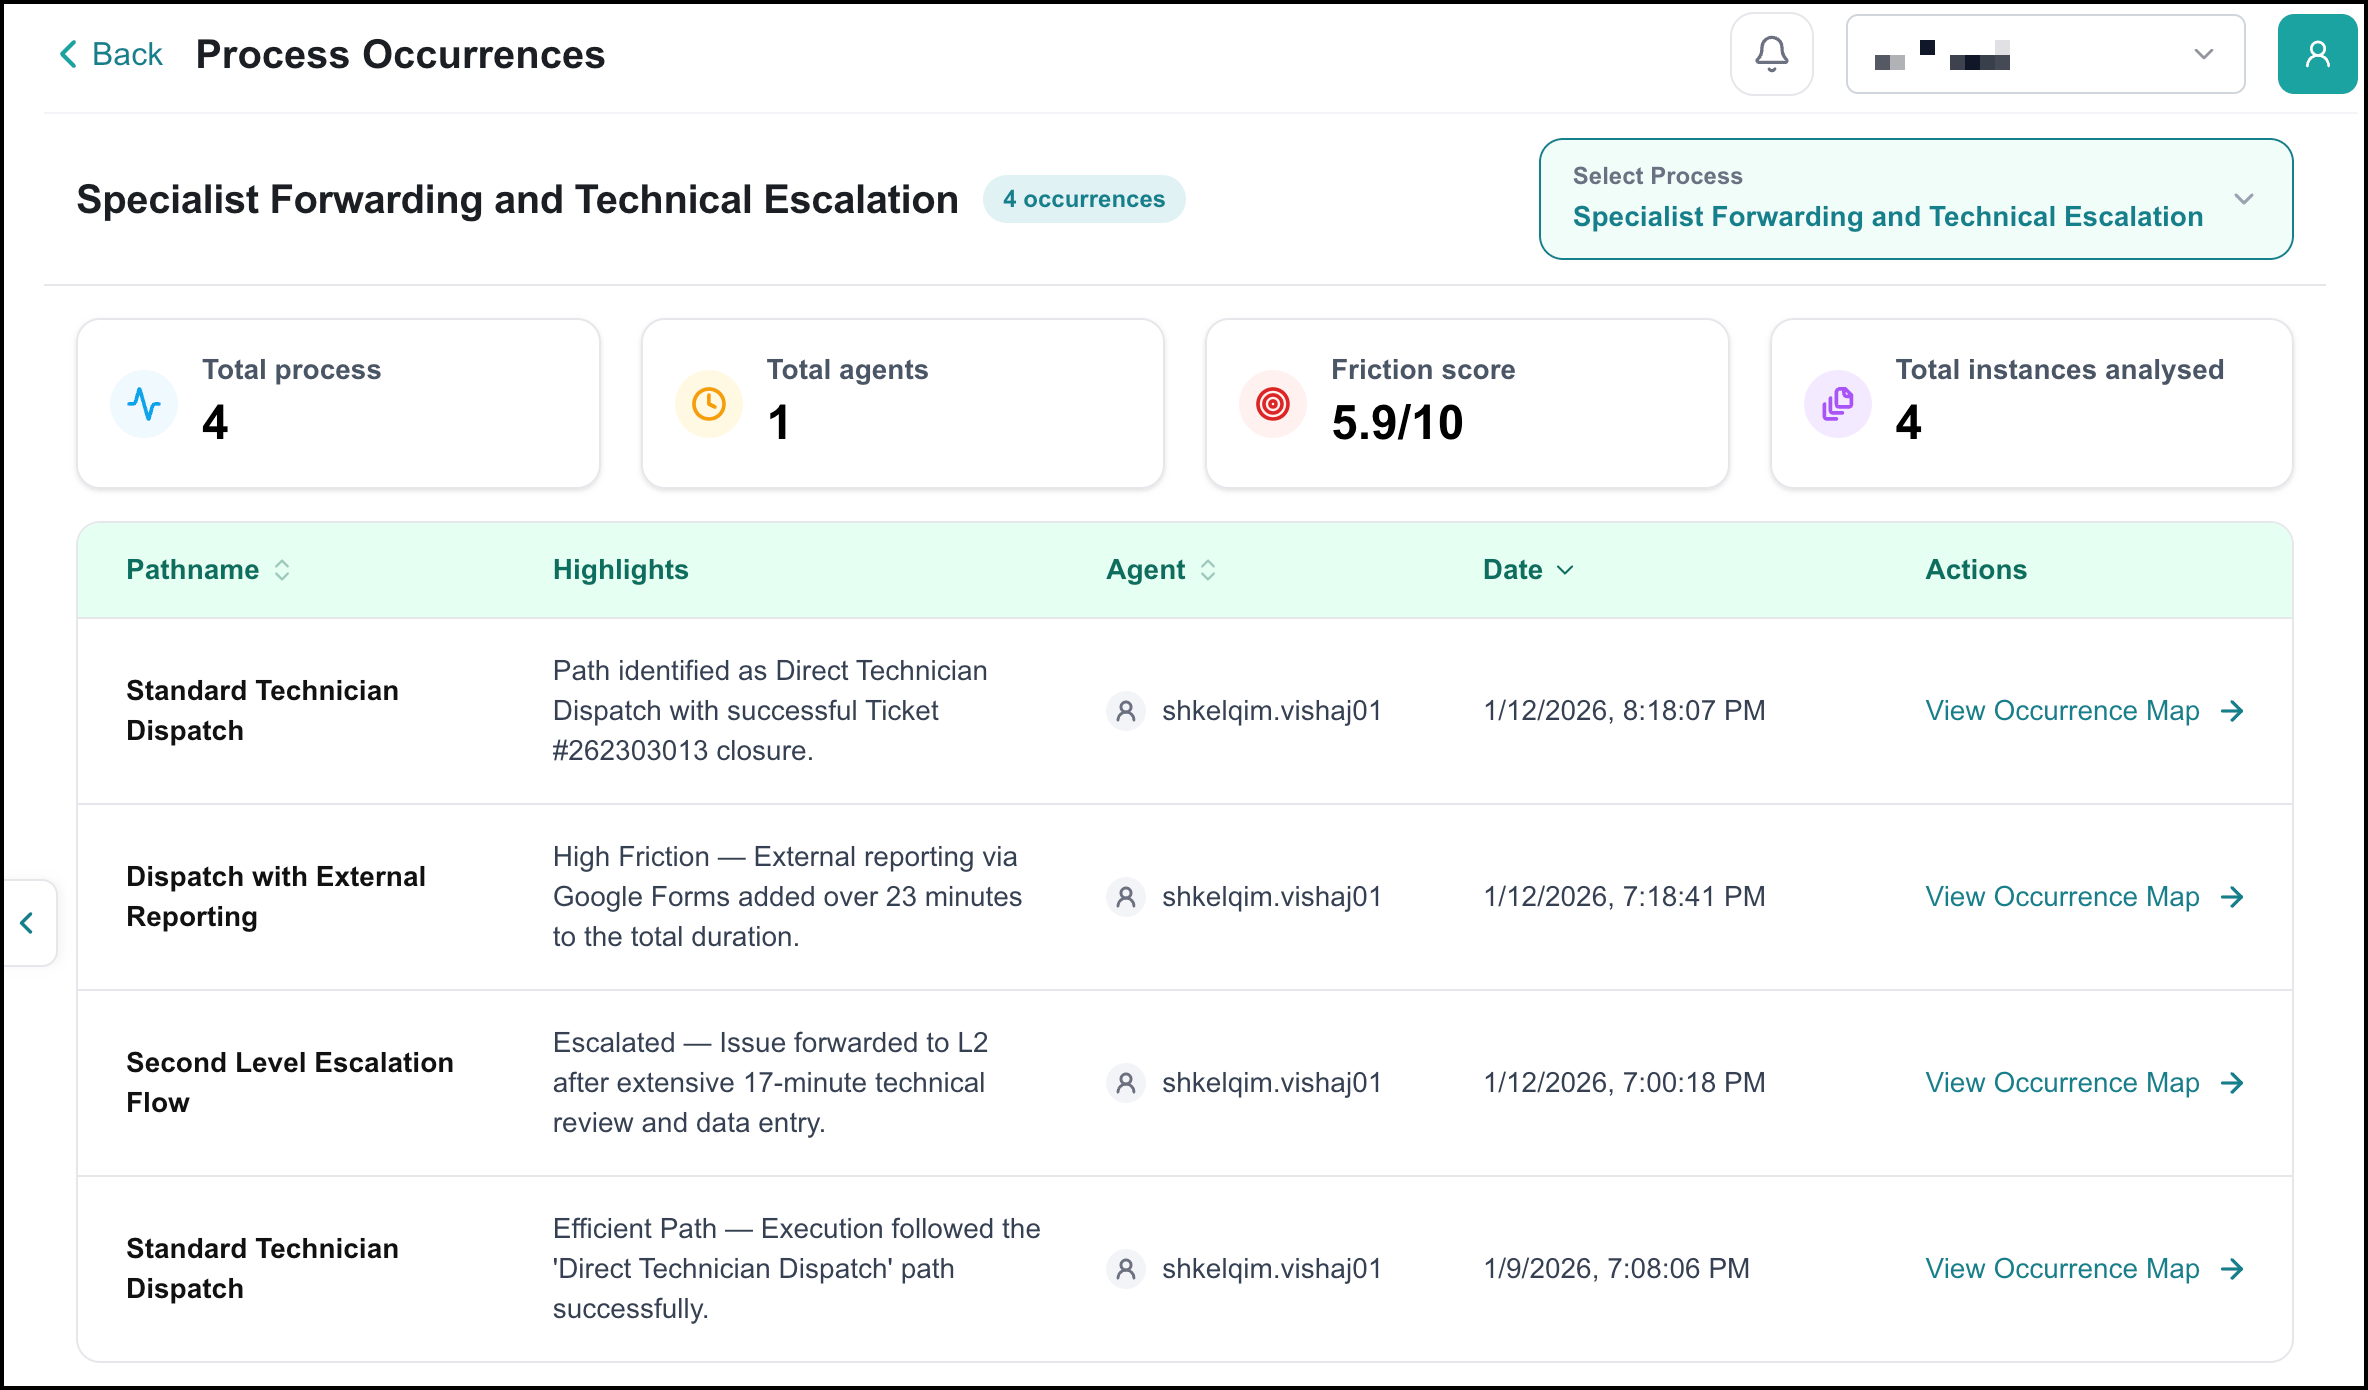
At the top of the Process Occurrences page is information similar to the following, though the categories displayed may differ for your environment: Total processes, Total agents, Friction score, and Total instances analyzed.
The list of occurrences shows:
Highlights identified for the occurrence
The agent involved in the occurrence
The date of the occurrence
Viewing an Individual Occurrence
To learn more about a specific occurrence, click View Occurrence Map.
The Occurrence Map for the specified occurrence opens.
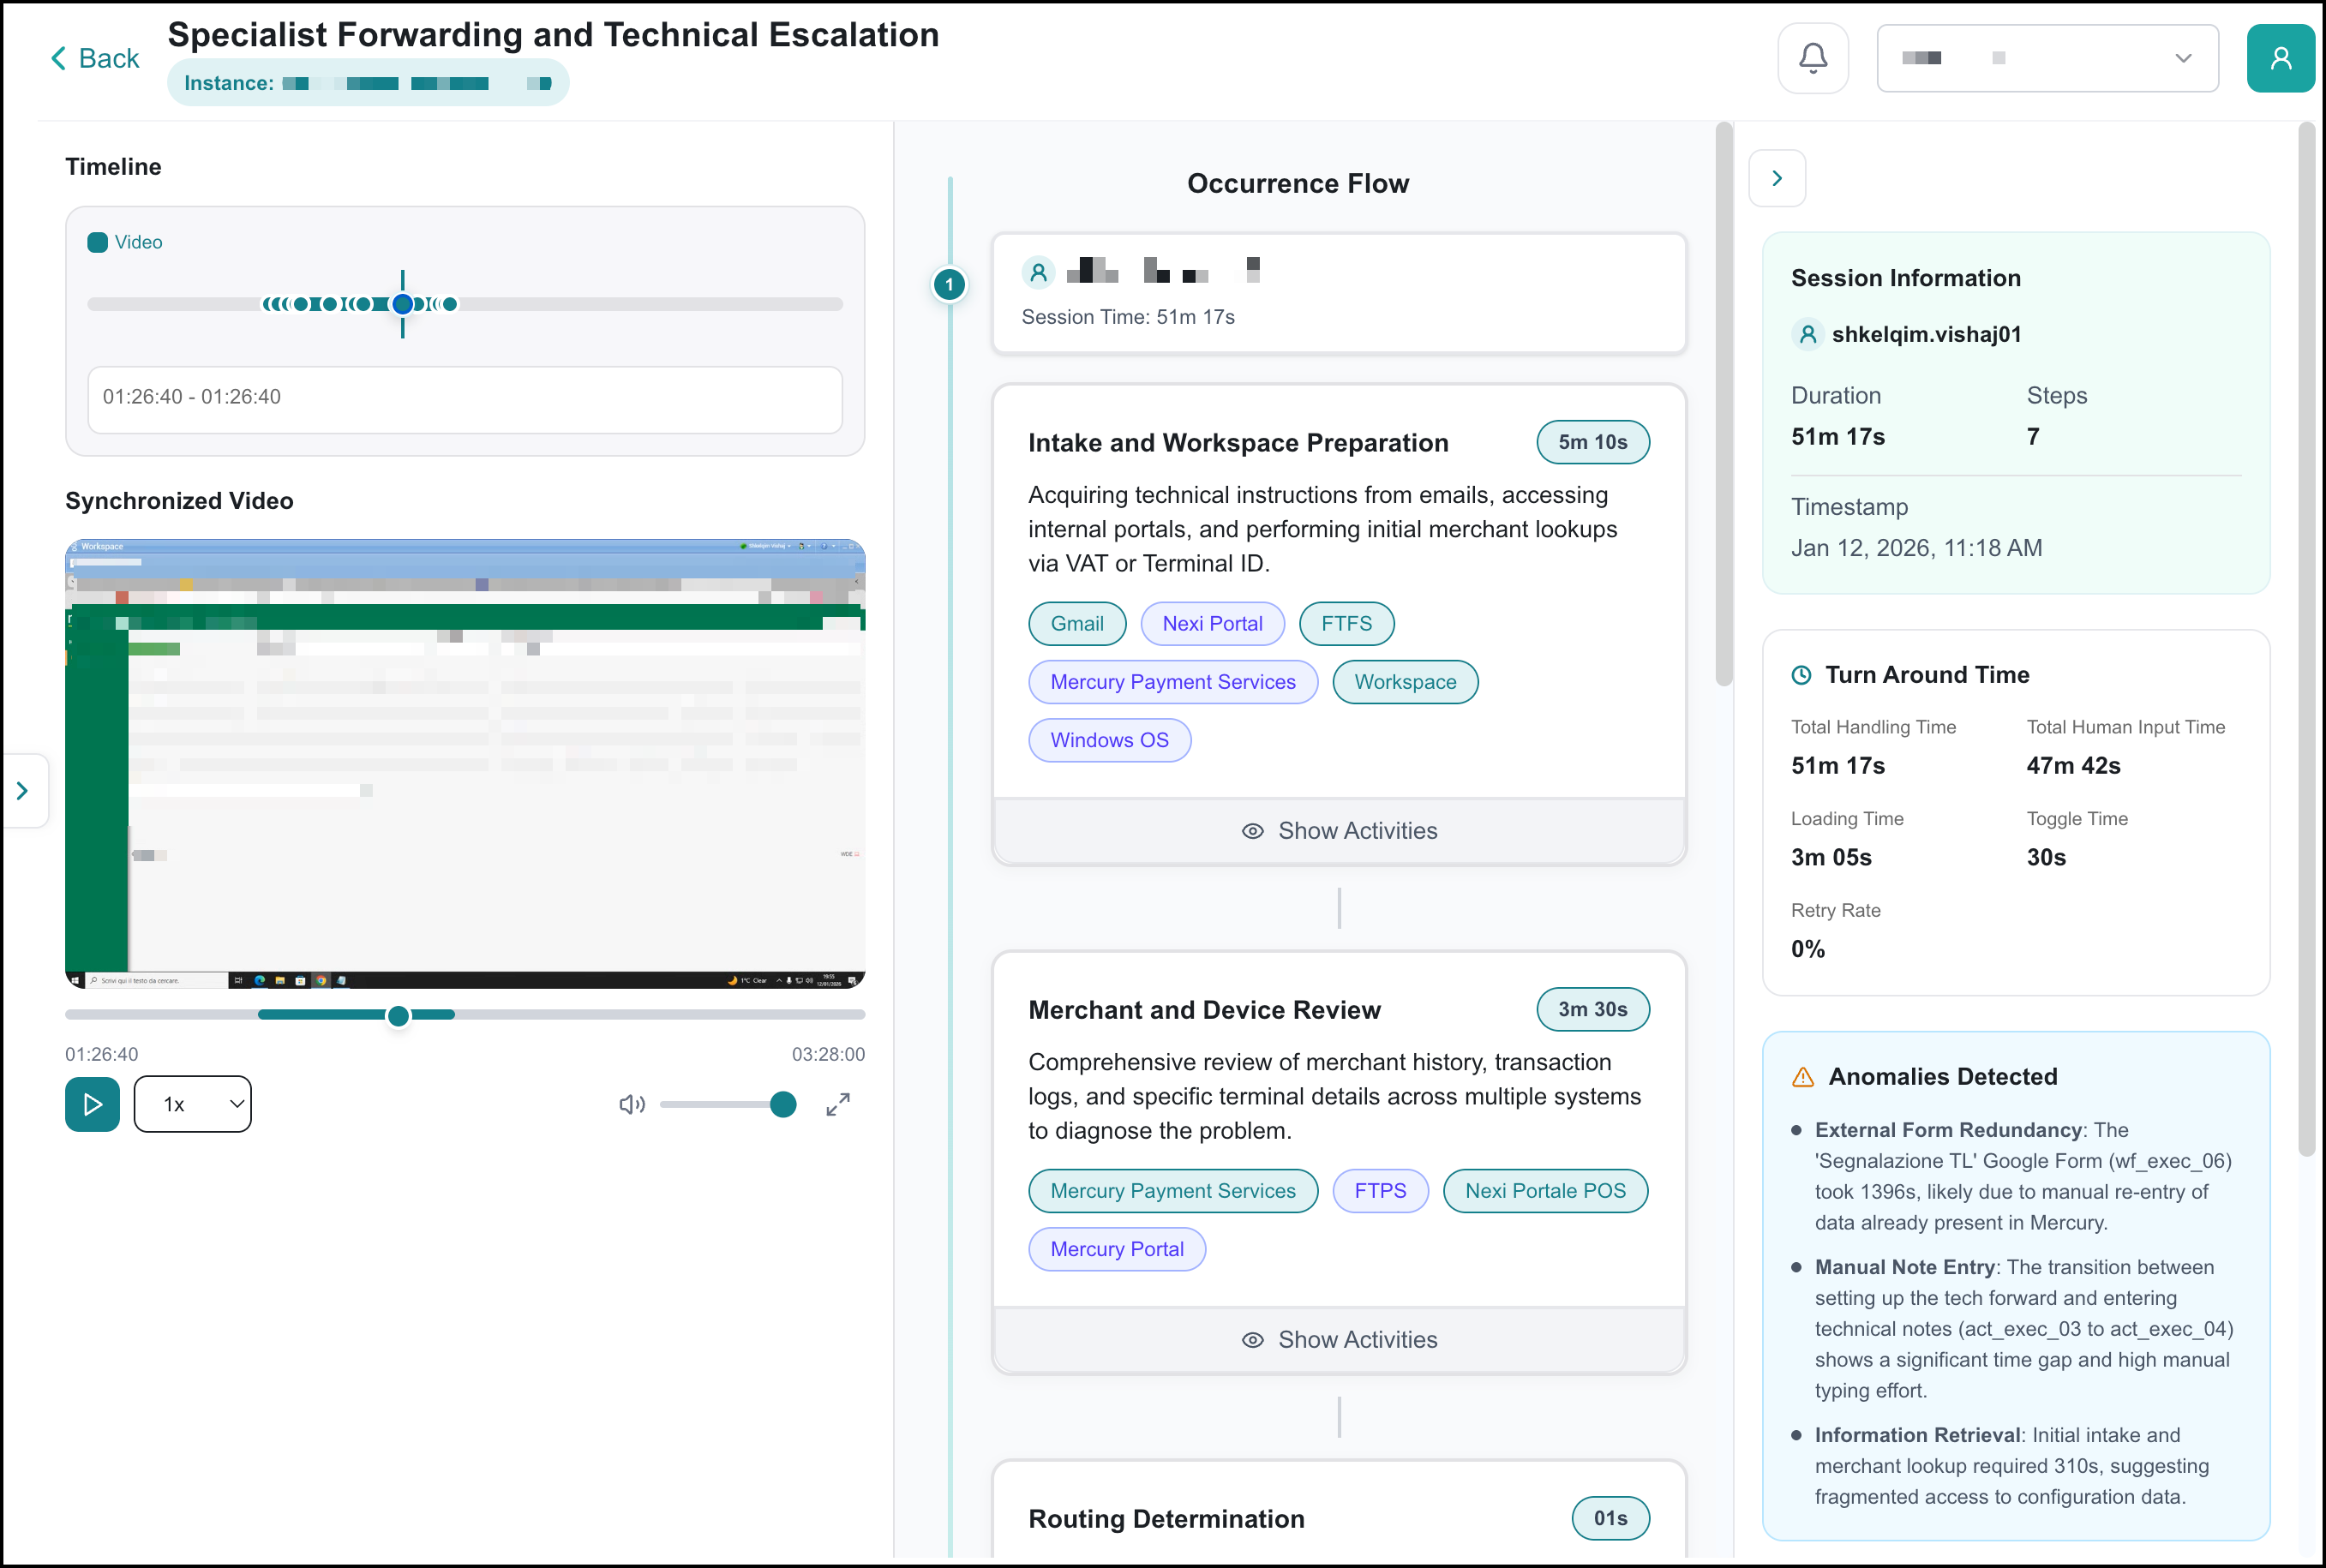
The Occurrence Map shows all data associated with that interaction: the metadata Process Intelligence extracts for the occurrence, transcripts, videos, and system event logs.
This view shows the system's interpretation of a single run alongside its raw evidence. It is the screen for validation, debugging, and root cause investigation of a specific occurrence.
The Occurrence Map has three main sections: Evidence, Occurrence Flow, and a side panel with AI Analysis. All three are time-synchronized. Selecting a step on the map jumps the video to the right moment, scrolls the transcript to the right turn, and highlights the matching log event.
The Evidence section shows key points in the interaction, along with any related videos and transcripts. You can watch the video recording if one is associated with the interaction.
The Occurrence Flow is tied to the Timeline, so the two remain synchronized. If you click a point in either the Timeline or the Occurrence Flow, the other is advanced to the same point. The Timeline, video, transcript, and Occurrence Flow sections are all connected. Click a point in any of them, and the corresponding point is highlighted in the others.
The AI Analysis displays information about the occurrence, including session details, turnaround time, anomalies detected, and AI-generated insights (observations about the interaction).
Viewing Occurrences with BAIC Copilot
The BAIC Copilot in Process Occurrences lets you ask questions about a specific interaction in plain language and get an immediate answer, without manually reviewing the Timeline, video, or transcript. This helps you find details about a single occurrence, such as anomalies or turnaround time, faster than reviewing the Occurrence Map yourself.
To access a BAIC Copilot:
Go to the Home page > Data > Process Intelligence.
Select Process Occurrence in the navigation panel under Discovery.
The Process Occurrence page opens and displays the list of recorded occurrences.
Select an occurrence to open its Occurrence Map.
Select the Process Agent icon at the bottom left.
The BAIC Copilot panel opens.
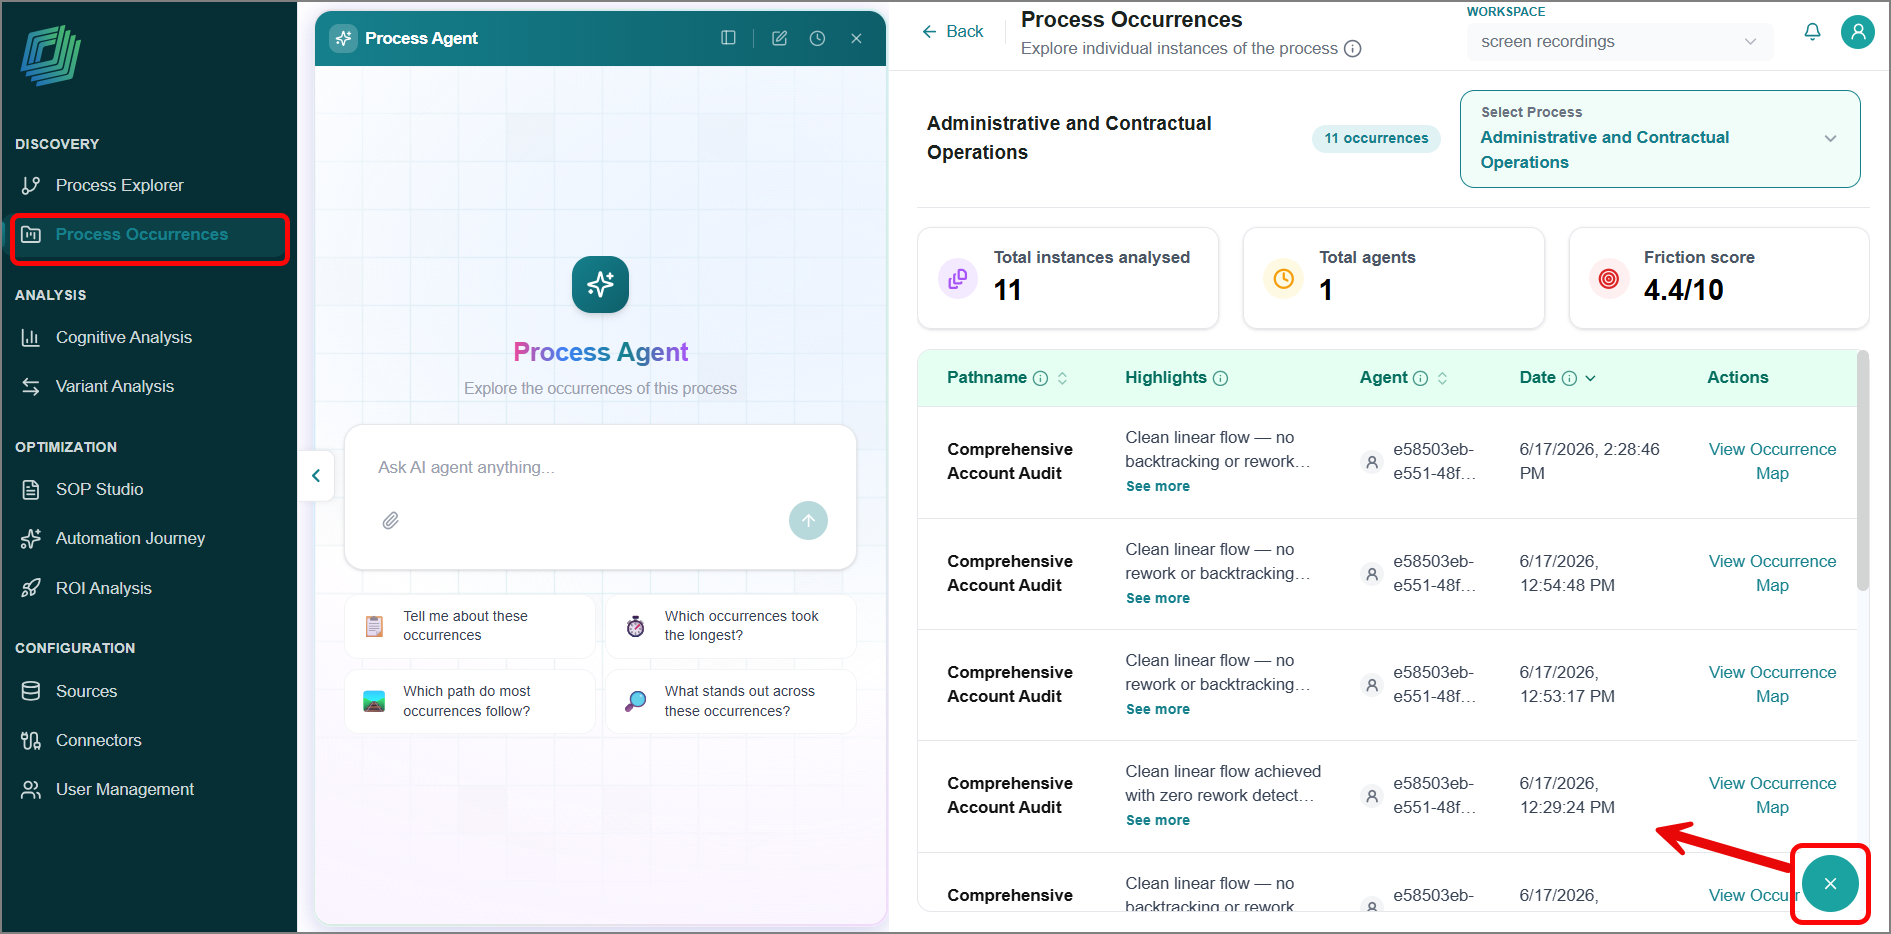
Type your question in plain language and press Enter.
The BAIC Copilot returns a direct answer based on the data from this occurrence.
The panel has other capabilities:
View session history
Switch panel view
Create a new session
Variant Analysis
A variant is a unique sequence of steps taken by a group of occurrences to complete an intent.
Variant Analysis is the workbench you use to learn from your data: to place what worked next to what didn't, and extract the difference. For example, compare different agents' behavior or investigate why AHT is lower for some groups than others.
Every process has efficient runs and inefficient ones. However, the reasons for the gap rarely show up in averages or roll-ups. Variant Analysis exposes them by letting you place two to four cohorts of the same process side by side (for example, different variants, different agents, different time windows, different outcome categories) and ask the underlying question: What is the efficient cohort doing that the inefficient one isn't?
The output is a structured comparison that converts tacit operational knowledge ("Our best agents just know how to handle these") into something you can document in an SOP, train on, or hand to an automation team.
To access this page, click Variant Analysis in the navigation panel or click Compare Paths from the Process Explorer page.
The Variant Analysis page opens, and shows the "All Paths" process flow for the selected process and path.
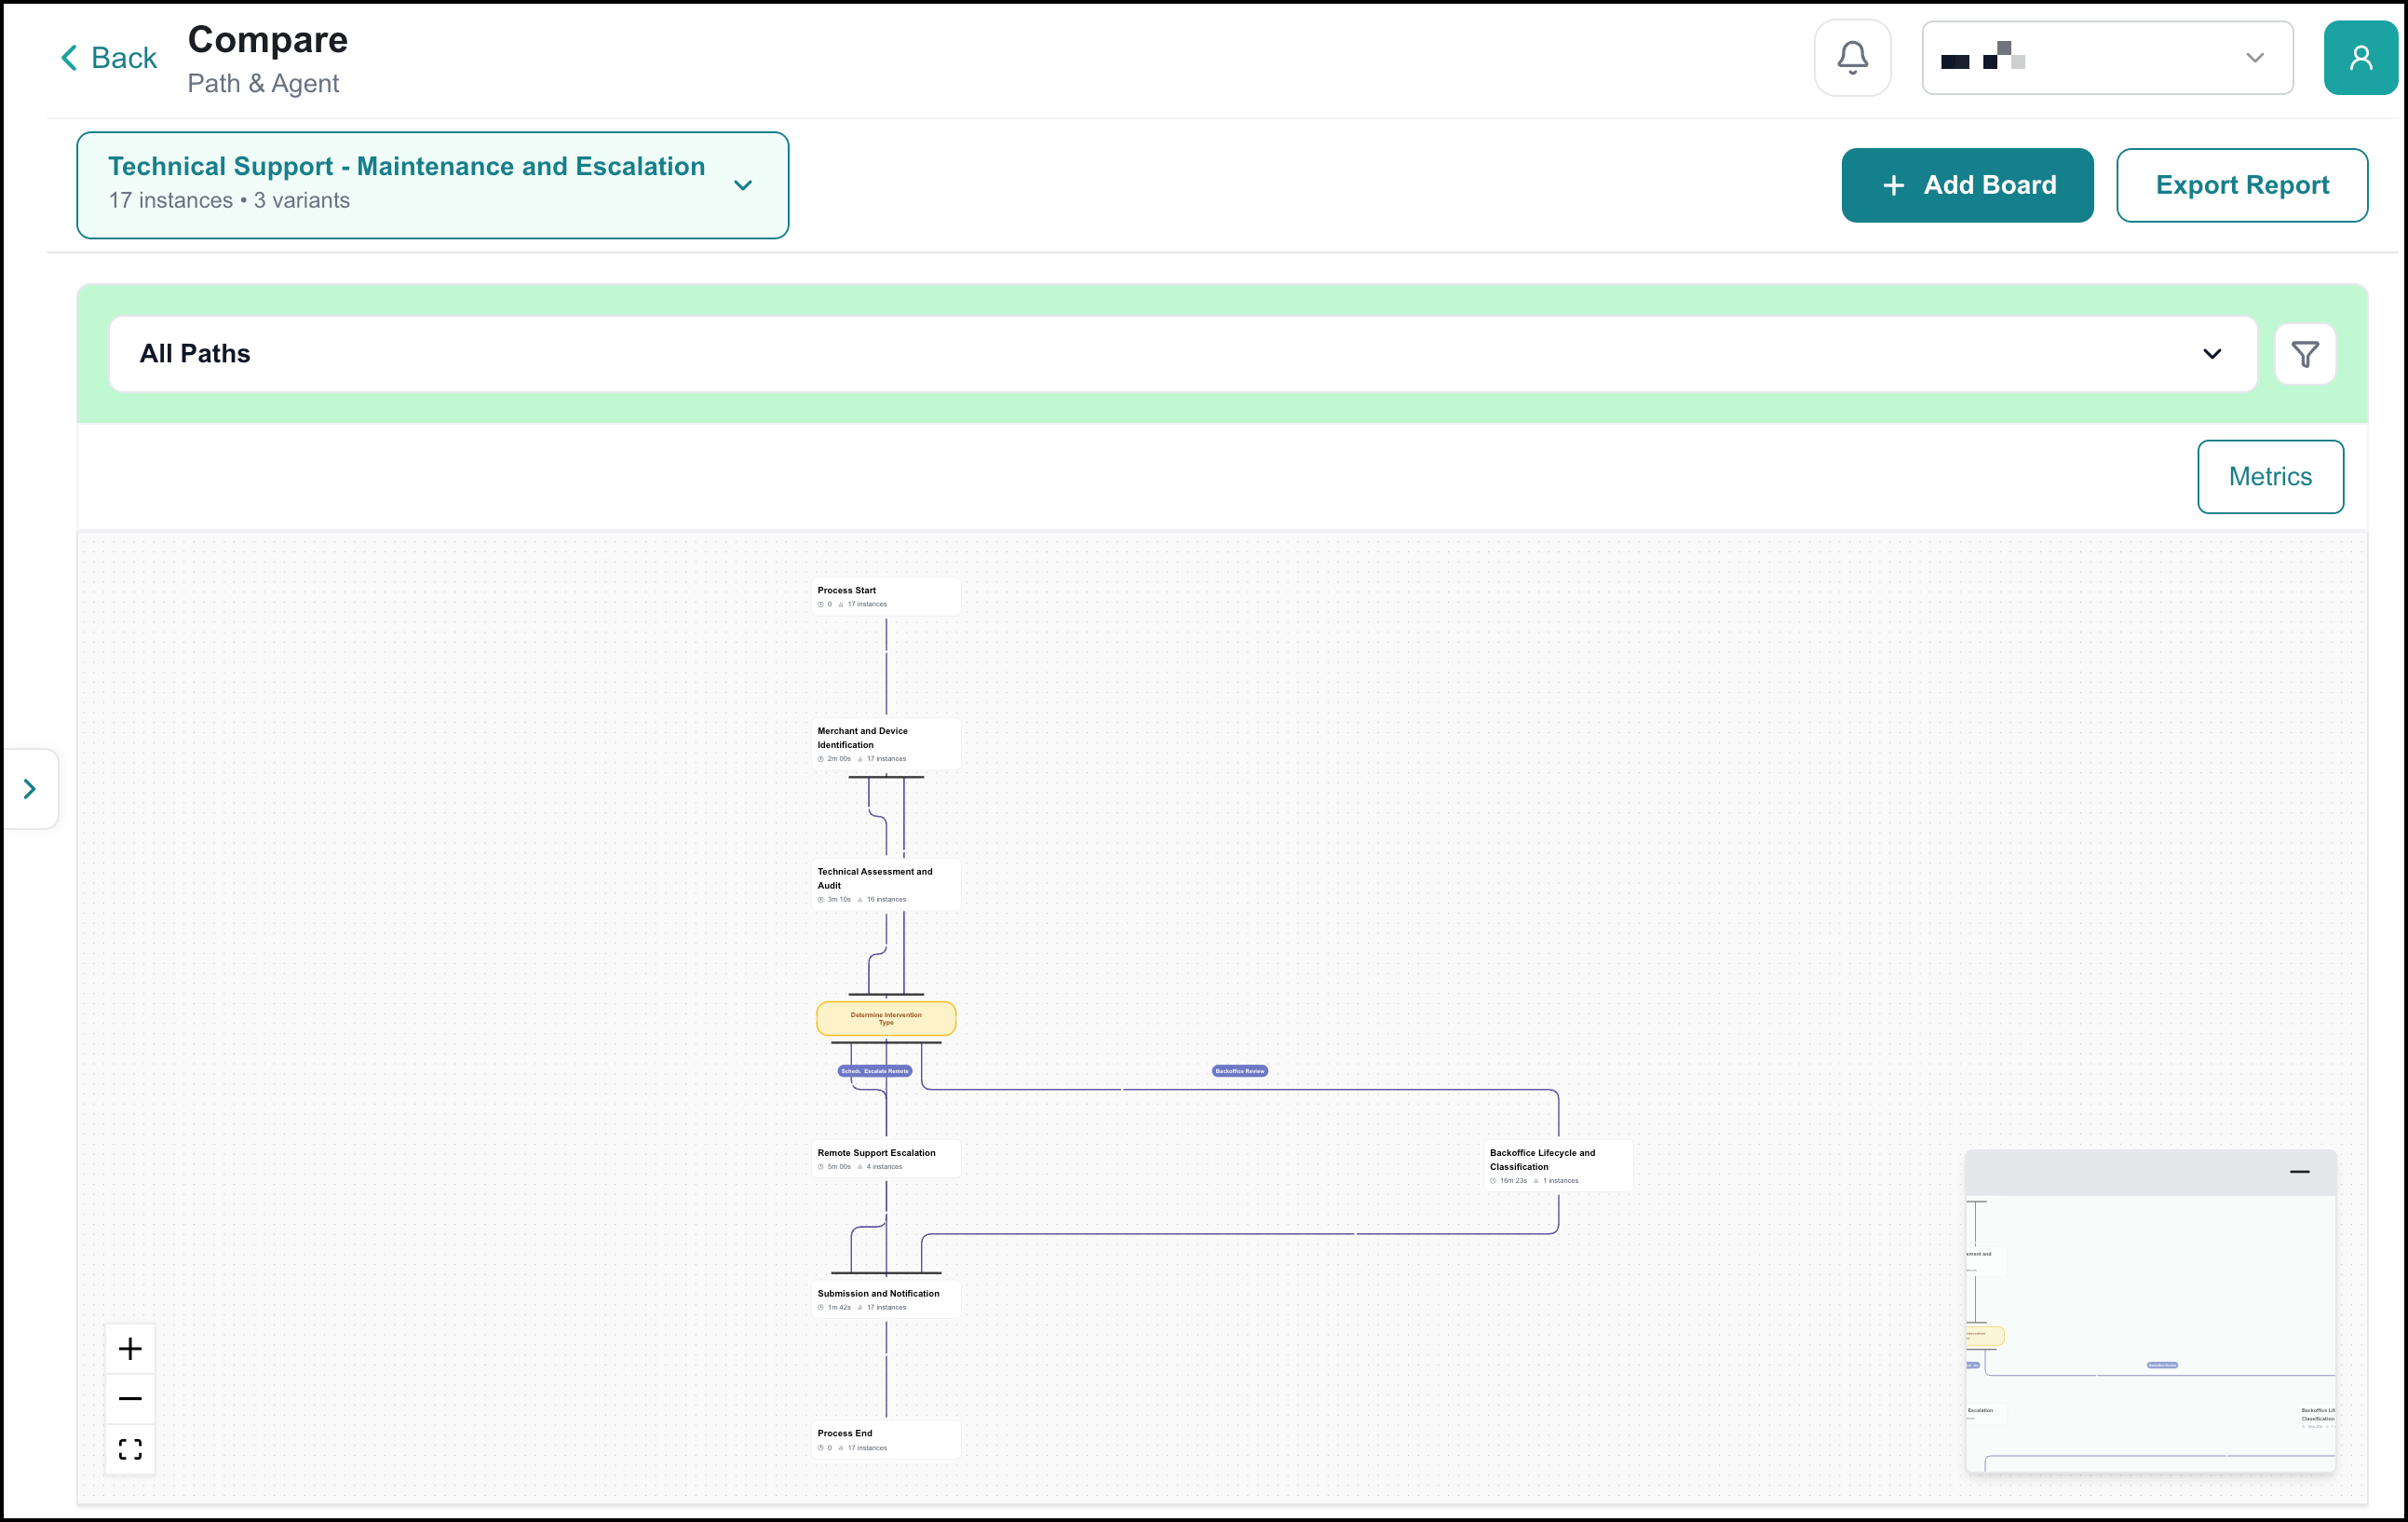
You can select which paths to compare, add additional paths (Add Board) to compare, view metrics for paths, and export a report.
Common Comparisons
Variant Analysis answers the same underlying *efficient vs. inefficient* question through different filter combinations. Common patterns:
Comparison | How to Set It Up | What It Typically Surfaces |
|---|---|---|
Resolved vs. escalated | Two boards on the same variant, scoped to occurrences with successful outcomes vs. escalations. | Where escalated runs diverge from runs that resolved on first contact. |
Veteran agents vs. new hires | Two boards on the same variant, each filtered to a different agent cohort by Agent. | Tacit knowledge from senior agents that should be captured as SOP, training, or automation logic. |
Path A vs. path B | Two boards on different variants of the same process. | Whether a structural difference (different decision branches, optional steps) drives the outcome gap. |
Tool-heavy vs. tool-light runs | Combine variant + handling-time filters to isolate runs that lean on a particular system. | When tool fragmentation is the actual cause of the slowdown. |
Comparing Paths
To get a more detailed comparison between two or more paths, compare multiple paths via the Variant Analysis page or by clicking Compare Paths on the Process Explorer page. Use this to identify or examine the differences between two paths.
To compare paths:
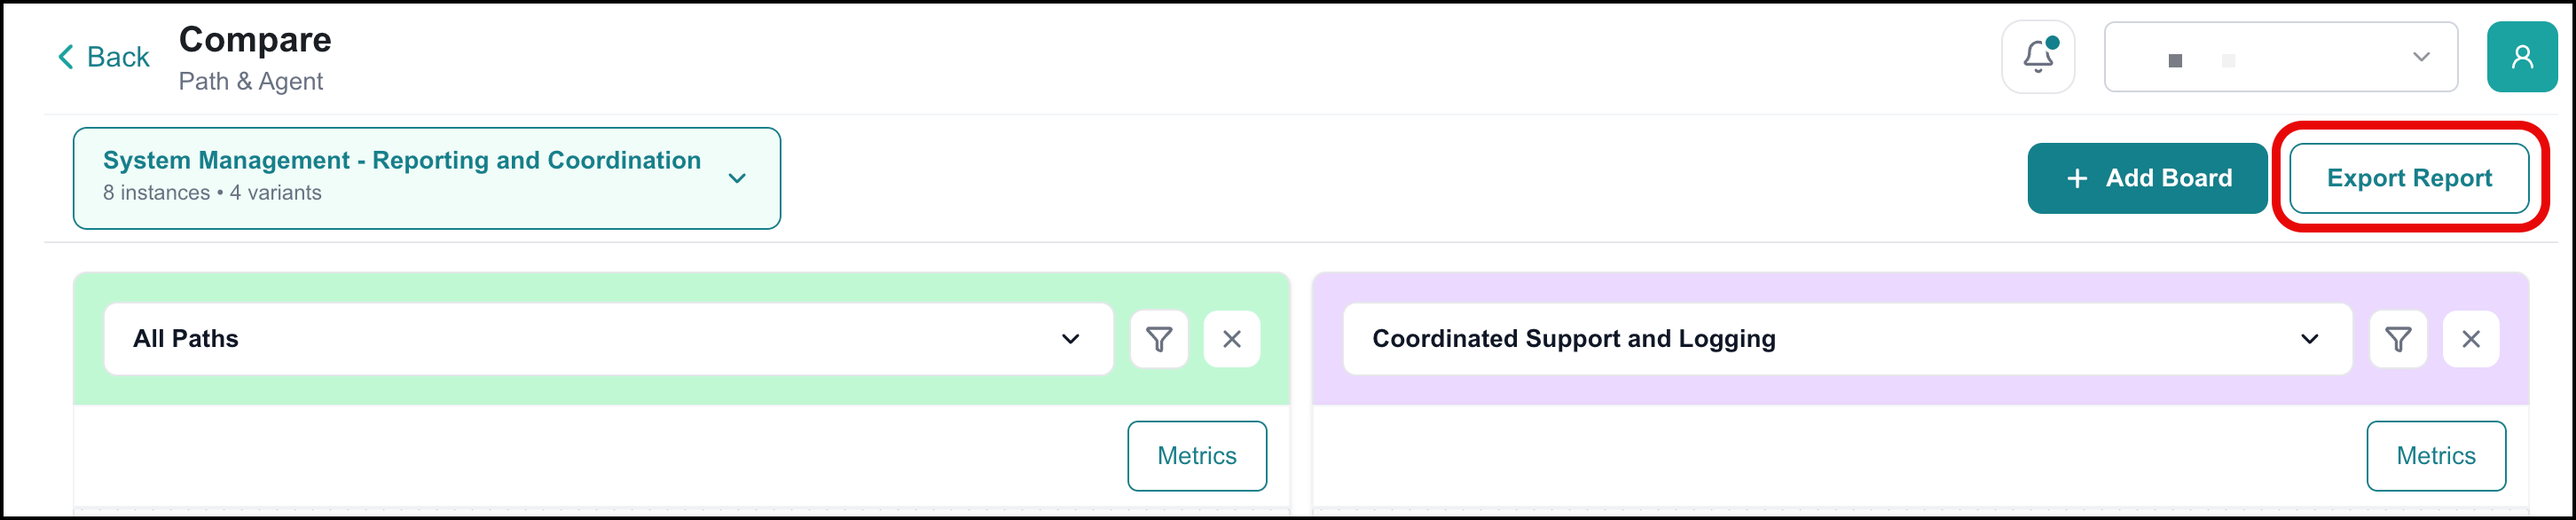
Click Compare Paths on the Process Explorer detail page:

The Compare page opens, and shows the path for which you were viewing details.
Click Add Board, then select a path.
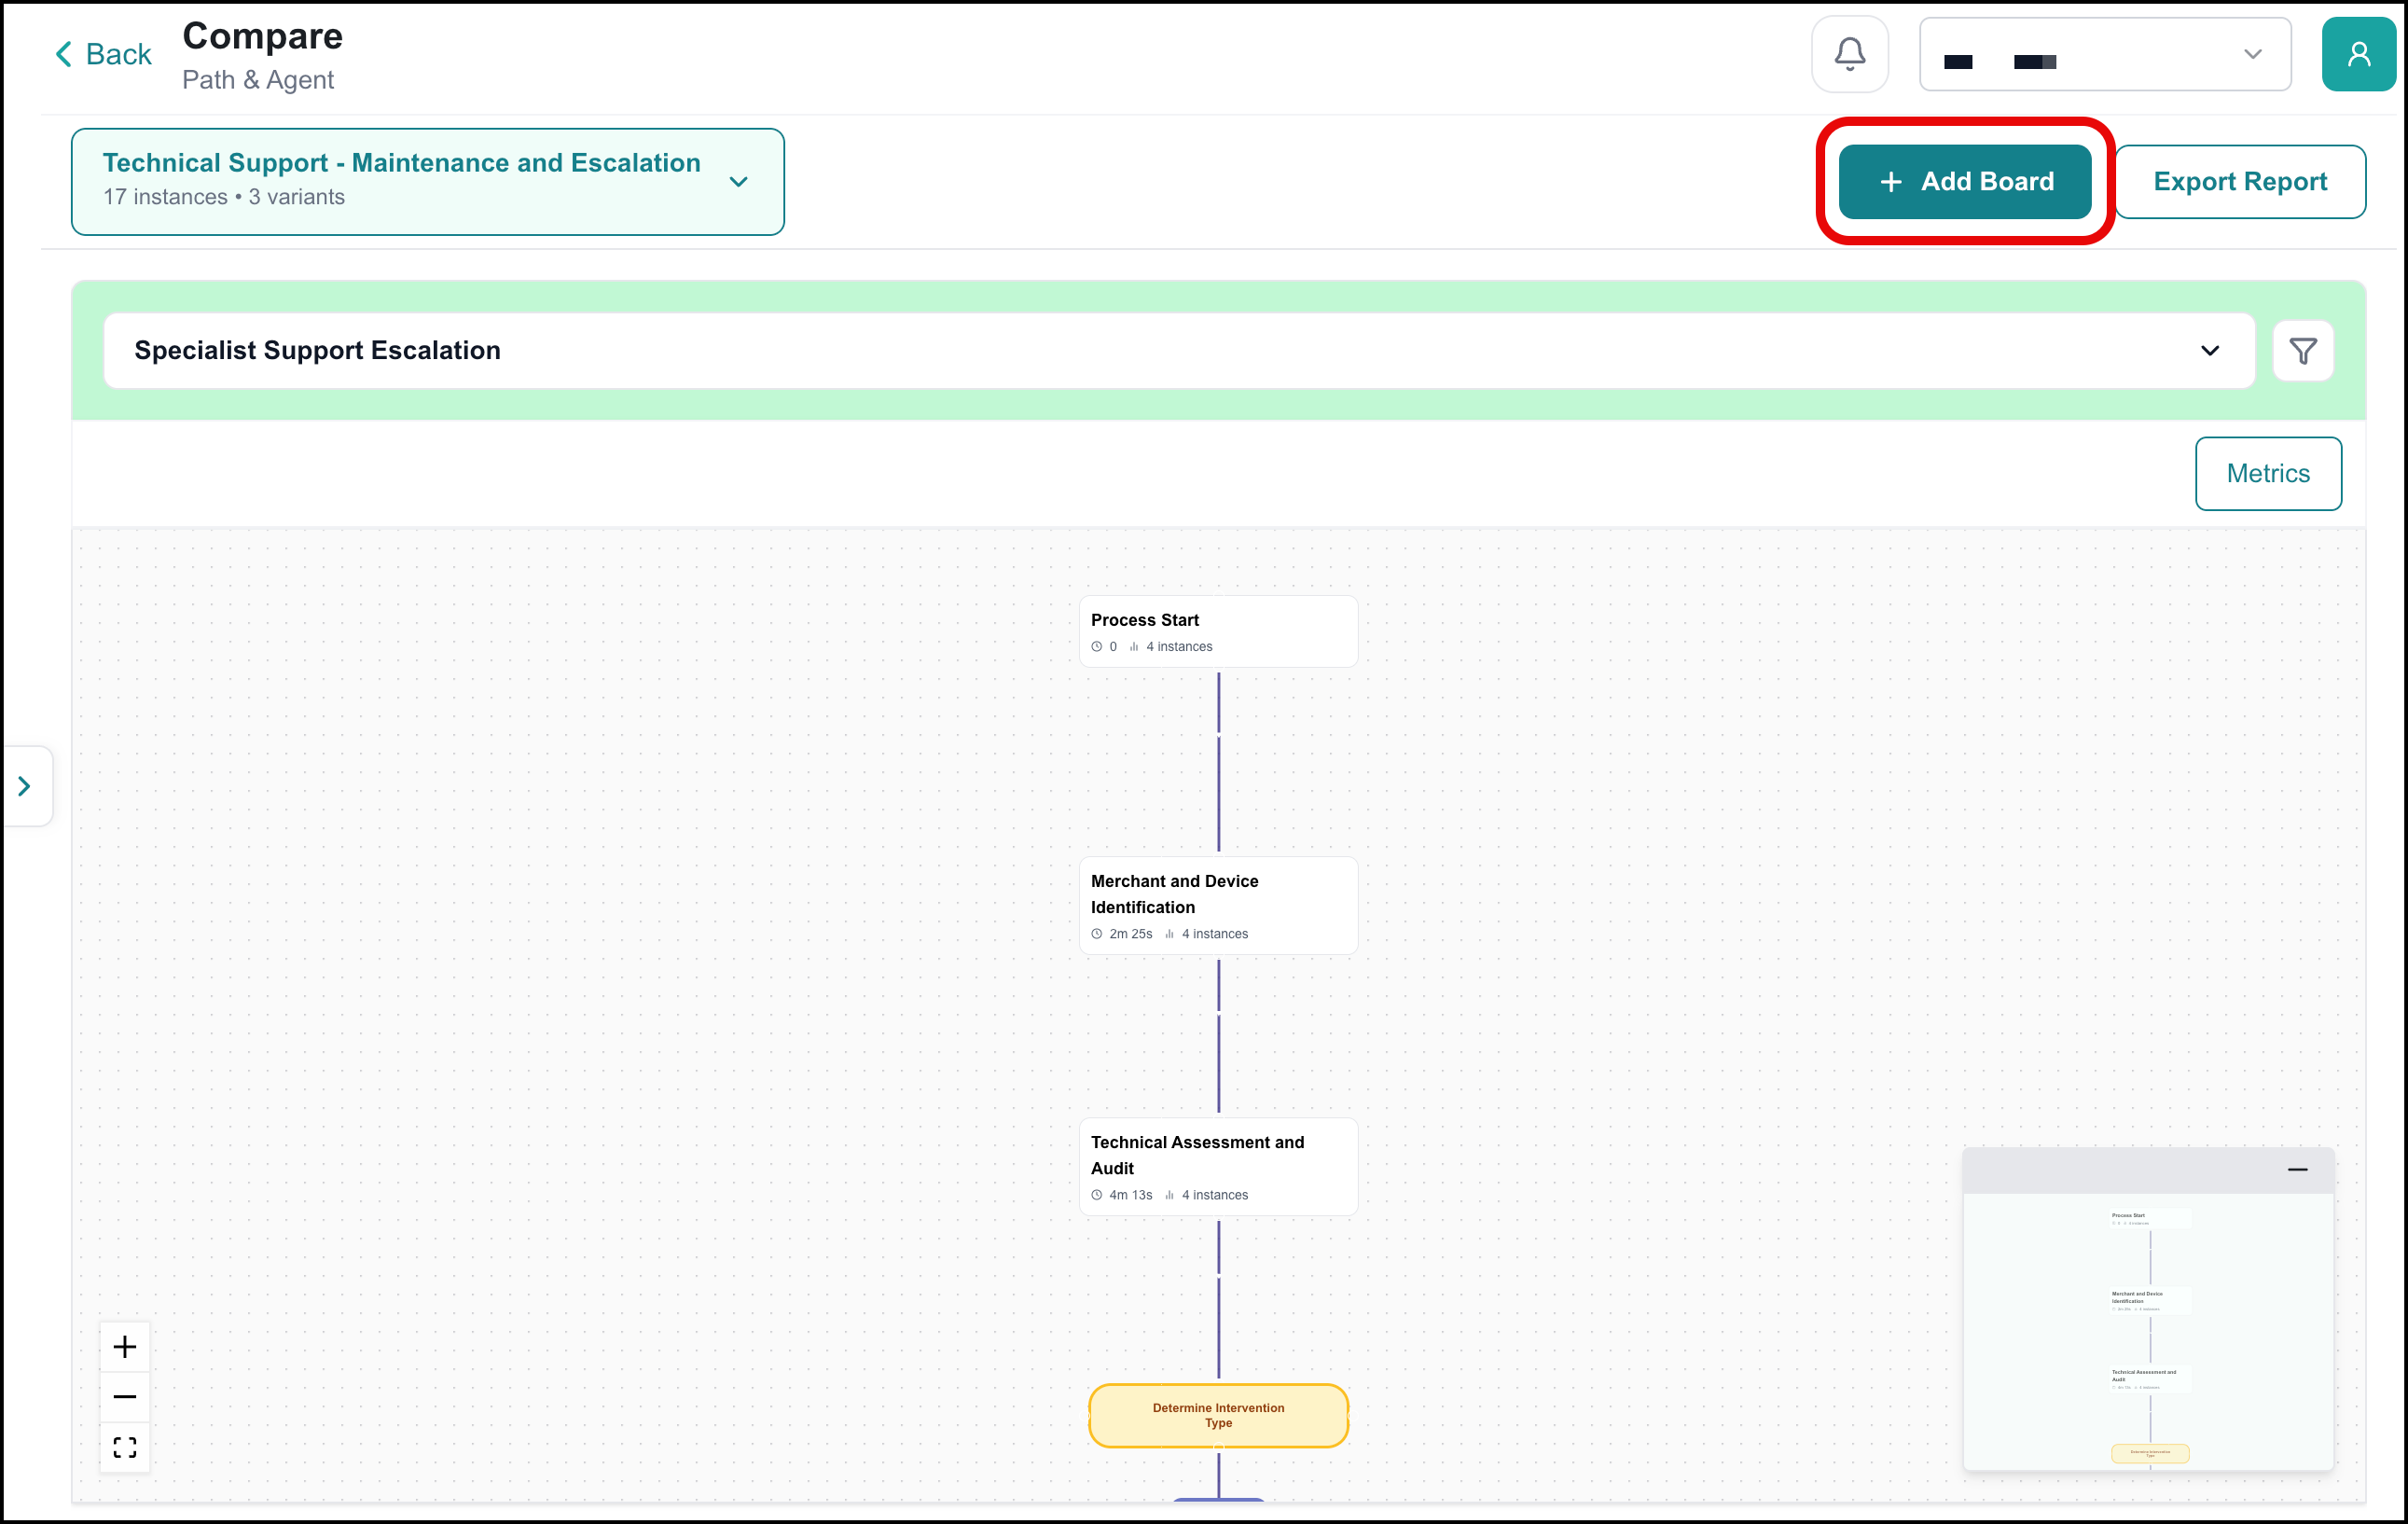
Add one or more paths for comparison.
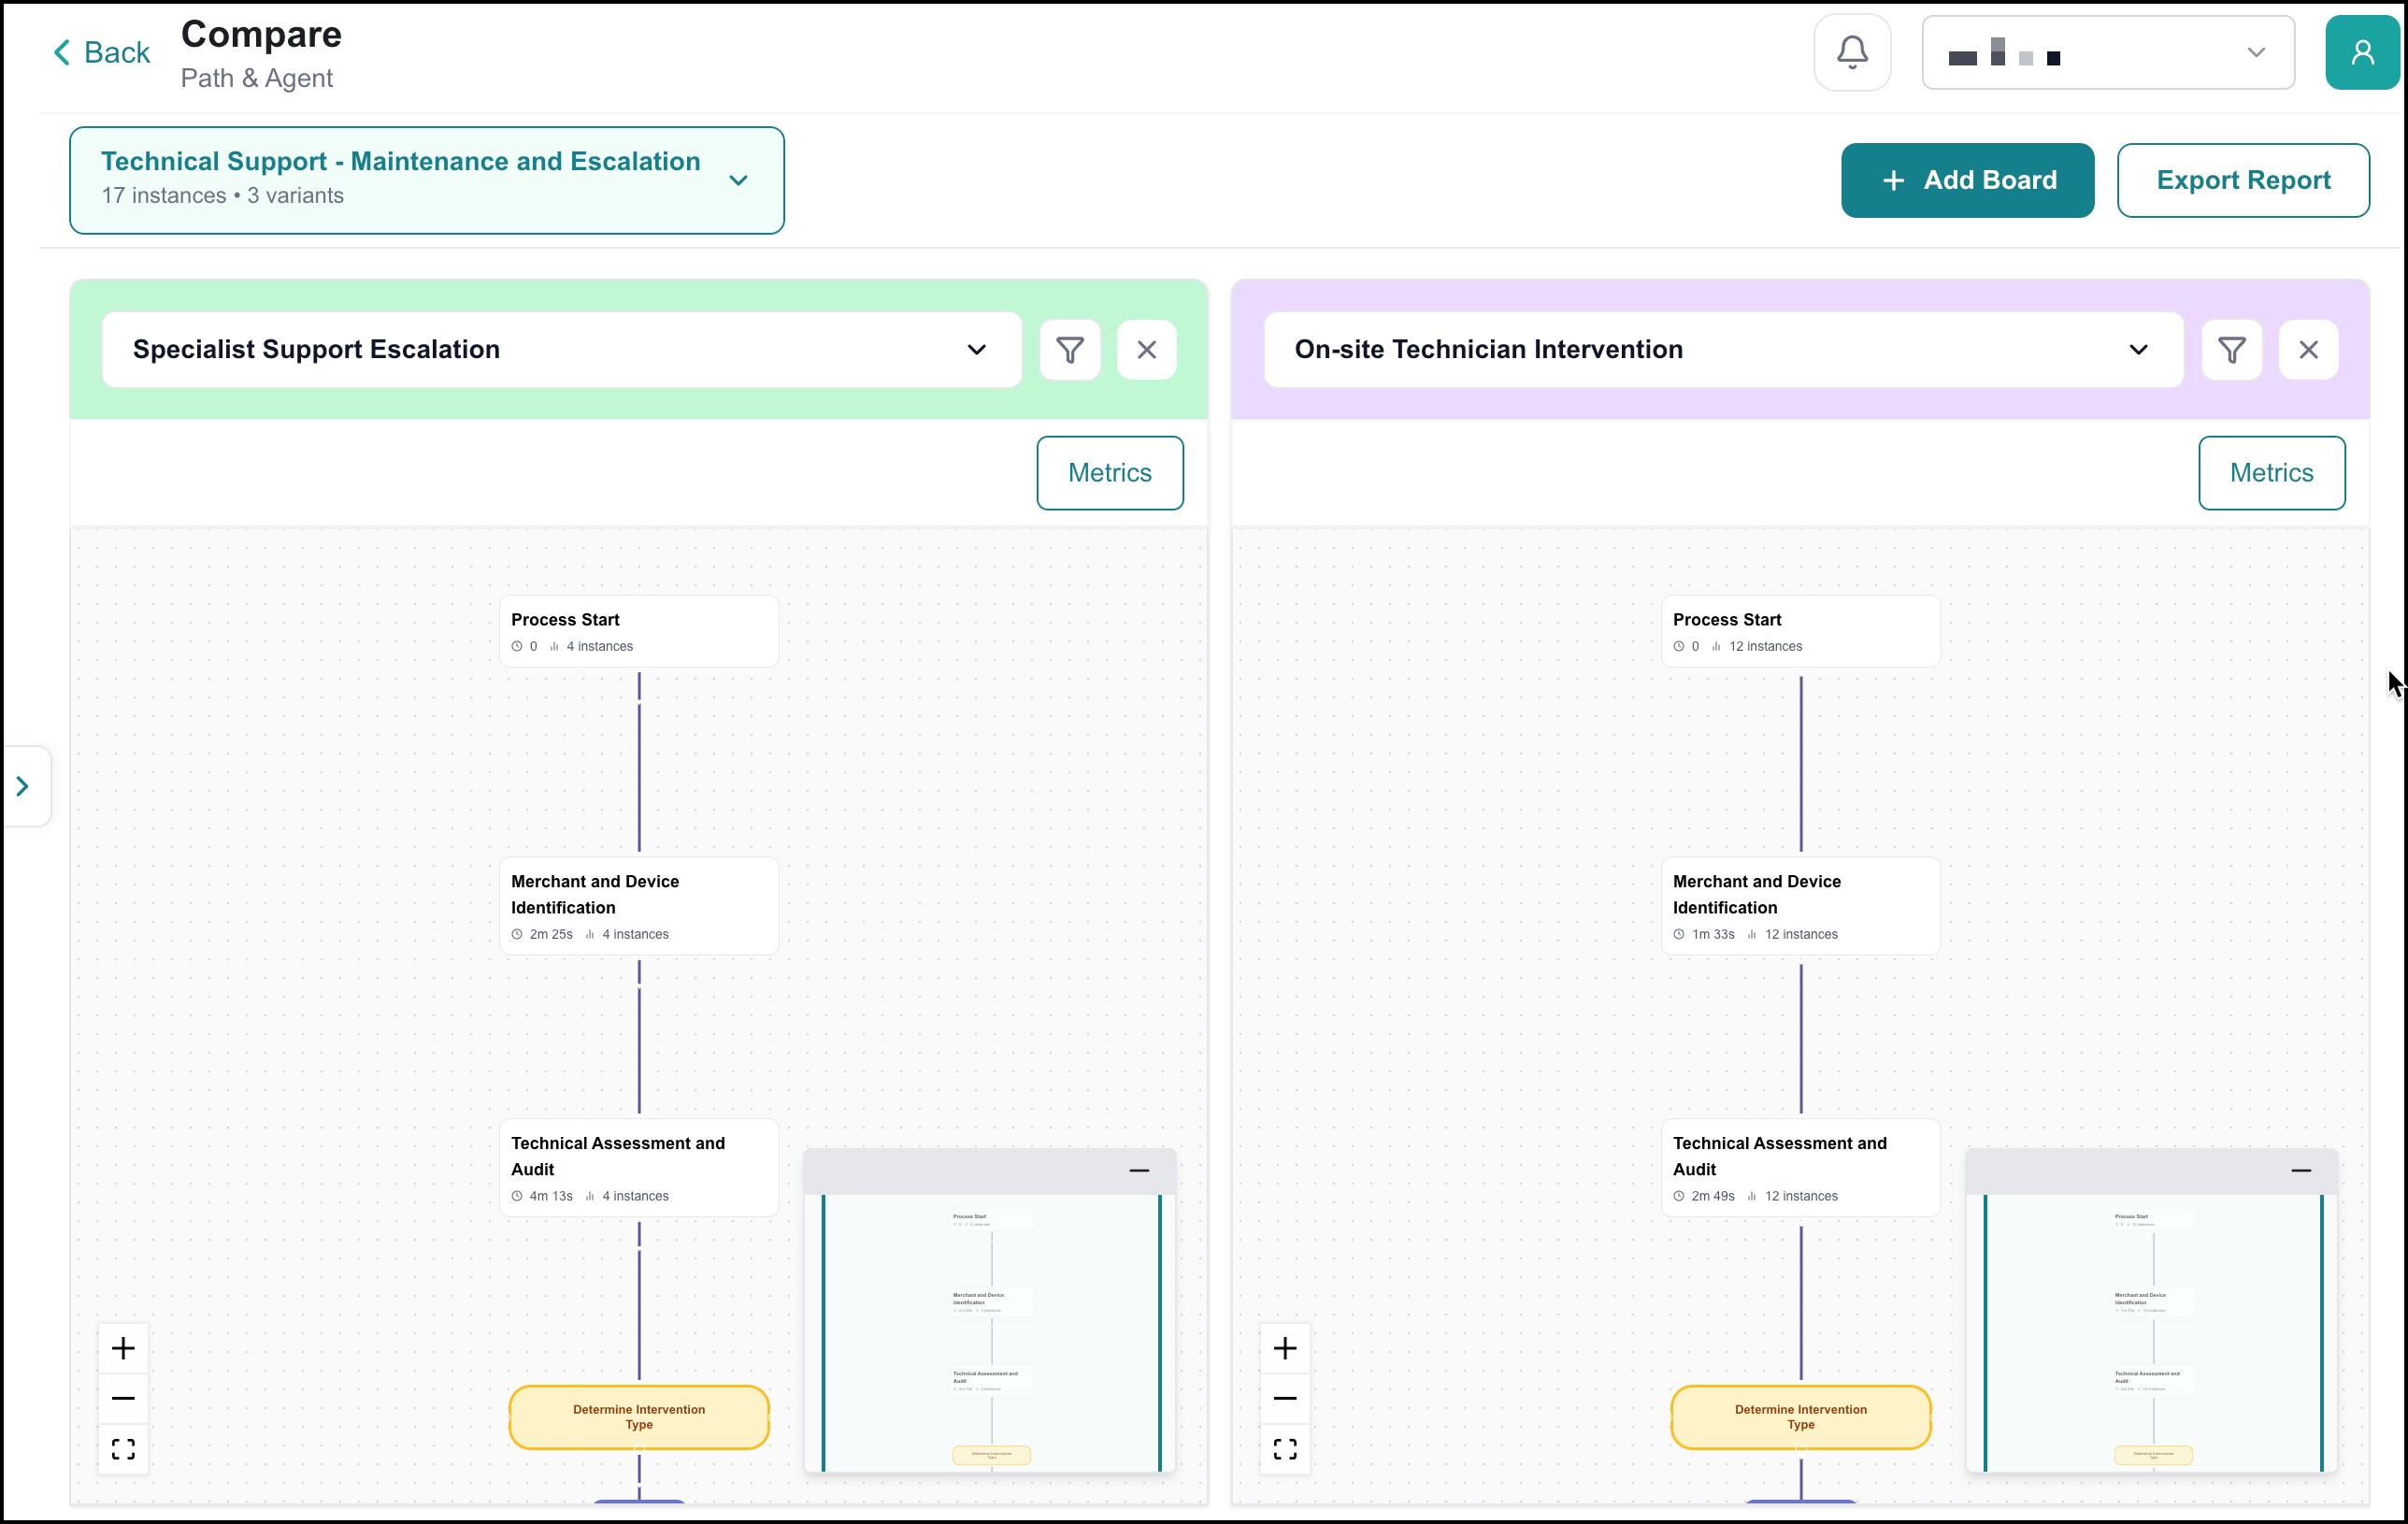
You can drag (move) or resize the paths.
Click + to zoom in.
Click - to zoom out.
Click the Fit
icon to fit the path in the view.
Click the Filter
 icon to filter a path's instances. For example, use the AHT slider to remove outliers.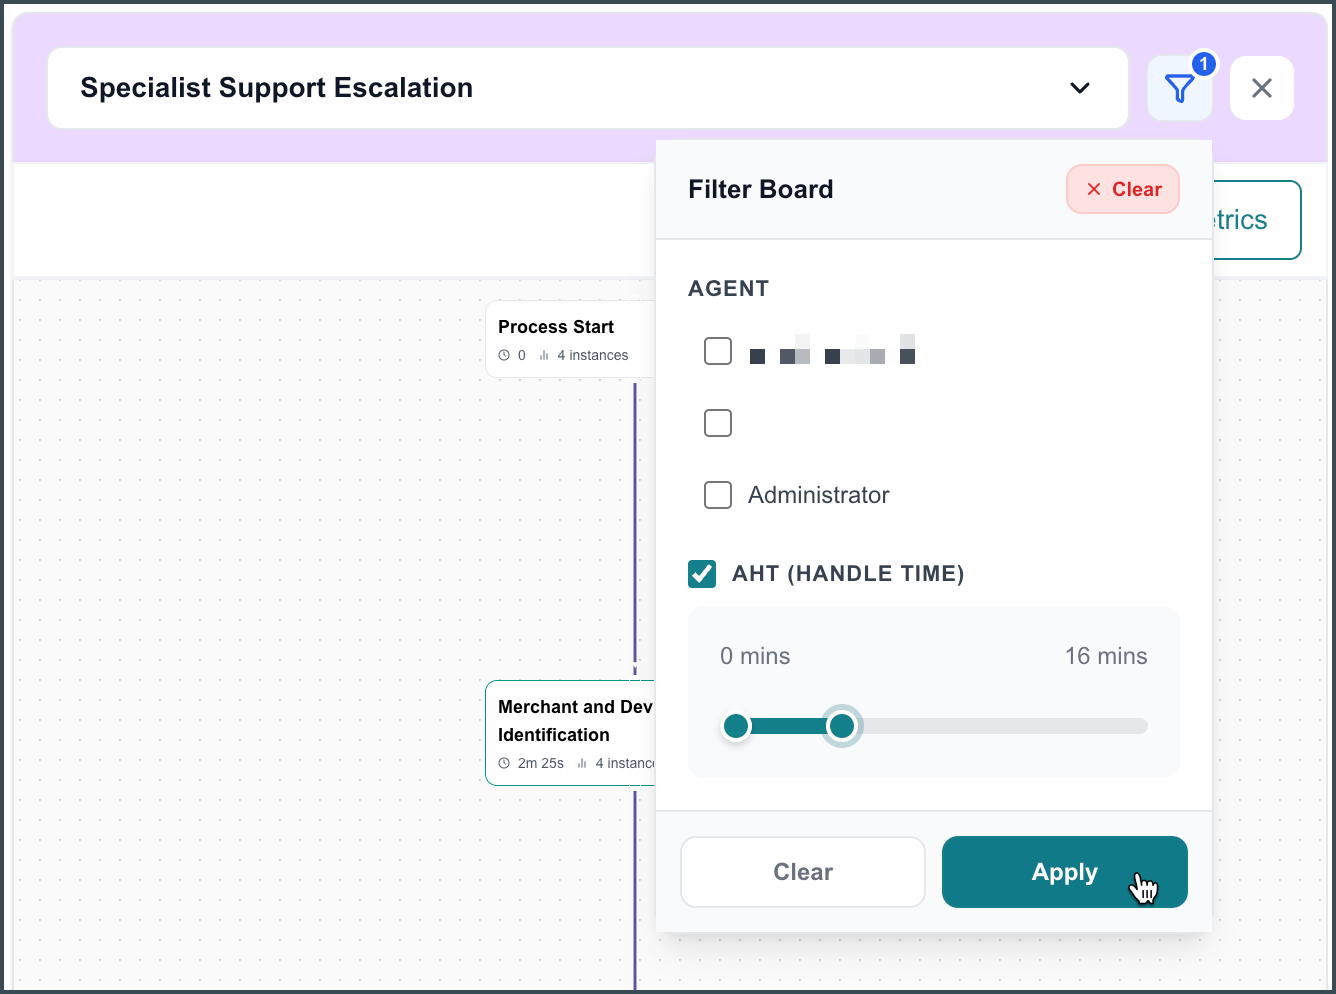
Click Apply to apply the filter.
To view metrics for a path, click Metrics.
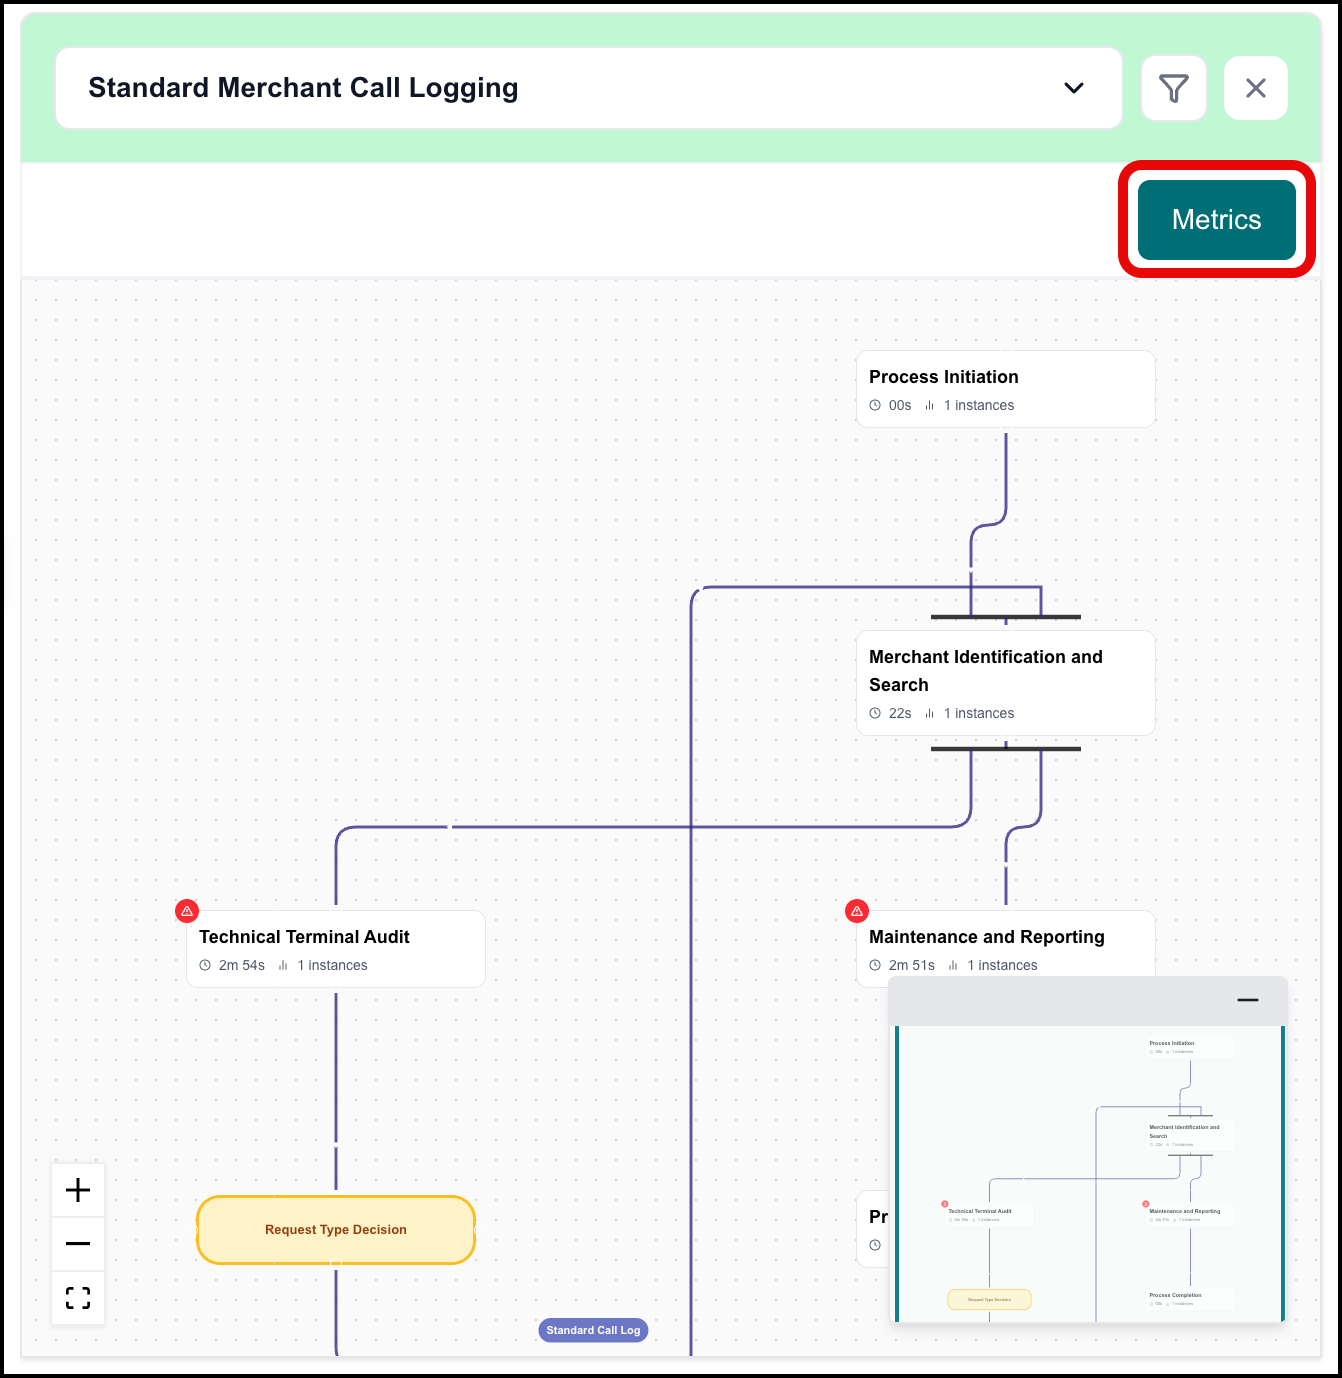
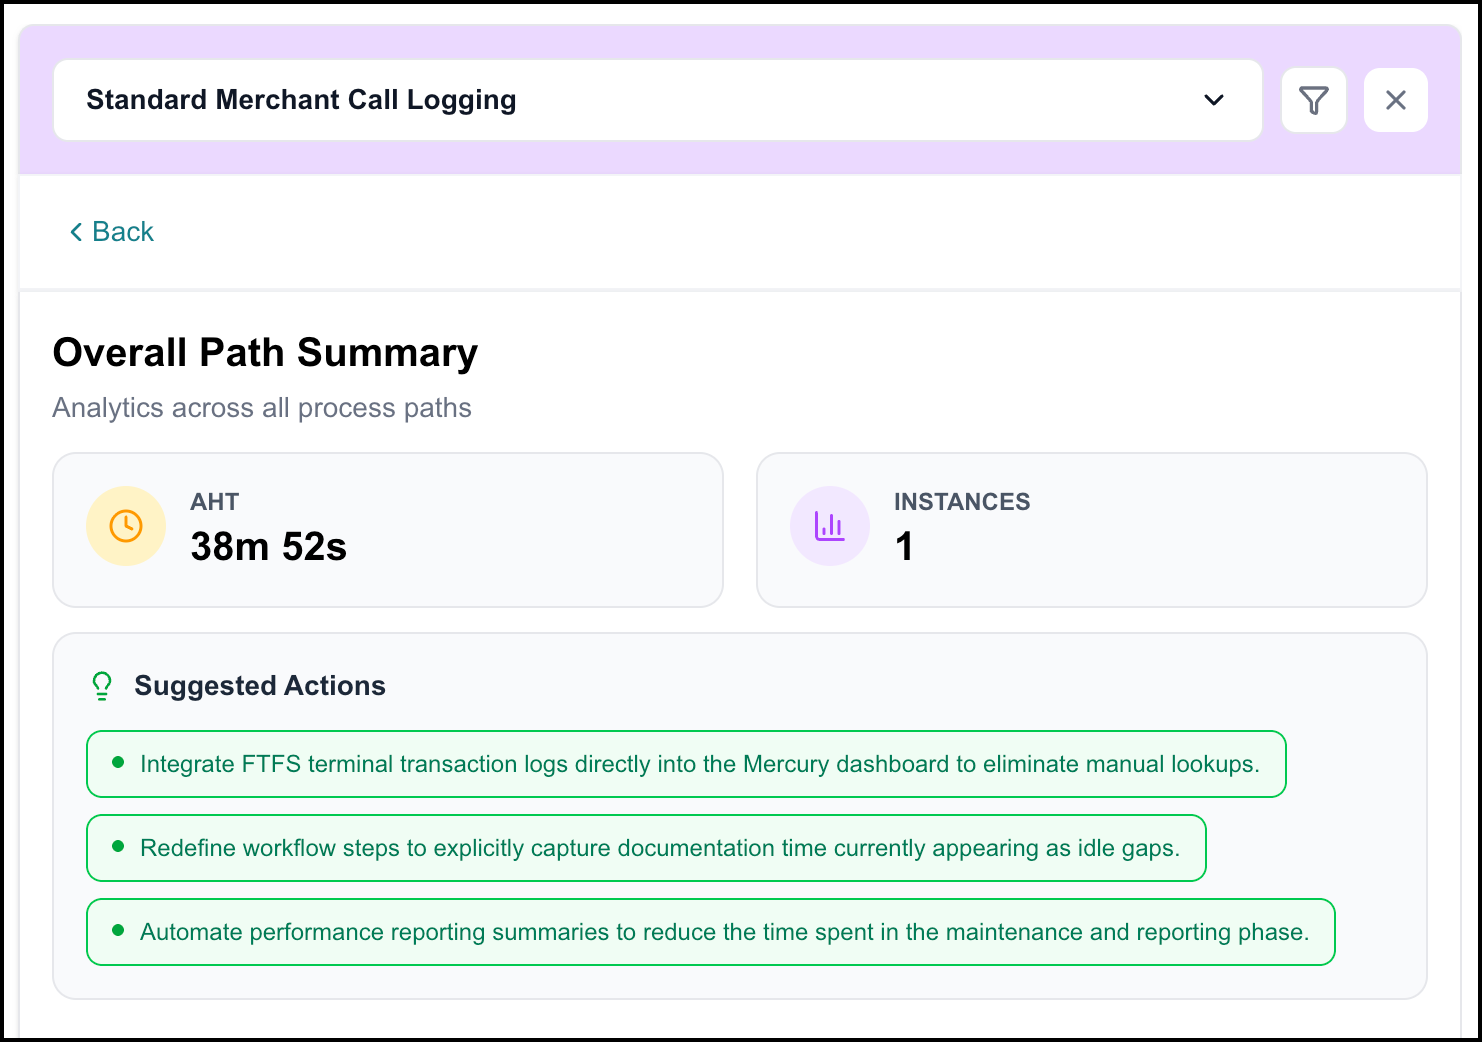
The Metrics panel appears.
To export a report, click Export Report. Your web browser downloads the generated report.
Automation Journey
Automation Journey provides AI-powered feasibility analysis and automation artifact generation for the processes identified in your project. For each process, Automation Journey assesses how many steps are automatable, identifies governance considerations, such as data sensitivity and compliance requirements, and produces structured artifacts, such as workflow steps, tools, and skills, to build automation. Use Automation Journey to understand which of your discovered processes are strong automation candidates and to generate the building blocks needed to act on that assessment.
To access this page, click Automation Journey in the navigation panel under Optimization.
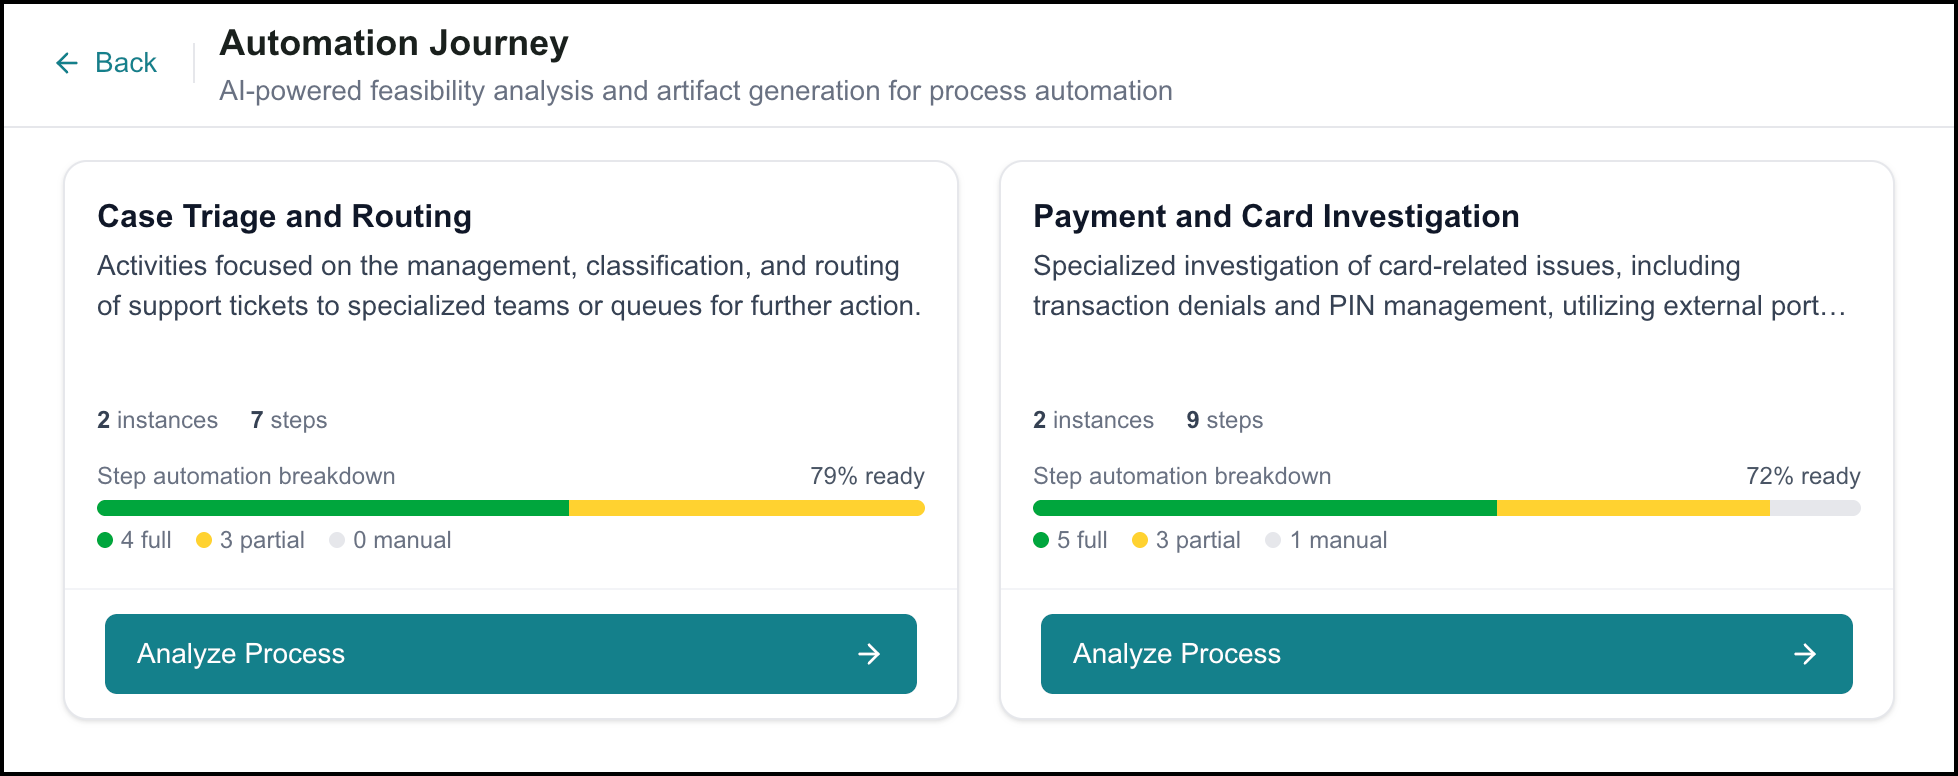
The Automation Journey page opens and displays a list of existing automation reports.
 |
Viewing an Automation Report
An Automation Report is generated for each new process as it is created.
The report card displays the process identifier, the number of instances and steps analyzed, and a step automation breakdown bar showing how many steps are fully automatable, partially automatable, or require manual handling, along with an overall readiness percentage.
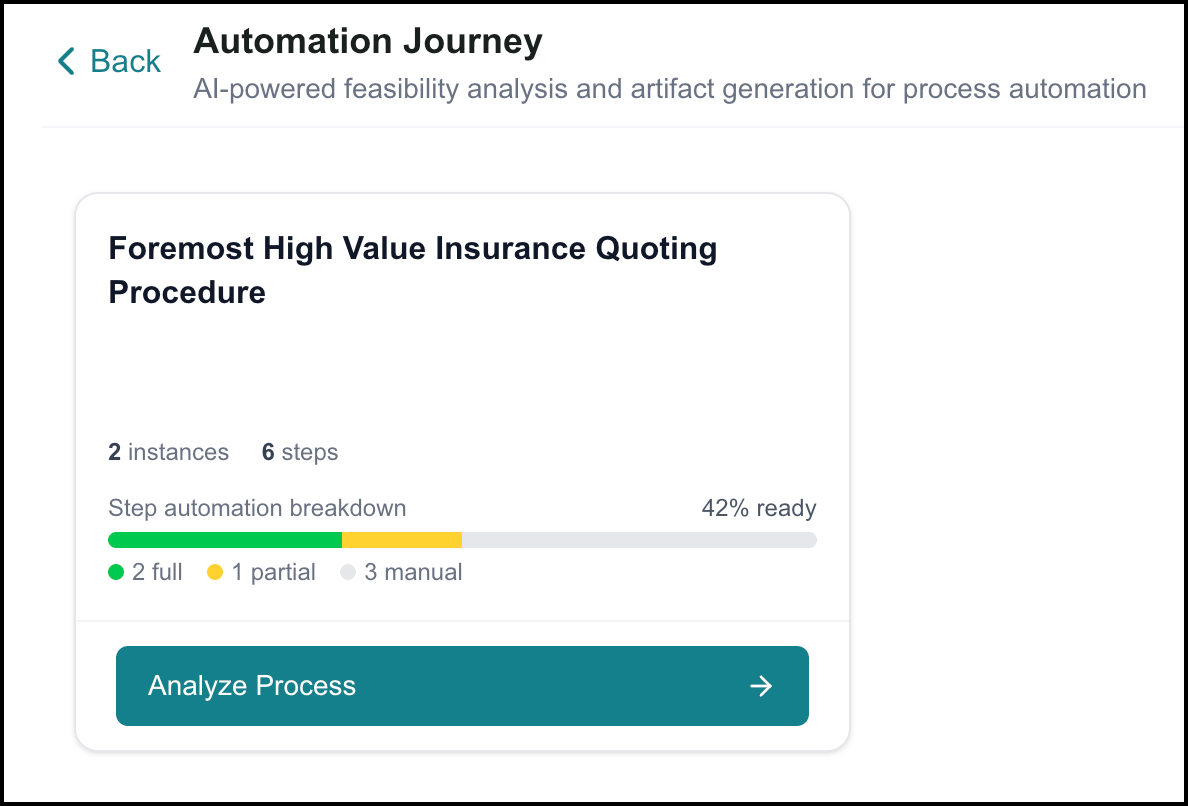 |
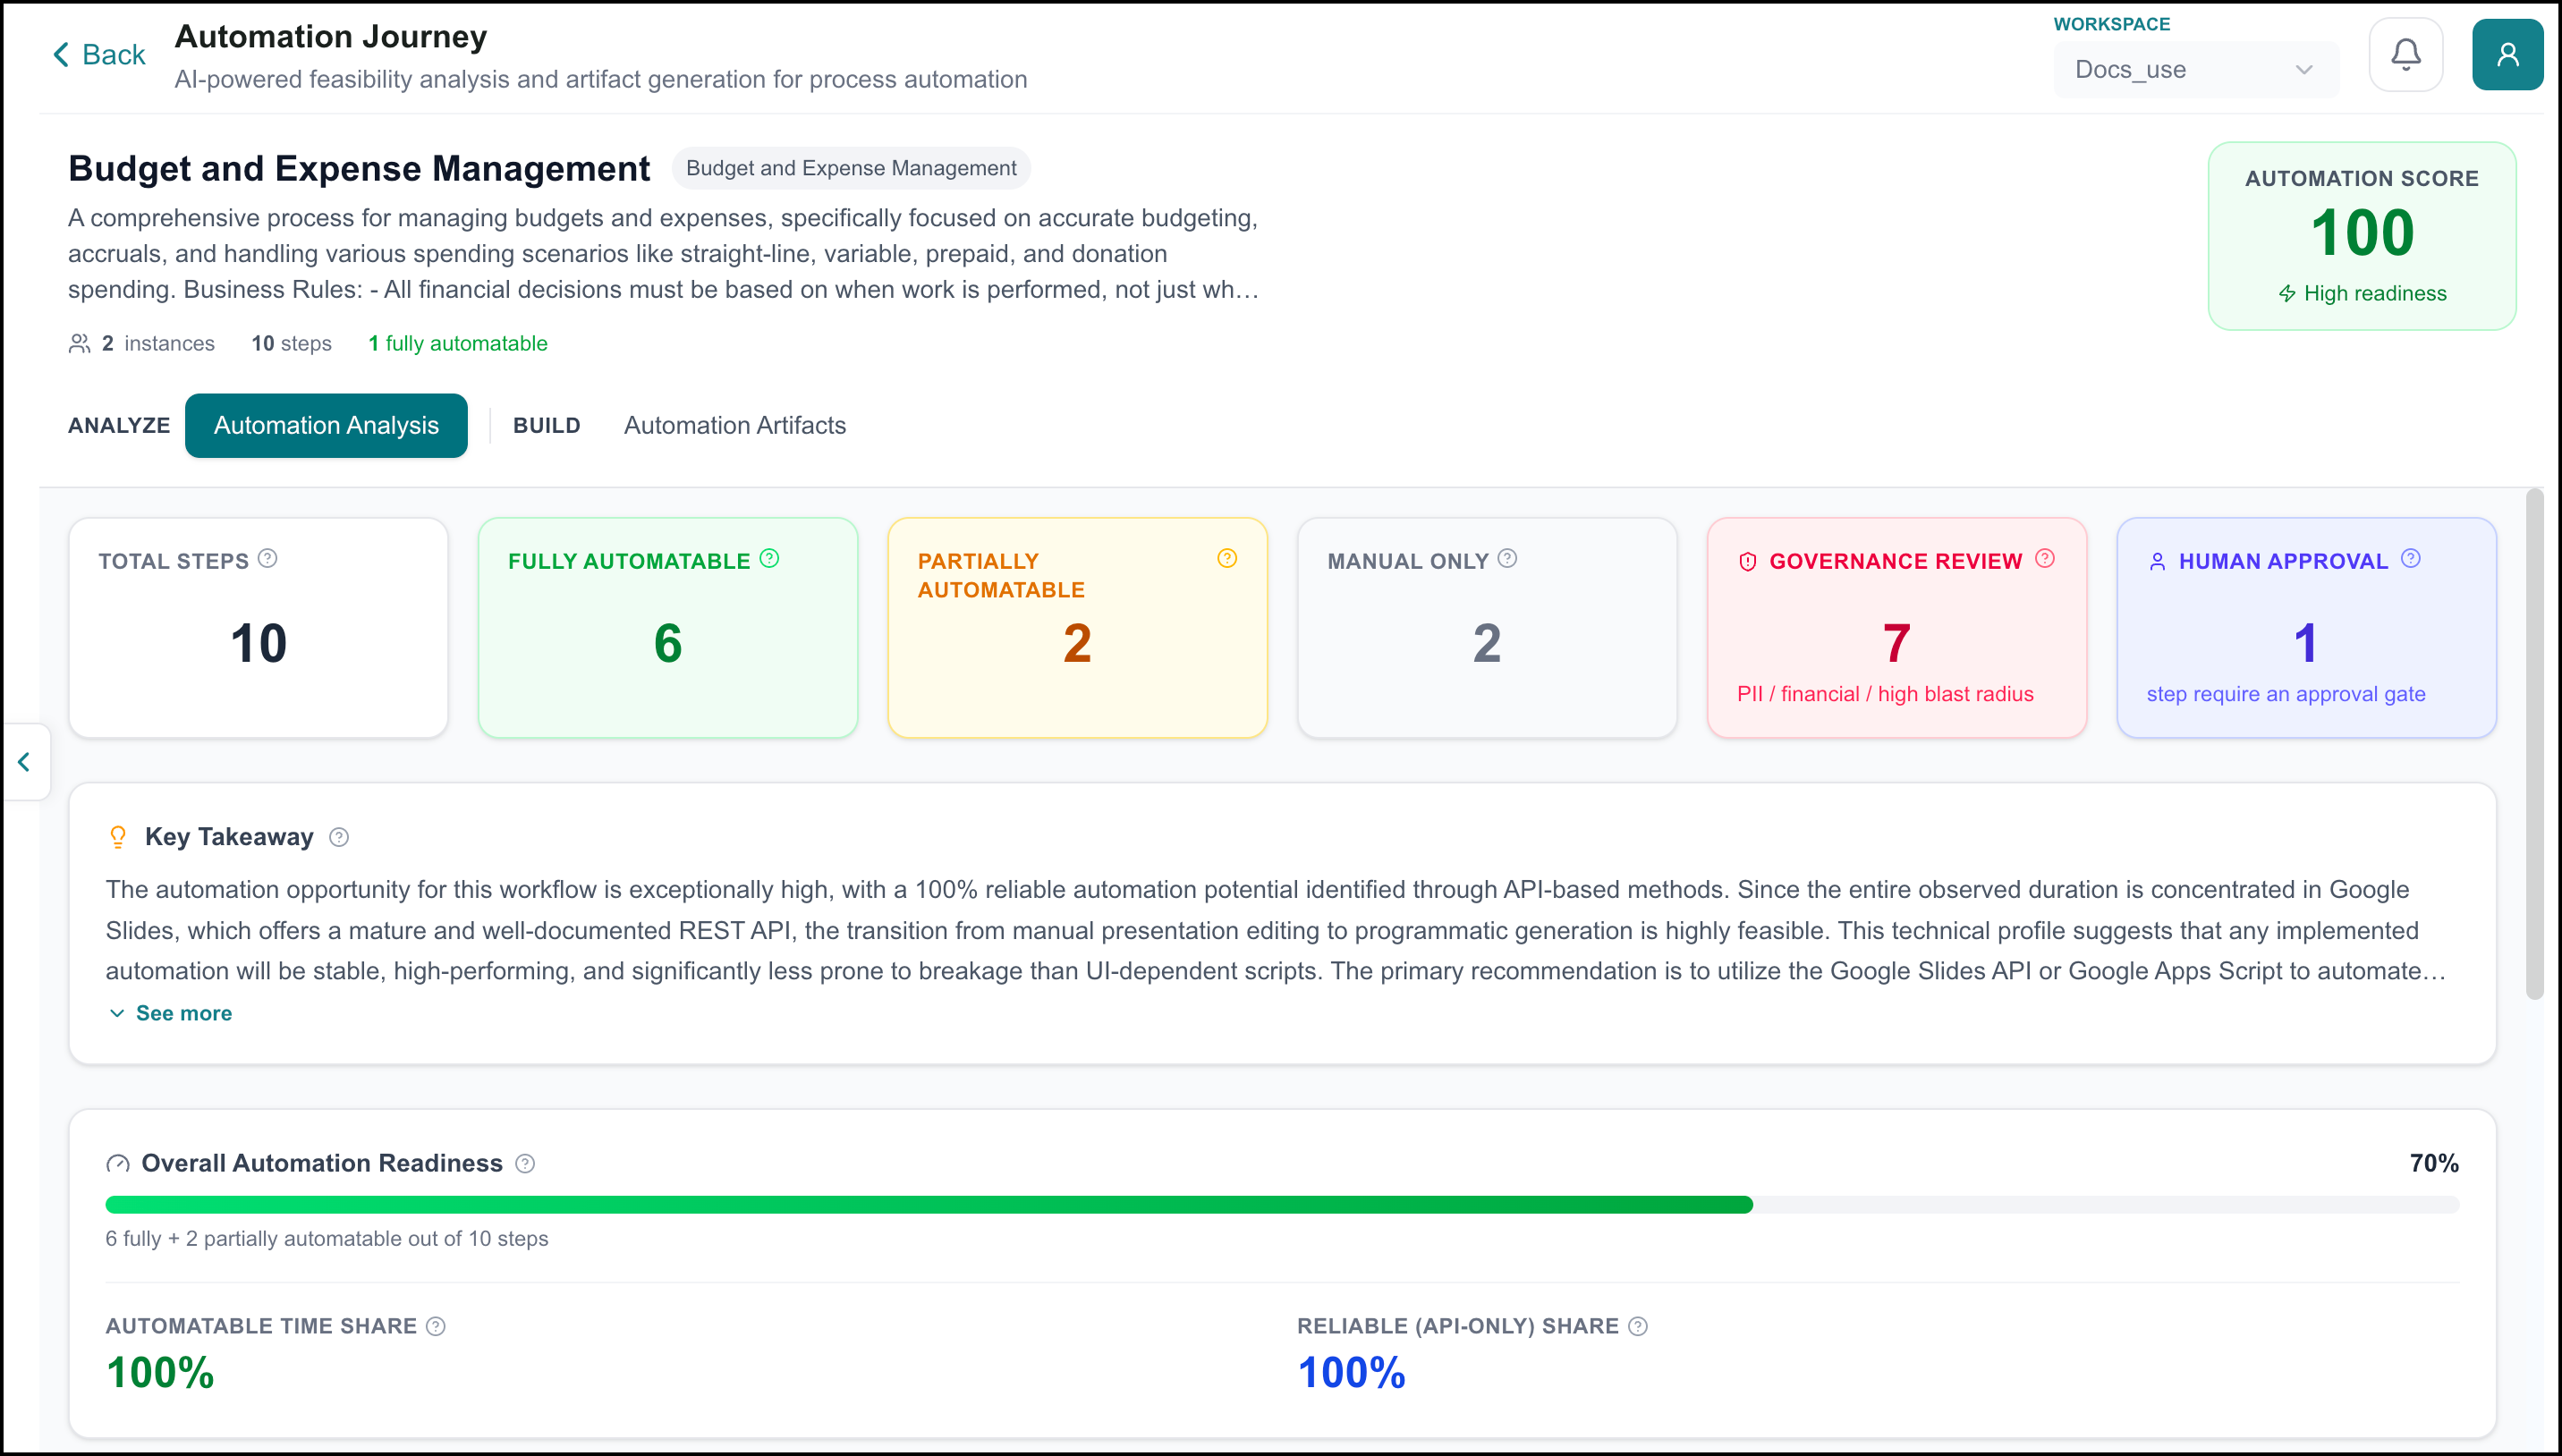
To open an automation report, click Analyze Process. The report opens in the Automation Analysis page, displaying the process name, instance count, step count, and a summary of automatable steps, with the Automation Score in the upper right.
Automation Analysis
The Automation Analysis page provides a detailed assessment of the selected process's automation potential. It shows how many steps are automatable and to what degree, surfaces governance and compliance considerations, and gives an overall readiness score to help you prioritize automation efforts.
Automation Score
The Automation Score is a 0–100 score that reflects the overall automation readiness of the process. The score is accompanied by a readiness label: Low, Medium, or High.
Step Breakdown
The step breakdown displays six metrics that together describe the automation profile of the process:
Total Steps - The total number of steps in the analyzed process.
Highly Automatable - Steps that can be fully automated without human intervention.
Partially Automatable - Steps that can be partially automated but require some human involvement.
Manual Only - Steps that require full human intervention and are not automatable.
Governance Review - Steps that require governance review due to factors such as PII, financial data, or high blast radius.
Human Approval - Steps that require an approval gate before proceeding.
Key Takeaway
Key Takeaway provides an AI-generated summary of the overall automation opportunity for the process, including the systems involved, their suitability for automation, and any recommended approaches or considerations. Click See more to expand the full summary.
Overall Automation Readiness
The Overall Automation Readiness bar shows the percentage of steps that are fully or partially automatable out of the total steps in the process. Two additional metrics are displayed below the bar:
Automatable Time Share - The percentage of total process time that could be automated.
Reliable (API-only) Share - The percentage of process time that can be automated using API-only methods, representing the most stable and reliable automation approach.
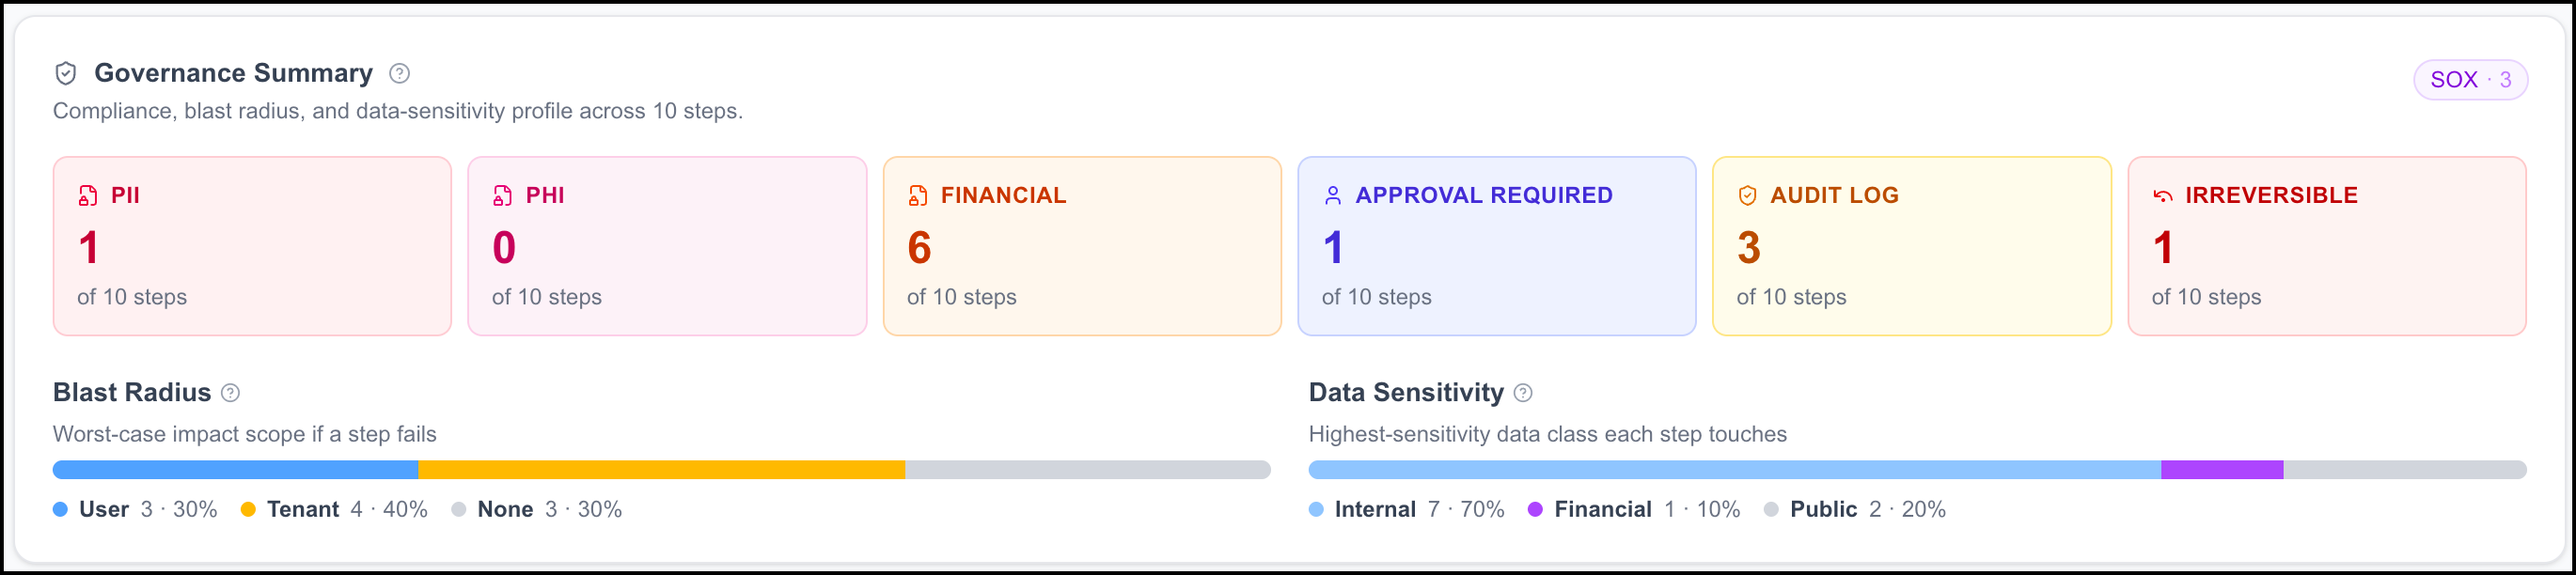
Governance Summary
The Governance Summary provides a compliance, blast radius, and data sensitivity profile across all steps in the process. Any applicable compliance frameworks are displayed as tags in the upper right of the section.
The following governance metrics are displayed, each showing the number of steps affected:
PII - Steps that involve Personally Identifiable Information.
PHI - Steps that involve Protected Health Information.
Financial - Steps that involve financial data.
Approval Required - Steps that require human approval before proceeding.
Audit Log - Steps that must be logged for audit purposes.
Irreversible - Steps whose actions cannot be undone.
Blast Radius shows the worst-case impact scope if a step fails, broken down by category and percentage of steps affected.
Data Sensitivity shows the highest-sensitivity data class each step touches, broken down by category and percentage of steps affected.
By Application and By Step
The By Application and By Step tabs provide further detail:
By Application - Per-tool feasibility, confidence, and usage share across the process, sorted by activity volume.
By Step - A per-step breakdown showing each step's type, name, applications involved, and feasibility rating. Expand any row to see application methods, decision logic, and human-thinking notes.

Automation Artifacts
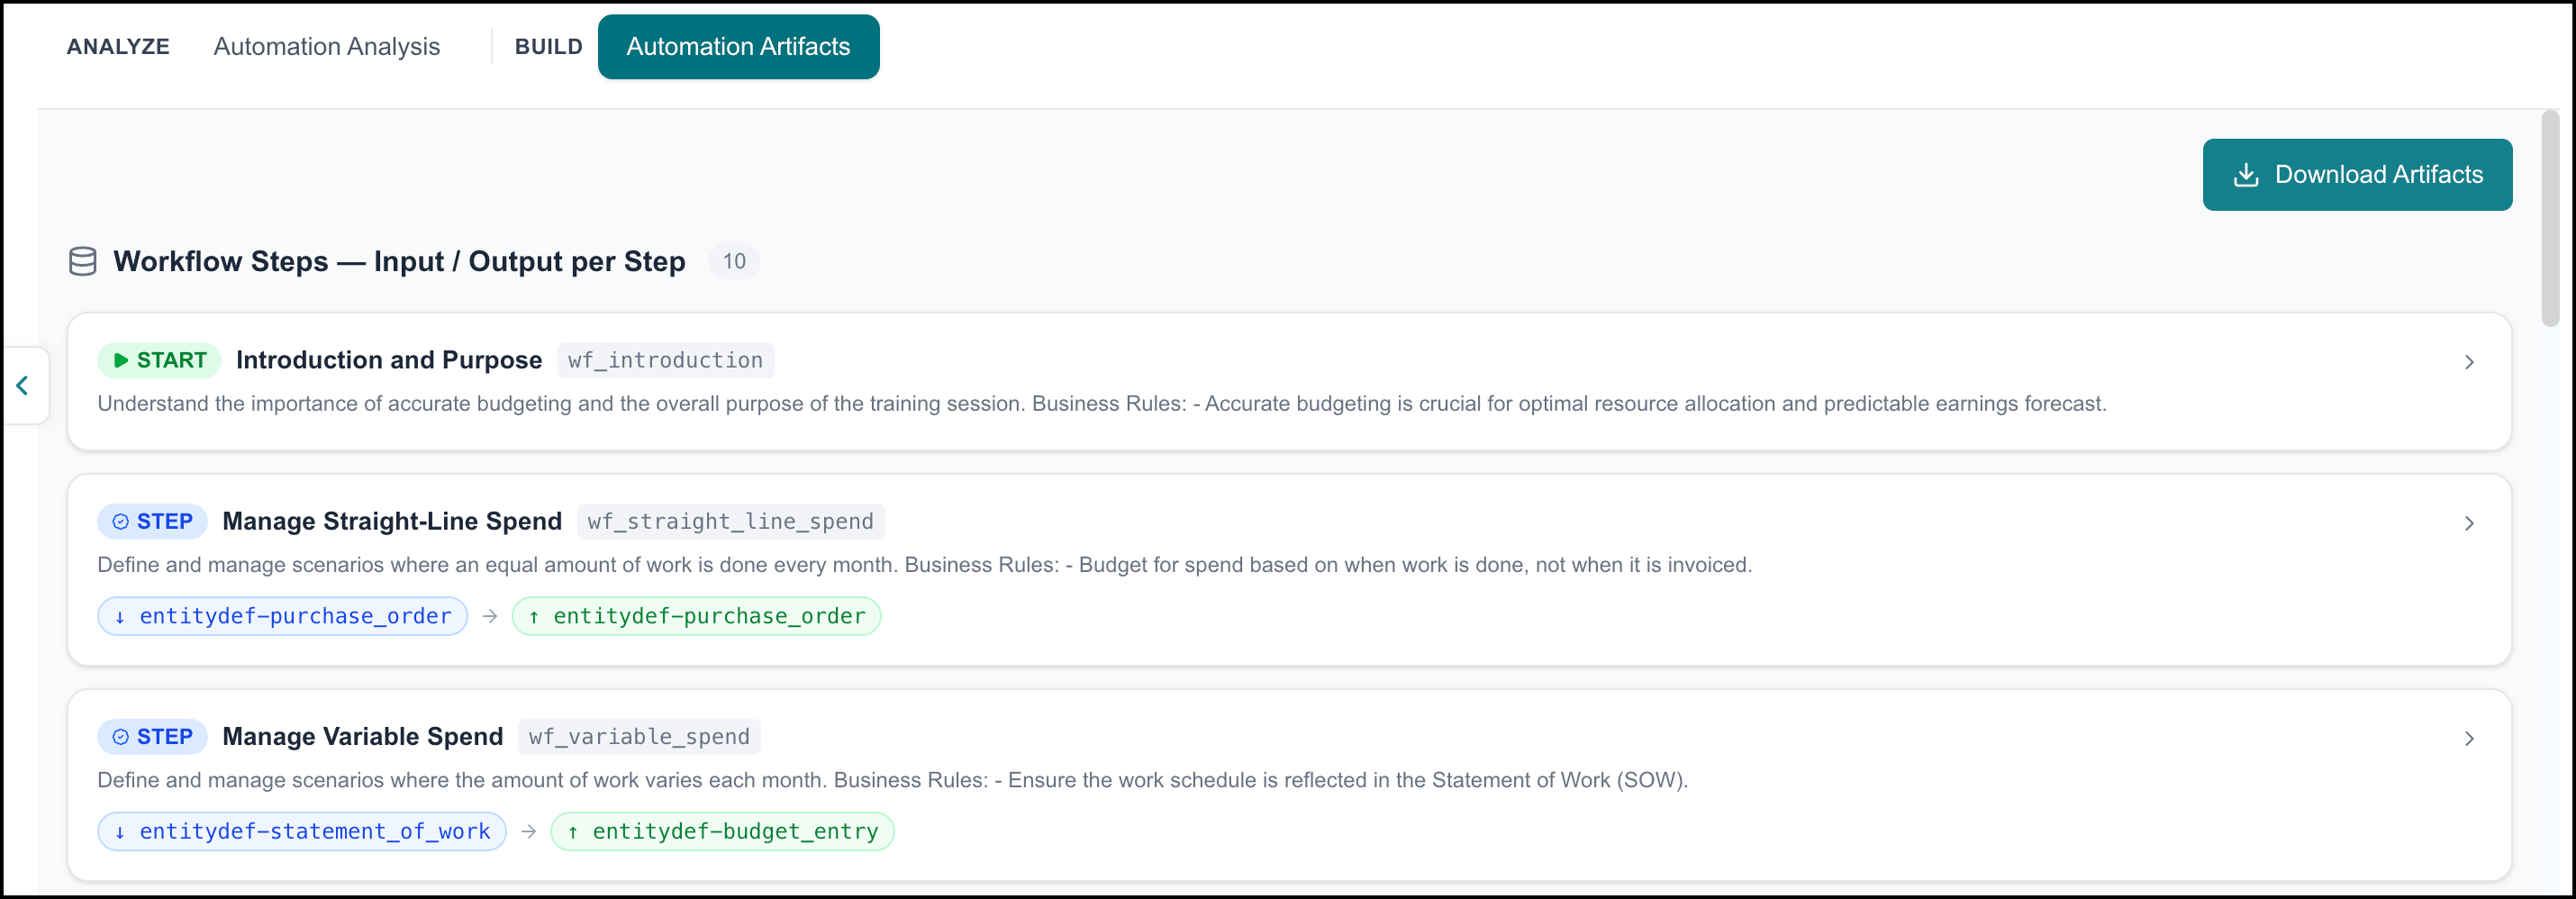
The Automation Artifacts page provides the structured outputs generated from the automation analysis. To access it, click Automation Artifacts under the BUILD tab.
Workflow Steps
The Workflow Steps section lists all steps in the process, each labeled as a START, STEP, or END. Each step displays a workflow ID, a description, and any input and output entities associated with that step. Click a step to expand it and see full detail.
Tools
The Tools section lists the automation tools generated for the process. Each tool displays a name, type tags such as Agent or Mutating, a description, behavioral instructions, and a parameter summary showing the number of inputs and outputs. Click a tool to expand it and see full detail.
Skills
The Skills section lists the automation skills generated for the process. Each skill displays a name, a skill definition ID, and a description. Click a skill to expand it and see full detail.
Downloading Artifacts
To download the full artifact package, click Download Artifacts.
Report Lifecycle
Automation reports are generated once and remain static. A report will remain accurate for the life of the process because new data files create new processes rather than updating existing ones.
ROI Analysis
ROI Analysis quantifies the financial value of process optimization and automation efforts across your discovered processes. Using configurable cost and performance parameters, it projects time savings, cost savings, and capacity gains for process optimization, and models automation investment returns including payback period and net ROI. The page is organized into two tabs: Process Optimization and Automation.
To access this page, click ROI Analysis in the navigation panel under Optimization.
Process Optimization
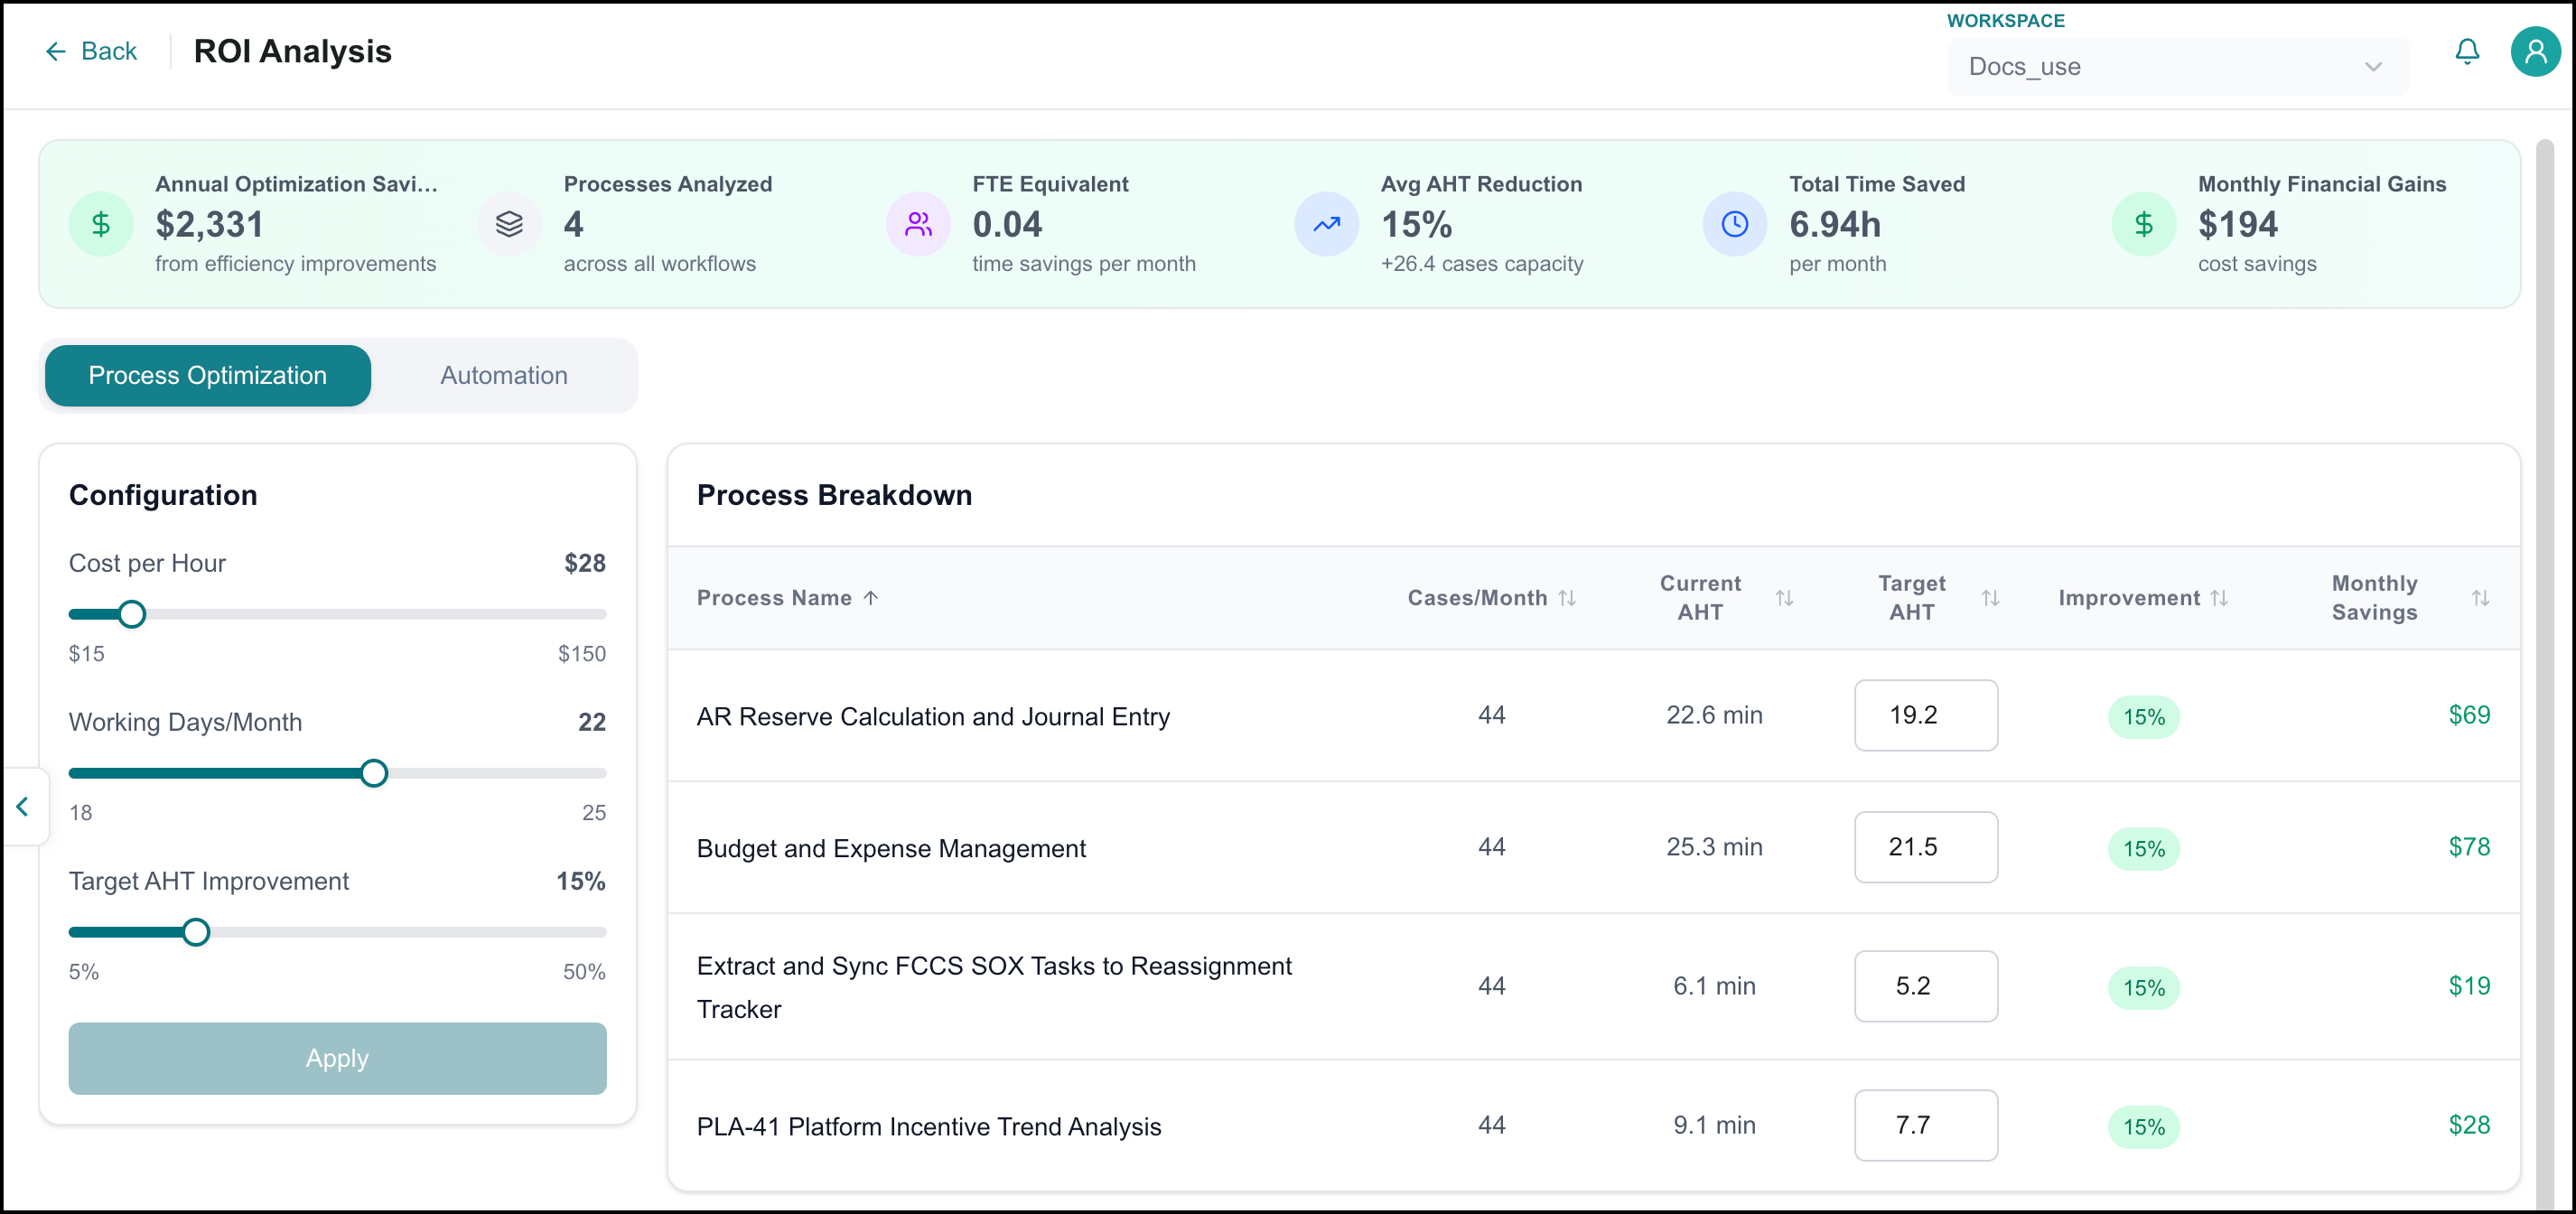
The Process Optimization tab displays projected savings across your discovered processes based on estimated handle time improvements. The following summary metrics are displayed at the top of the page and you can use them to get a quick sense of the overall optimization opportunity across your processes before drilling into the detail below.
Annual Optimization Savings - The total projected annual savings across all analyzed processes.
Processes Analyzed - The number of processes included in the analysis.
FTE Equivalent - The full-time employee equivalent represented by the projected monthly time savings.
Avg AHT Reduction - The average handle time reduction across all processes, expressed as a percentage.
Total Time Saved - The total projected time saved per month across all processes.
Monthly Financial Gains - The total projected monthly cost savings across all processes.
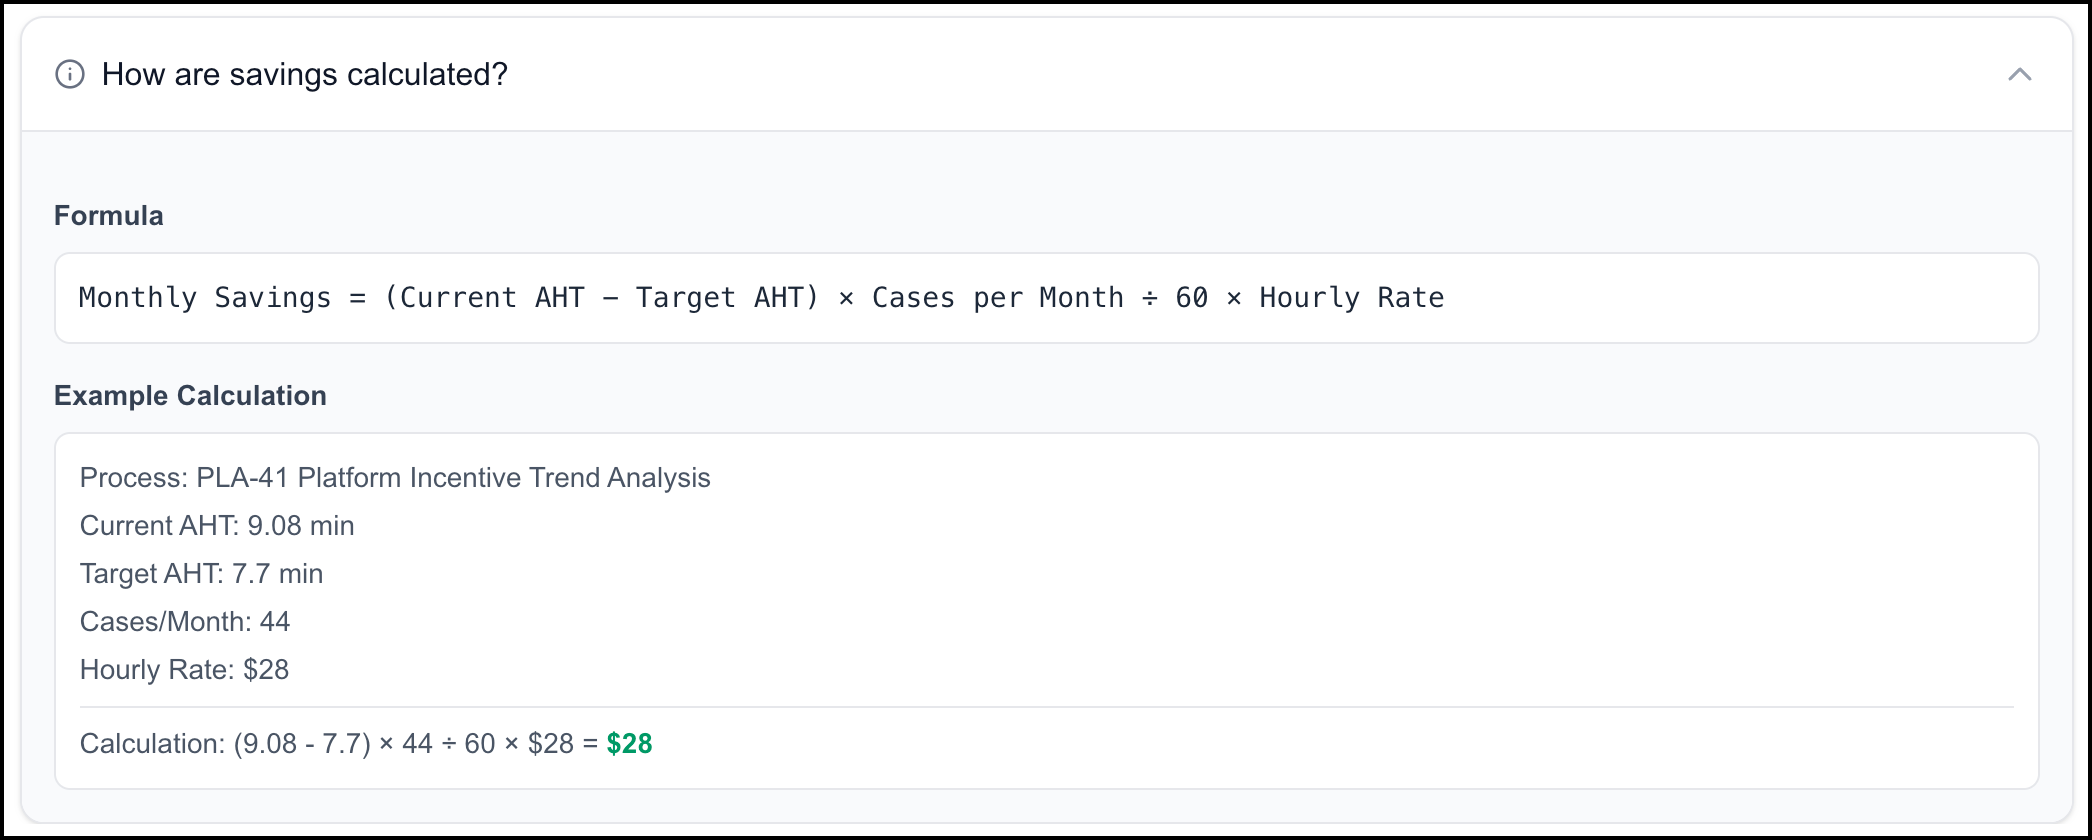
Below the summary metrics: a Configuration panel, a Process Breakdown table, and an AHT Comparison Chart. Click How are savings calculated? at the bottom of the page to see the formula used to calculate monthly savings for each process.
 |
Configuration Panel
The Configuration panel controls the parameters used to calculate savings across all processes. Adjust these parameters to reflect your organization's actual costs and targets. The default values provide a starting point, but results will be more meaningful when the configuration reflects your real operating environment.
Adjust the sliders and click Apply to update the results:
Cost per Hour - The hourly labor cost used to calculate financial savings ($15-$150).
Working Days/Month - The number of working days per month used in calculations (18-25).
Target AHT Improvement - The target percentage reduction in Average Handle Time across all processes (5%-50%).
Process Breakdown
The Process Breakdown table displays projected savings for each analyzed process. Use this table to see which processes offer the greatest savings potential and to fine-tune projections for individual processes. If the Target AHT improvement set by the slider feels too aggressive or too conservative for a specific process, adjust it directly in the table to model a more realistic target. The table includes the following columns:
Process Name - The name of the process.
Cases/Month - The number of cases handled per month.
Current AHT - The current Average Handle Time for the process.
Target AHT - The target Average Handle Time after improvement. Adjust this value per process using the up and down arrows to override the Target AHT Improvement slider for that process. Changes are reflected immediately in the Improvement percentage, Monthly Savings, and the AHT Comparison Chart.
Improvement - The percentage improvement between the current and target AHT.
Monthly Savings - The projected monthly cost savings for the process.
AHT Comparison Chart
The AHT Comparison Chart displays current and target Average Handle Time side by side for each process as a horizontal bar chart, providing a visual comparison of the projected improvement across all processes. The chart updates automatically when Target AHT values are adjusted in the Process Breakdown table.
Use this chart to visually confirm that your target improvements are realistic relative to current handle times, and to identify processes where the gap between current and target AHT is largest.
Automation
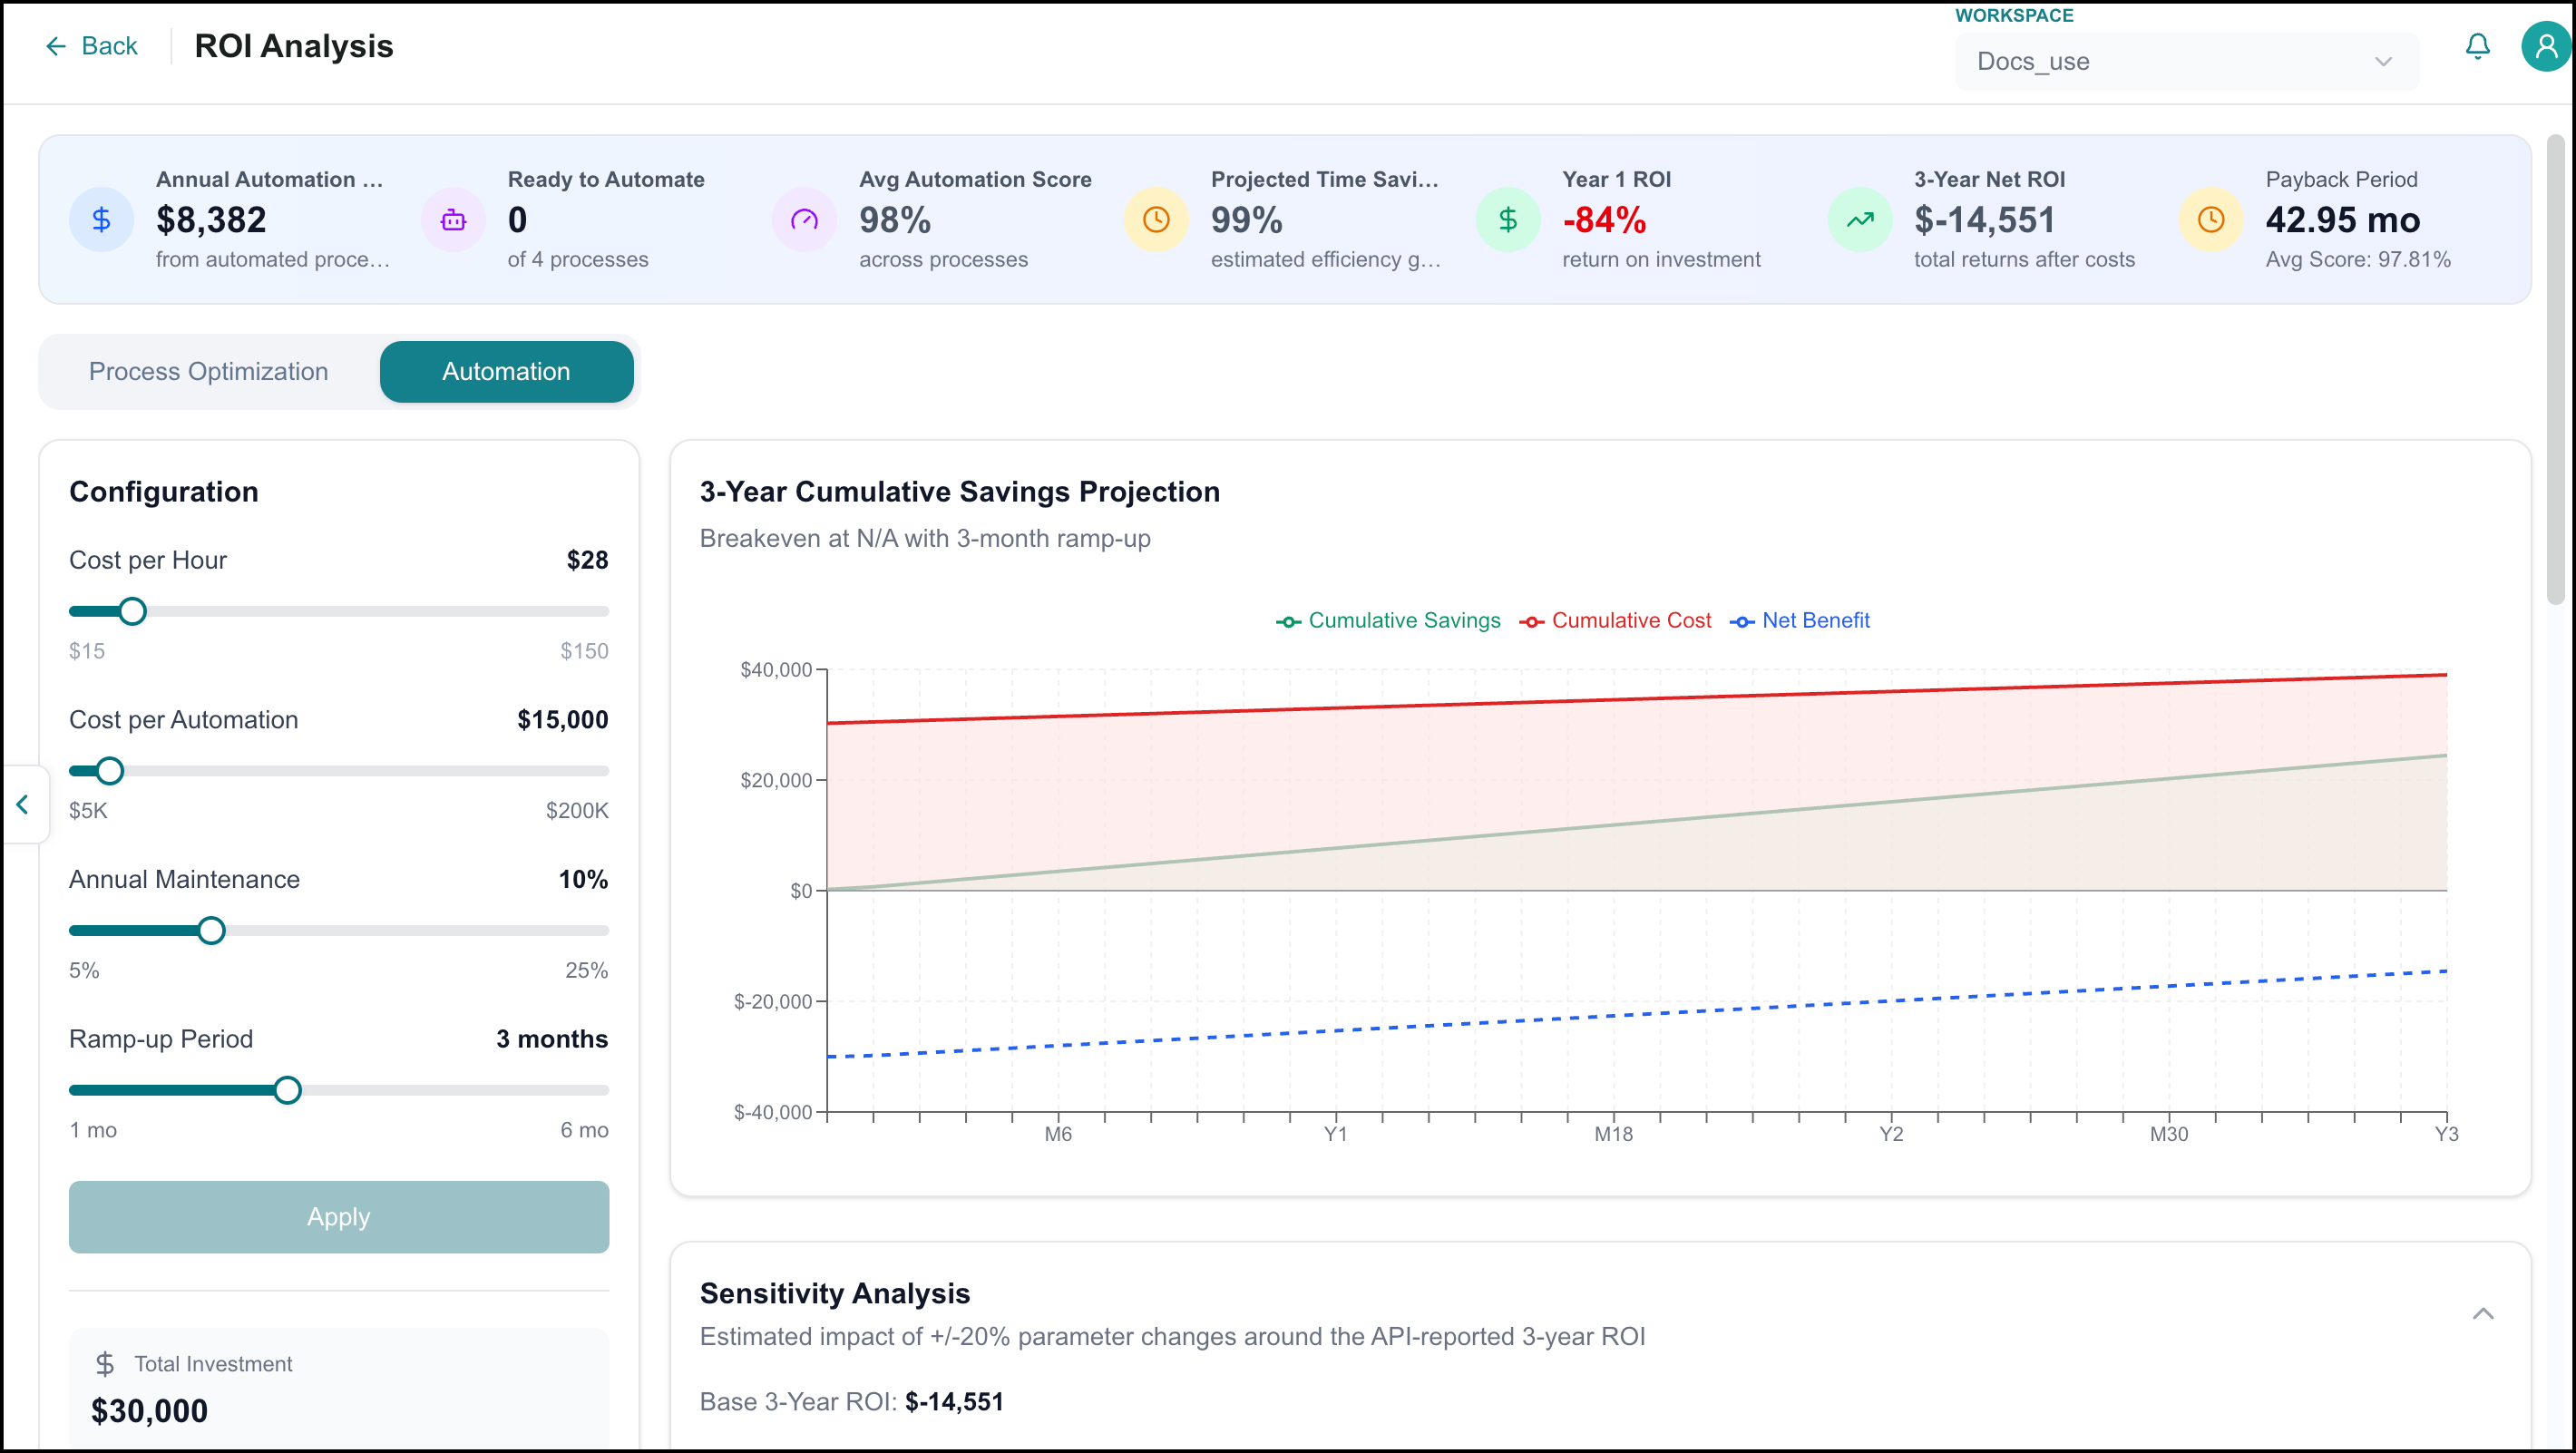
The Automation tab models the return on investment of automating your discovered processes based on configurable cost and implementation parameters. The following summary metrics are displayed at the top of the page and you can use them to quickly assess the overall automation opportunity and investment outlook across your processes before reviewing the rest of the sections.
Annual Automation Savings - The total projected annual savings from automating eligible processes.
Ready to Automate - The number of processes with an automation score indicating full automation readiness.
Avg Automation Score - The average automation score across all analyzed processes.
Projected Time Savings - The estimated efficiency gain from automation, expressed as a percentage.
Year 1 ROI - The projected return on investment in the first year.
3-Year Net ROI - The total projected return after costs over a three-year period.
Payback Period - The estimated time to recover the automation investment.
Below the summary metrics: a Configuration panel with scenario saving and comparison tools, a 3-Year Cumulative Savings Projection chart, a Sensitivity Analysis, an Automation Readiness Matrix, a Savings Contribution by Process chart, and a Process Comparison table.
Configuration Panel
The Configuration panel controls the parameters used to calculate automation ROI across all processes. Adjust these parameters to reflect your organization's actual automation costs and implementation timeline. Use the Scenarios feature to save and compare multiple configurations before settling on one.
Adjust the sliders and click Apply to update the results:
Cost per Hour - The hourly labor cost used to calculate financial savings ($15-$150).
Cost per Automation - The estimated cost to automate a single process ($5K-$200K).
Annual Maintenance - The estimated annual maintenance cost as a percentage of the automation investment (5%-25%).
Ramp-up Period - The estimated time before the automation reaches full operational capacity (1-6 months).
The following values are calculated based on the current configuration and updated when Apply is clicked:
Total Investment - The total estimated cost to automate all selected processes.
Payback Period - The estimated time to recover the total investment.
3-Year Net ROI - The total projected return after costs over a three-year period.
Working with Scenarios
The Scenarios feature lets you save up to three named configurations of the sliders for comparison. To save a scenario, enter a name in the Scenario name field and click Save. Saved scenarios are listed below the Configuration panel and can be deleted individually using the delete icon.
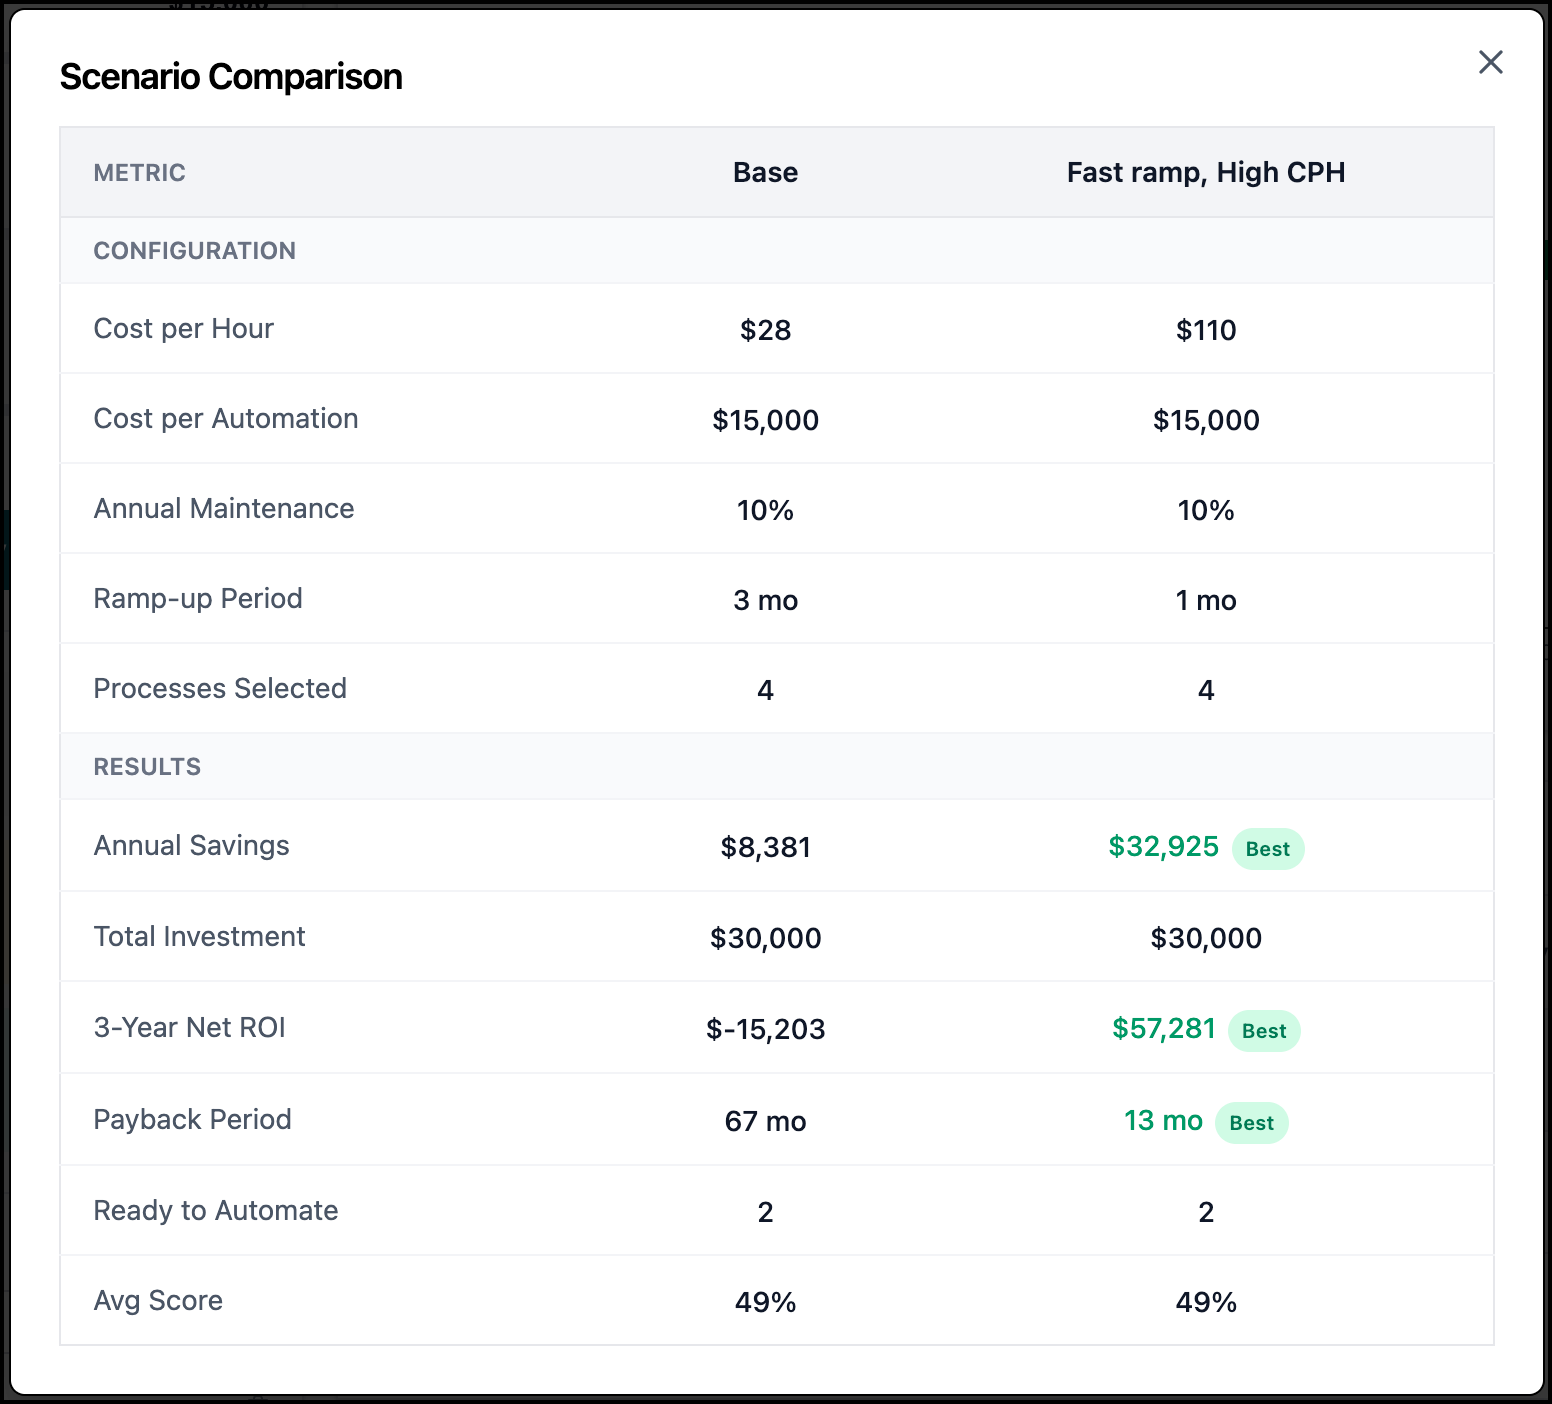
Once you have saved two or more scenarios, click Compare Scenarios to open the Scenario Comparison modal. The modal displays each scenario's configuration inputs and resulting metrics side by side, with the best-performing value highlighted for each metric.
Use scenarios to model different cost and timeline assumptions side by side. For example, a conservative baseline, an optimistic fast-ramp option, and a high-cost cautious approach, so you can present stakeholders with a range of outcomes rather than a single projection.
 |
3-Year Cumulative Savings Projection
The 3-Year Cumulative Savings Projection chart shows how Cumulative Savings, Cumulative Cost, and Net Benefit are projected to change over a three-year period. Hover over the chart to see the values for each line at a specific point in time.
Use this chart to understand when automation investments are expected to begin generating positive returns and how savings accumulate over time relative to ongoing costs.
Sensitivity Analysis
Click Sensitivity Analysis to expand a chart showing the estimated impact of parameter changes on the base 3-Year ROI. The chart displays the effect of a +/-20% change to each configuration parameter: Cost per Automation, Cost per Hour, Annual Maintenance, and Ramp-up Period. This allows you to identify which parameters have the greatest influence on your projected returns.
Use this chart to identify which configuration parameters have the greatest impact on your projected ROI. If a parameter has a large effect, it is worth ensuring that value is as accurate as possible before making investment decisions.
Automation Readiness Matrix
The Automation Readiness Matrix categorizes your processes into three columns based on their automation score:
Full Automation (Score 75+) - Processes that are strong candidates for full automation.
AI-Assisted (Score 50-74) - Processes that are suited to a hybrid approach combining automation with human involvement.
Human Primary (Score <50) - Processes that require primarily human handling and are not yet strong automation candidates.
Each process is displayed as a card showing its Automation Score, Potential Savings per Year, ROI, Payback period, and tags indicating its complexity and readiness level. Use this matrix to prioritize which processes to automate first. Processes in the Full Automation column with high potential savings are typically the strongest candidates for immediate action.
Savings Contribution by Process
The Savings Contribution by Process chart displays the annual savings potential for each process as a horizontal bar chart, ranked by impact. Bars are colored by readiness category: Ready (75+), Partial (50-74), and Manual (<50). This makes it easy to see which processes offer the greatest savings potential and how ready they are for automation.
Use this chart to identify which processes are driving the most savings potential and which are contributing little, helping you focus automation efforts where they will have the greatest impact.
Process Comparison
The Process Comparison table provides a sortable summary of all processes and their key automation metrics. Use this table to compare processes across key financial metrics and to model the effect of including or excluding specific processes from your automation plan using the checkboxes. The table includes the following columns:
Process Name - The name of the process.
Score - The automation score for the process, displayed with a progress bar.
Complexity - The estimated implementation complexity for the process.
Annual Savings - The projected annual savings from automating the process.
Investment - The estimated cost to automate the process.
ROI - The projected return on investment for the process.
Payback - The estimated time to recover the automation investment for the process.
Use the checkboxes next to each process to include or exclude it from the ROI calculations across the page.
SOP Studio
SOP Studio is the workspace for authoring and managing Standard Operating Procedures (SOPs): the documented version of how a process should run. Each SOP contains descriptive text and can optionally include a workflow diagram, screenshots, or both. You can export SOPs in PDF or Word format.
To access SOP Studio, click SOP Studio in the navigation panel or in the Process Explorer while viewing a process.
The SOP Studio page opens, and shows a list of existing SOPs with SOP Name, Last Edited, and available actions.
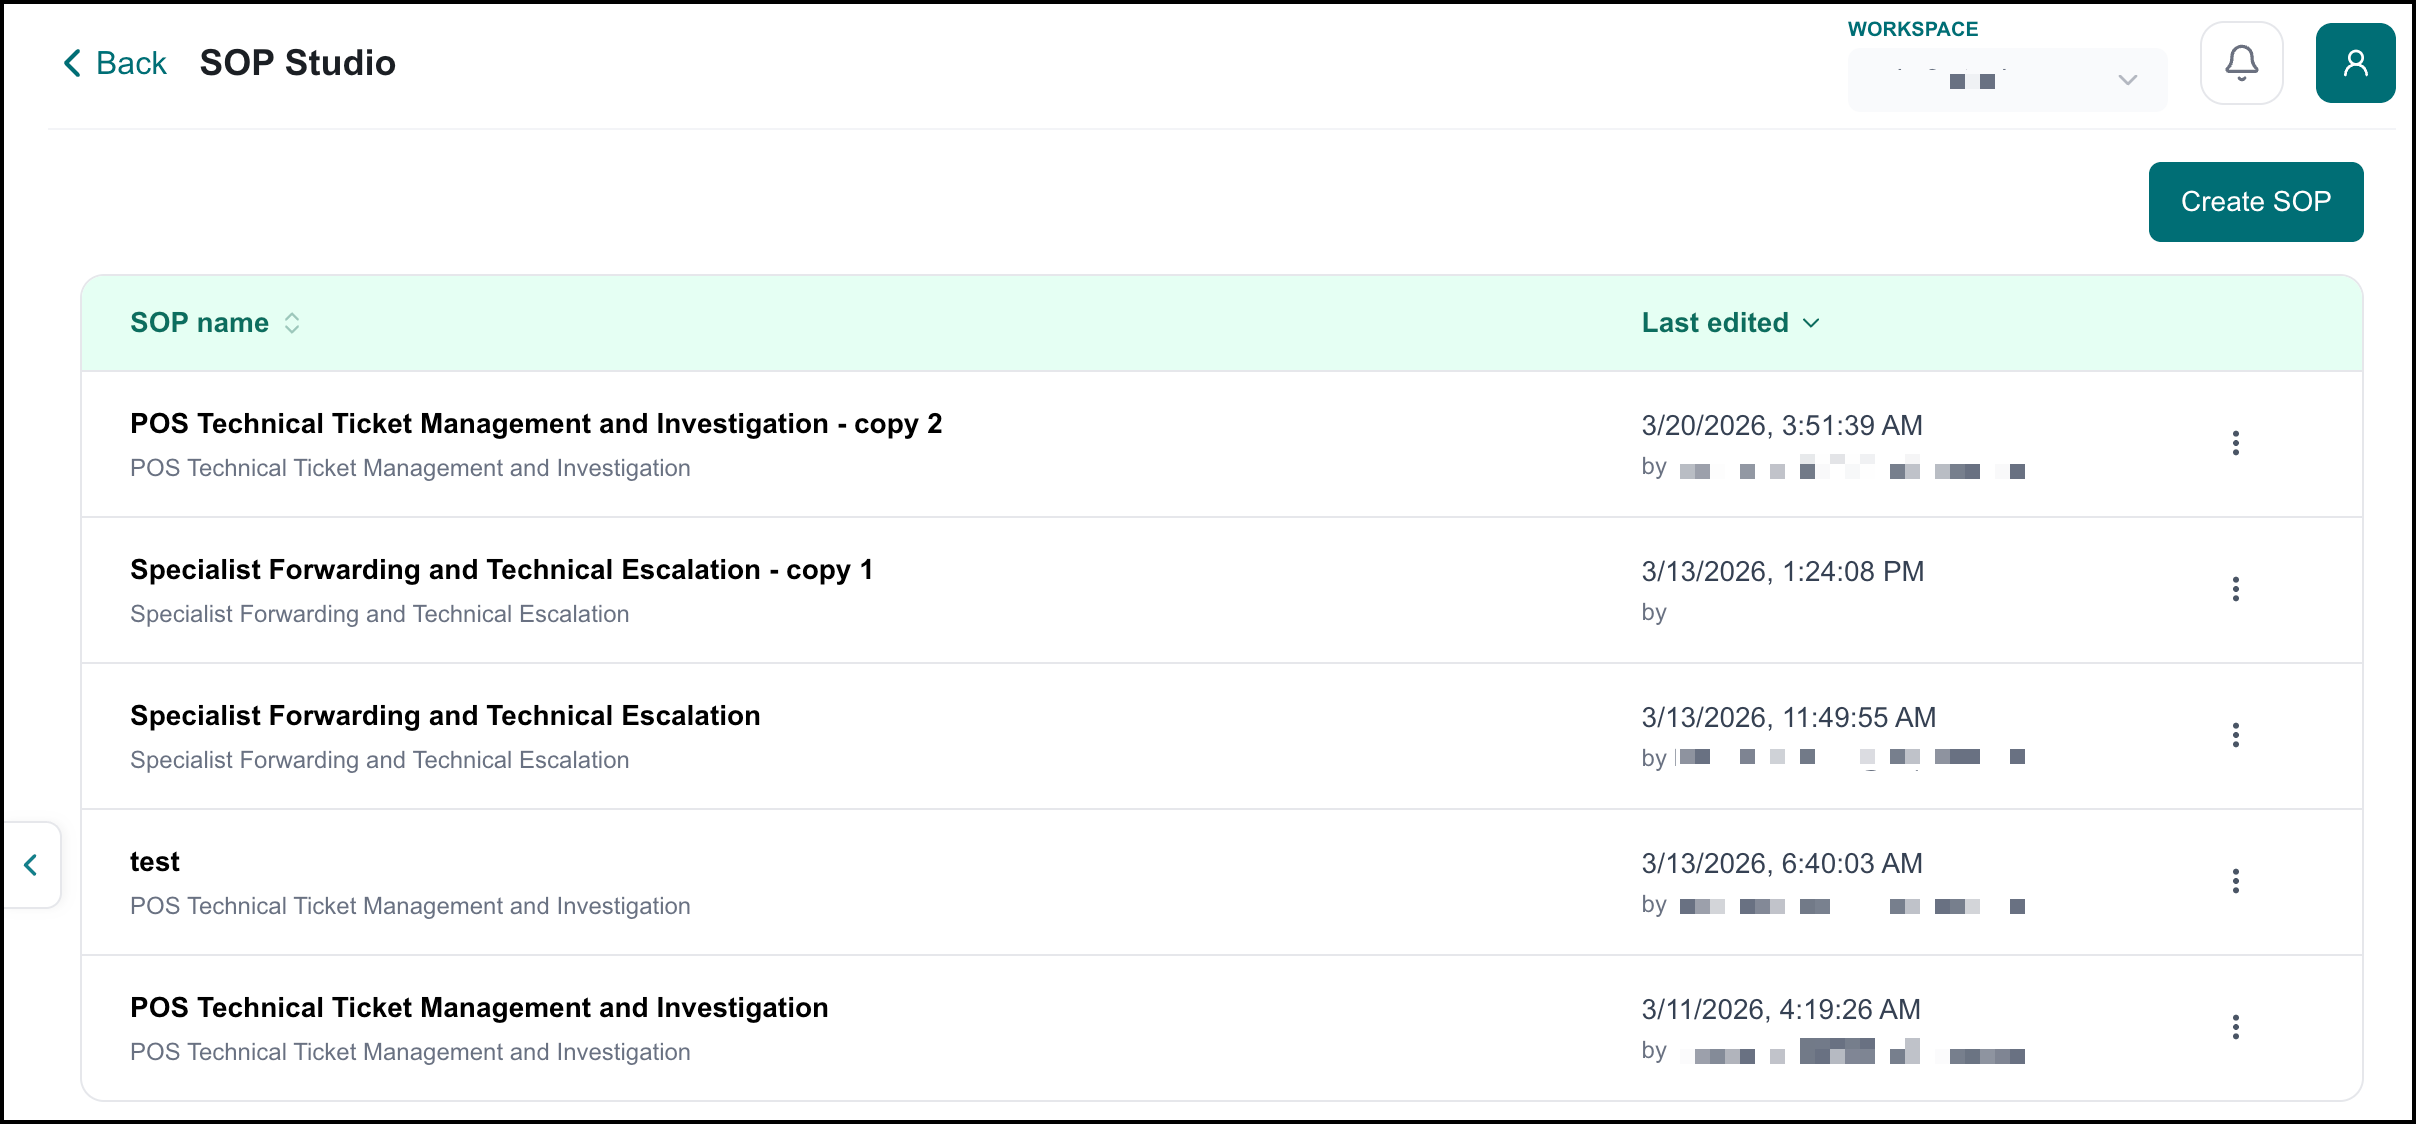
From the SOP Studio, you can create new SOPs, edit, rename, or delete existing SOPs, and export SOPs in PDF or Word format.
Creating New SOPs
To create a new SOP:
Click Create SOP on the SOP Studio page. The Add New Process dialog opens.
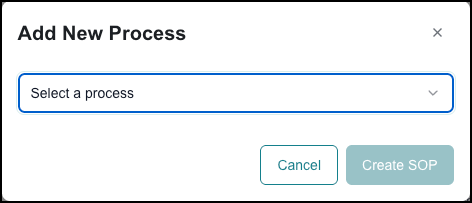
Select a process from the dropdown and click Create SOP.
The new process is added to the SOP Library. It is complete as is, or you can edit it and make further changes.
Editing SOPs
To edit an SOP, click the process name. The SOP Editor opens, and shows a list of filters and the process flow map:
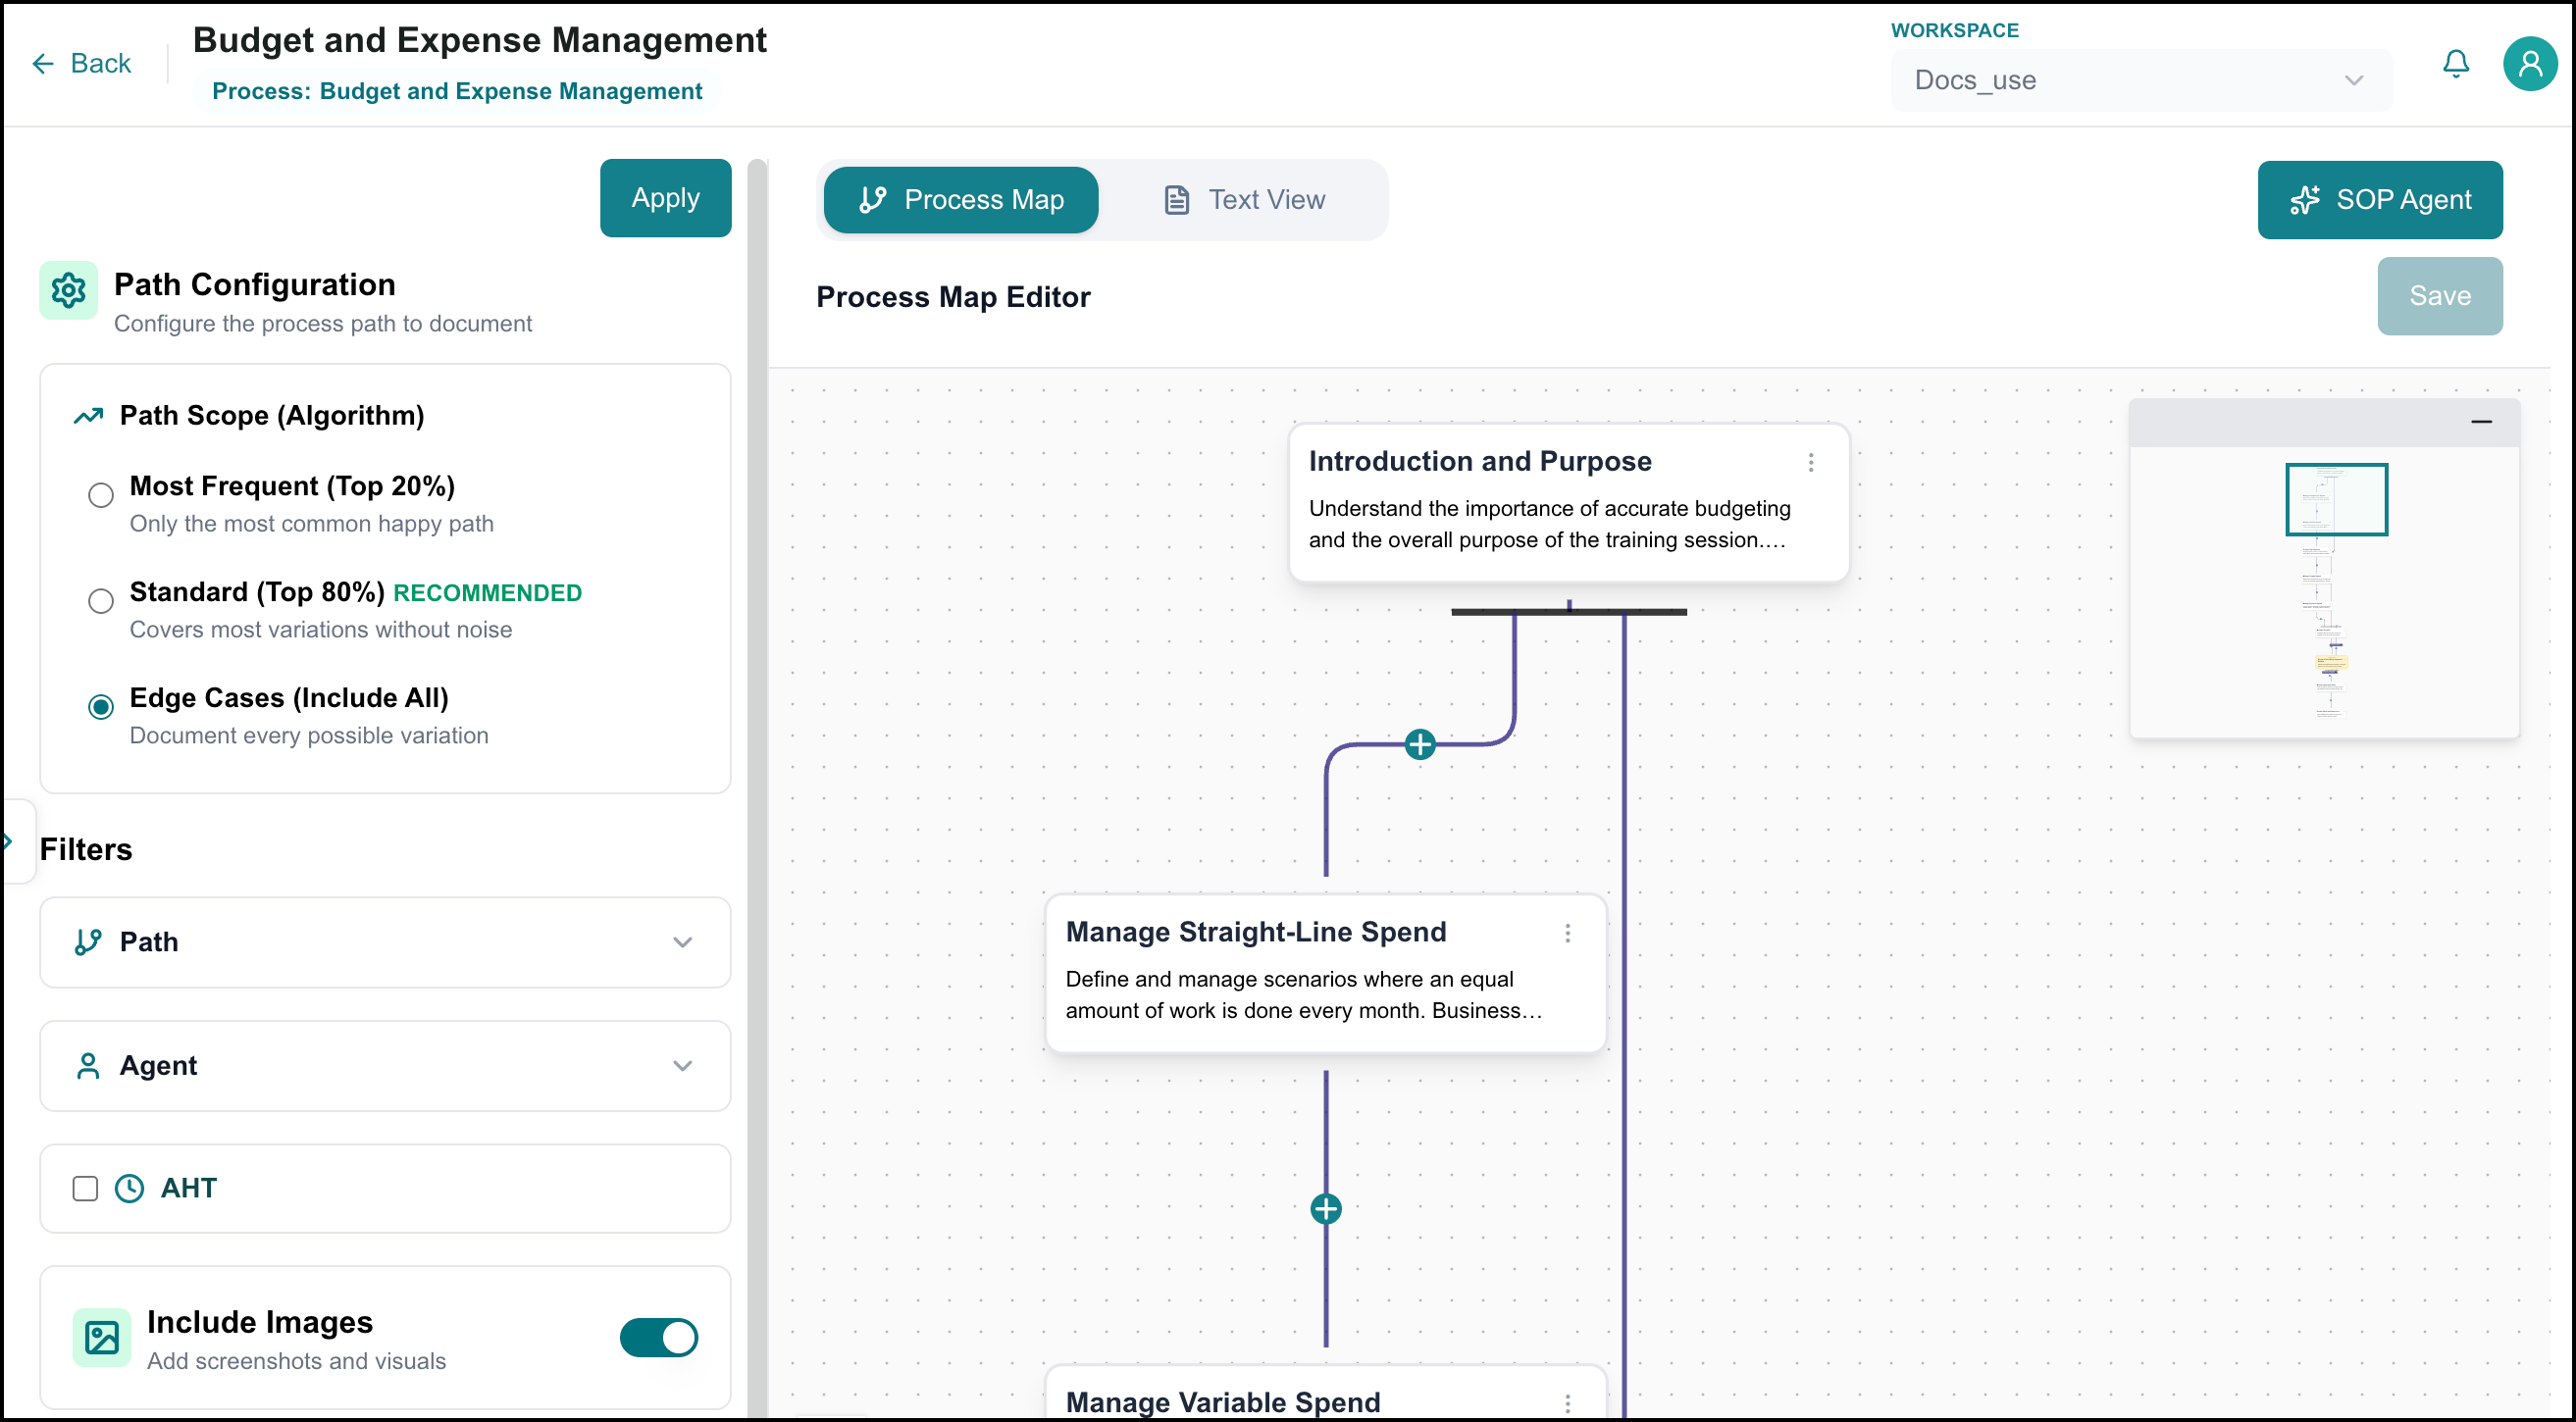
You have two options for editing an SOP:
Use the SOP Agent; it guides you through editing the SOP.
Make changes directly on the SOP Editor.
To make changes directly via the SOP Editor:
Set the scope and apply filters.
Specify the scope of the paths to configure. For example, Standard (Top 80%) or Most Frequent (Top 20%).
Use the filter controls to further define the process you want to document. You can filter by criteria such as Path, Agent, or AHT.
Click Apply.
The process map updates to reflect your selections. If you change a filter setting without applying it, and then attempt to modify the process map, you are prompted to apply the pending filters before continuing or continue without applying them.
Edit the process map. The process map displays the steps and decision points for the selected process.
Modify steps in the map in the following ways:
To add a step, click the Add Step
 icon at the point in the map where you want to insert the step, or click the Ellipsis
  icon on an existing step and select Add Below. Edit the new step as desired.
To edit a step's title or description, click the Ellipsis
icon on an existing step and select Edit.To delete a step, click the Ellipsis
icon on an existing step and select Delete.
Modify decision points in the following ways:
To add a branch from the decision point, click the Ellipsis
icon on an existing branch and select Add Branch.To edit the decision point's title or description, click the Ellipsis
icon on an existing branch and select Edit.To delete a decision point, click the Ellipsis
icon on the decision point and select Delete. The decision point and all following steps are removed.
Drag steps and decision points to reposition them on the process map. This changes their visual position only and does not affect the order or logic of the process flow.
Use the view controls to zoom or fit the process map to the screen.
Click + to zoom in. Click - to zoom out. Click the Fit
icon to fit the path in the view.
Click Save to save your changes.
The updated SOP is saved to the SOP Library.
Editing SOPs with BAIC Copilot
The BAIC Copilot helps you update an SOP quickly using natural language, without manually editing the process map.
To edit an SOP using the Copilot:
On the SOP Studio page, select the SOP Agent icon at the bottom left.
The BAIC Copilot panel opens.
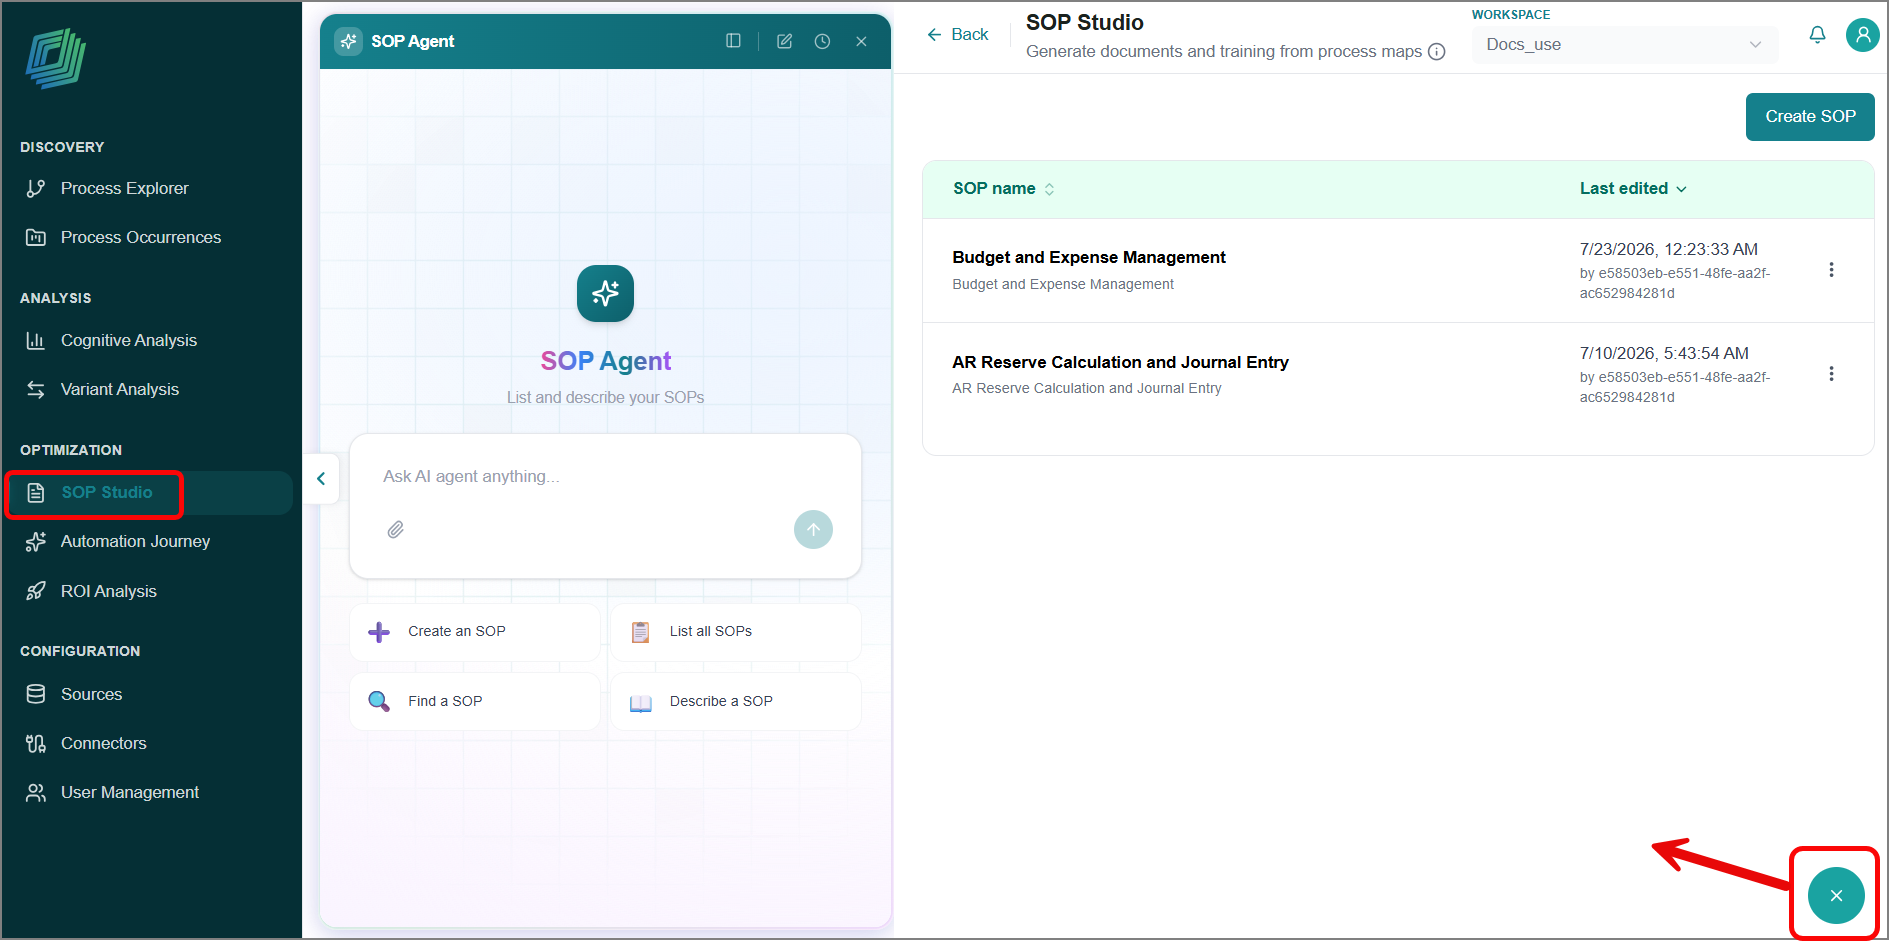
Enter your request about the SOP.
The BAIC Copilot reviews your request and either provides the information you asked for or updates the SOP as needed.
The BAIC Copilot panel has other capabilities:
View session history
Switch panel view
Create a new session
Renaming SOPs
To rename an SOP:
Click the Ellipsis
icon for the SOP in the SOP Library.Select Rename.
The Rename SOP dialog appears.
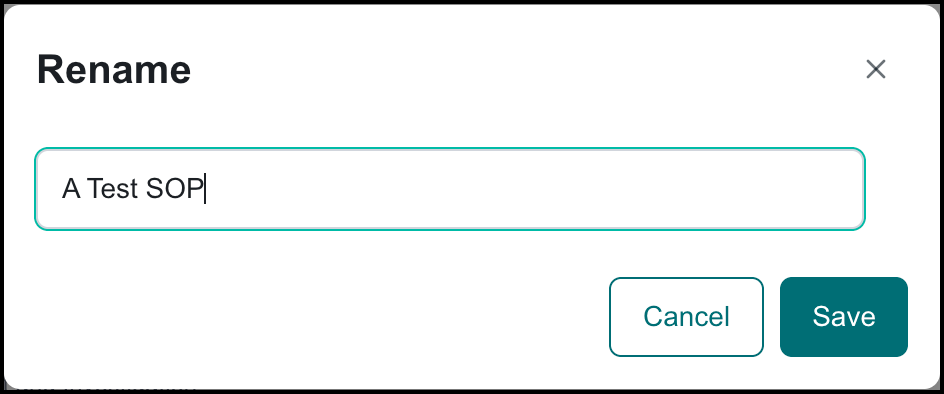
Enter the new name and click Save. The SOP is renamed.
Deleting SOPs
To delete an SOP:
Click the Ellipsis
icon for the SOP in the SOP Library.Select Delete.
The Delete SOP dialog appears.
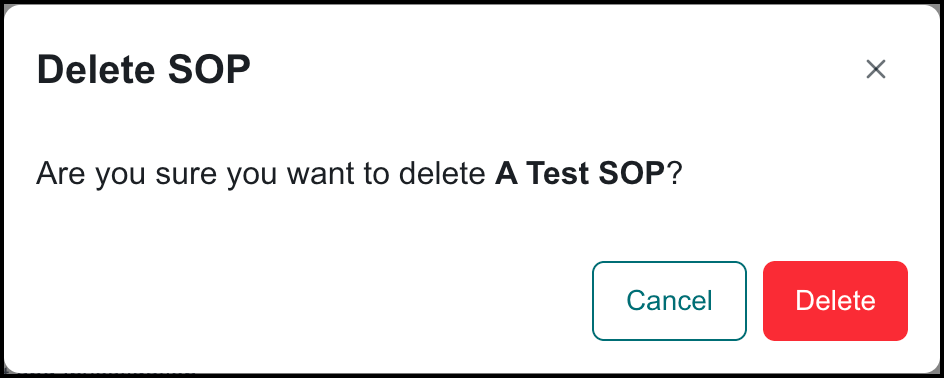
Click Delete. The SOP is deleted.
Exporting SOPs
You can export an SOP in PDF or Word format.
The Include Images and Include Flow Chart options apply only to Text View. Select Text View before configuring these options. Include Flow Chart means to include the Process Map as a graphic/flow chart in the SOP.
Select Text View.

Select whether to include reference images and the workflow diagram in the exported SOP.
To include reference images (where applicable) for each step in the SOP, enable Include Images.
To include the workflow diagram in the SOP, enable Include Flow Chart.
Click Export.
Select the format for the output.
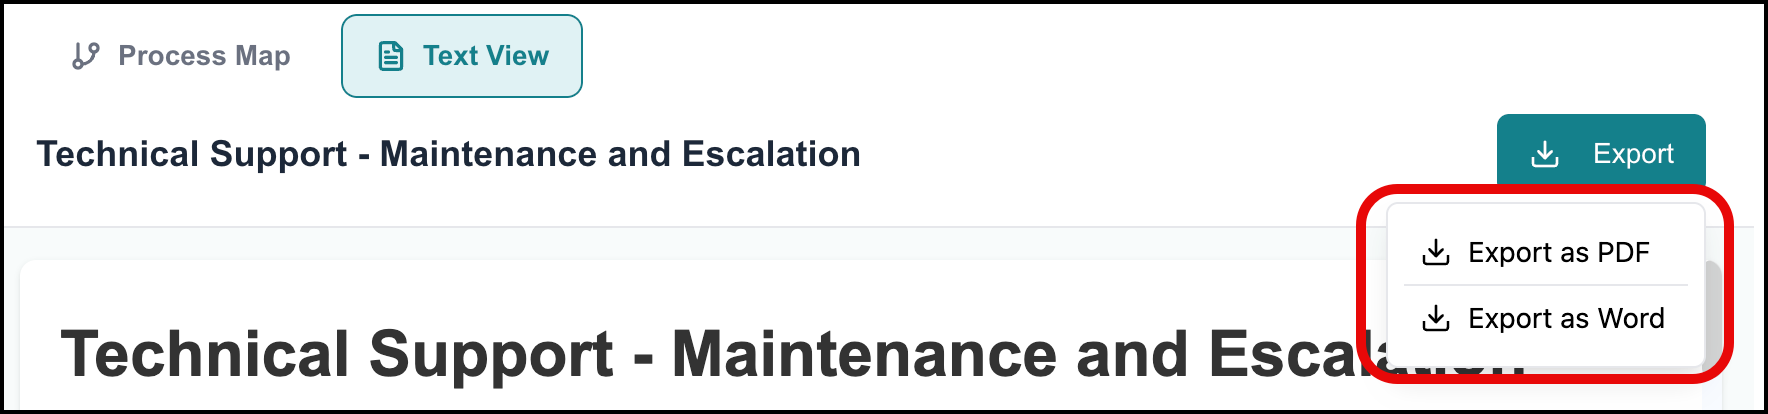
Your browser downloads the SOP file.
Connectors
The Connectors page lets you create and manage connectors, used to import source files (screen recordings recorded via Chronos, or other explainer videos, transcripts, and audio files) for your Process Intelligence deployment. The source files imported via the connectors are displayed on the Data View page.
Note
The connectors discussed here are specific to Process Intelligence and are not related to other Business AI Cloud connectors.
To access this page, click Connectors in the navigation panel.
The Connectors page opens, and shows your existing connectors:
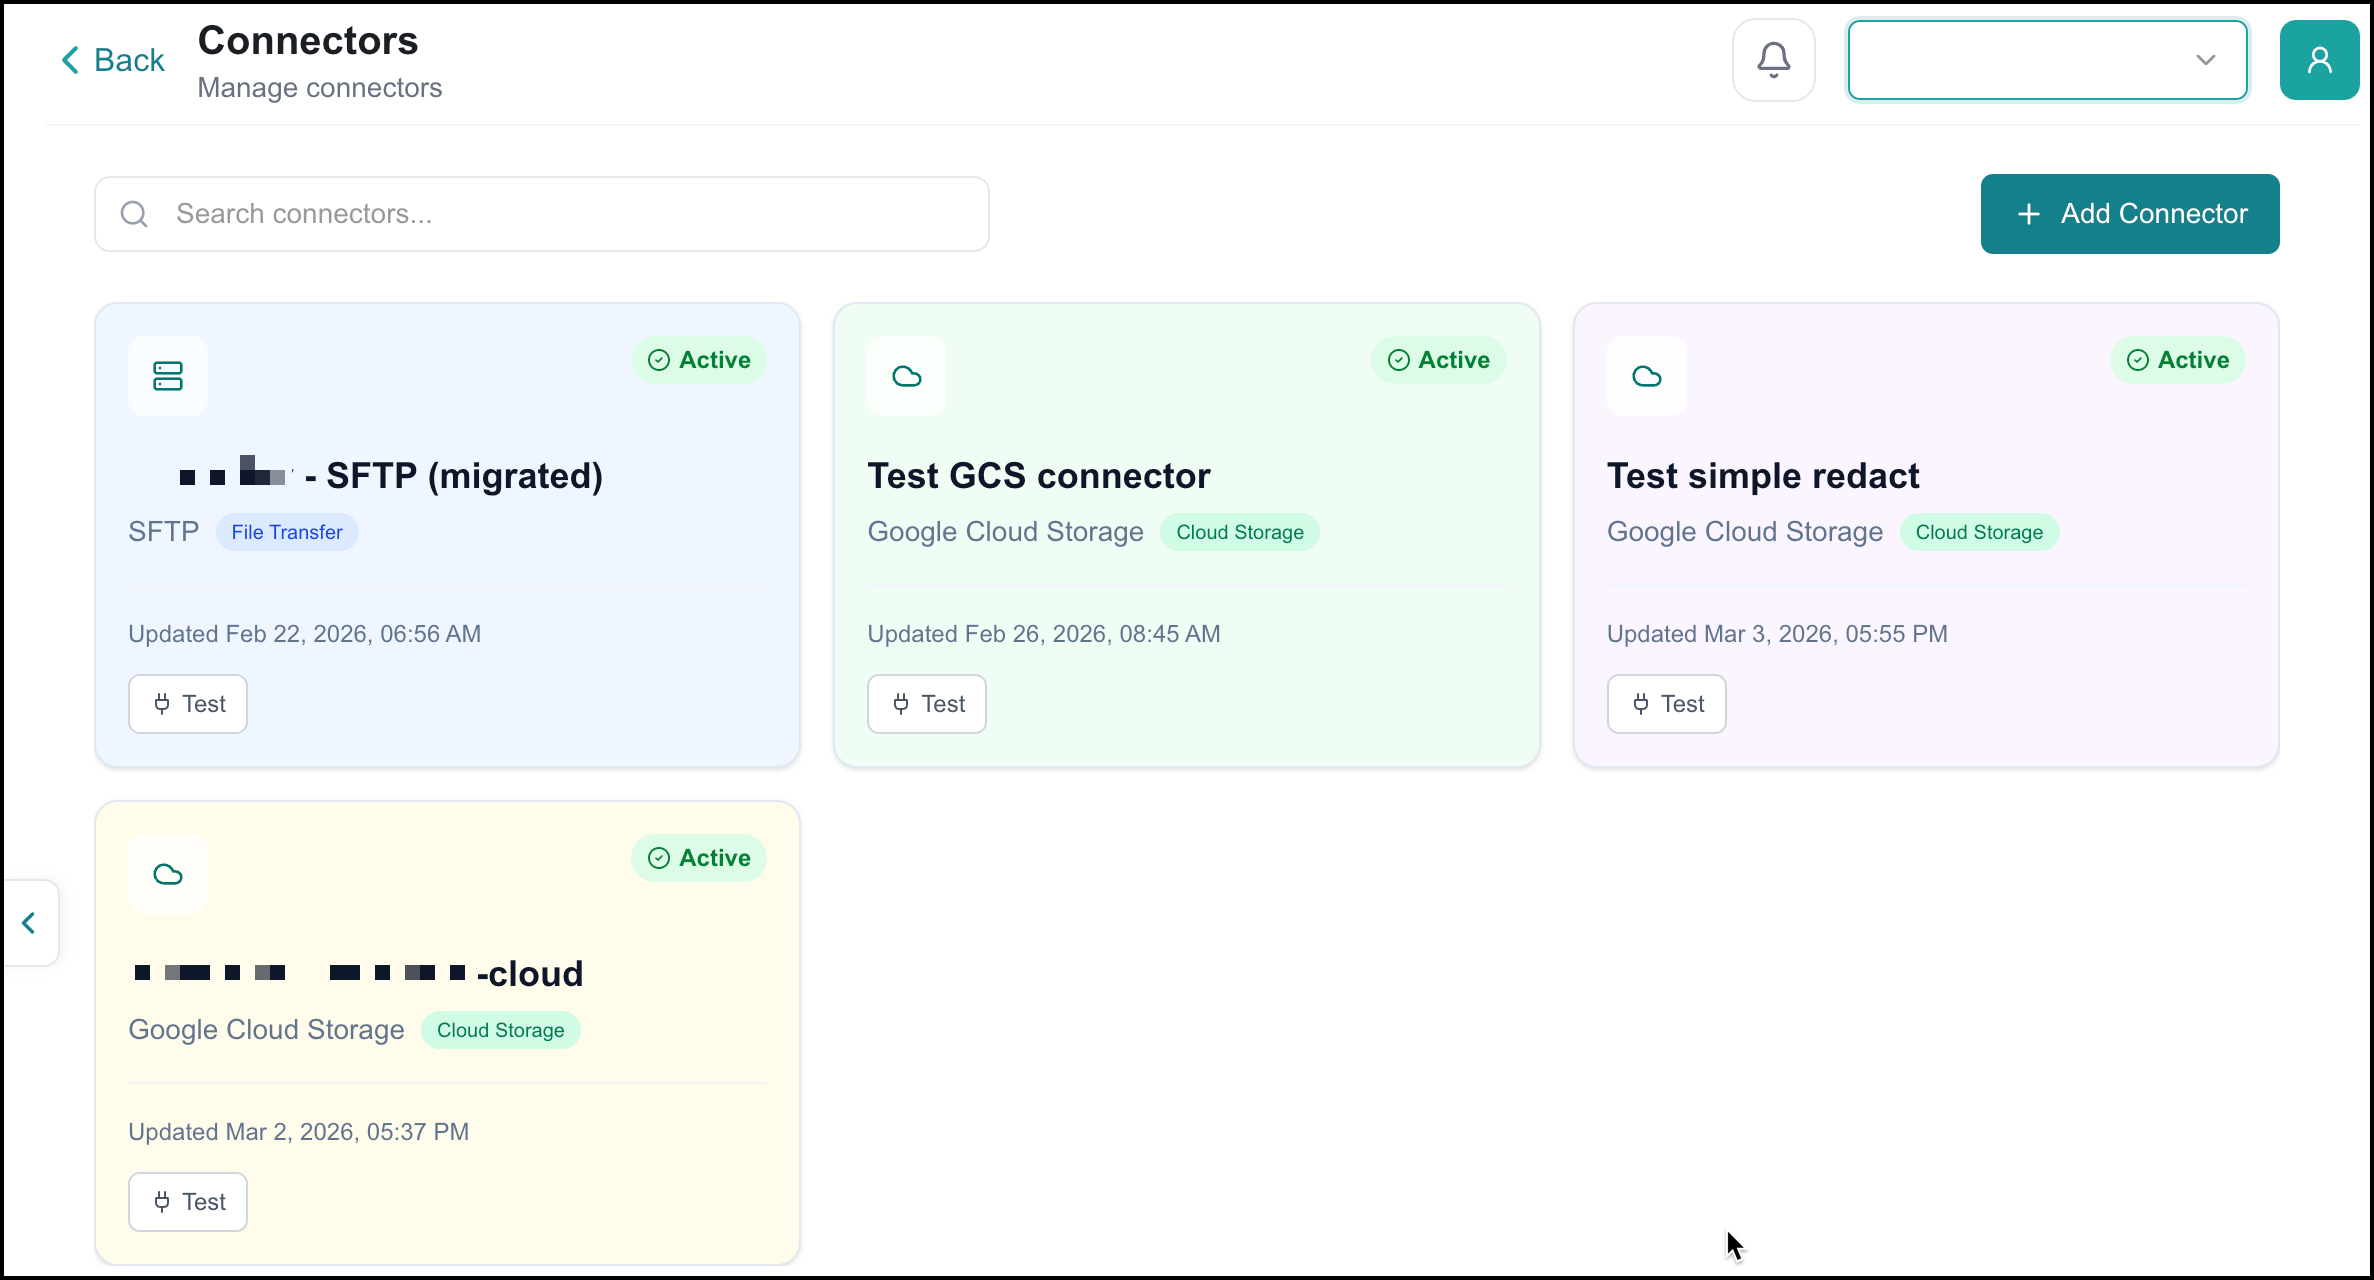
You can edit, test, delete, and create connectors. Use the Search field to refine the displayed list of connectors.
Chronos
Chronos (https://uniphore.github.io/chronos/index.html) is a recording tool used to capture, redact, and upload interactions from which business processes are identified, called screen recordings. Chronos is available as a Chrome extension and a desktop app with a lightweight installer and a fully offline installer with bundled dependencies.
Prerequisites
You need the following information (credentials, paths, etc.) when creating connectors.
Google Cloud Storage Connector Prerequisites
Have the following information ready:
Bucket name
Prefix (folder path to import from)
Source application (application that provides the data: Chronos desktop or Chrome plugin, available here (https://uniphore.github.io/chronos/index.html), or BYOD (Bring Your Own Data))
Service account JSON
You also need to decide whether to enable redaction and how information will be redacted: replaced with a Black Box, Blurred, or Pixelated.
SFTP Connector Prerequisites
Have the following information ready:
Host name
Port number
Remote path
Source application (application that provides the data: Chronos desktop or Chrome plugin, available here (https://uniphore.github.io/chronos/index.html) or BYOD (Bring Your Own Data))
SSH username and password
You also need to decide whether to enable redaction and how information will be redacted: replaced with a Black Box, Blurred, or Pixelated.
Creating a Connector
To create a connector, click Add Connector. The Add Connector panel opens.
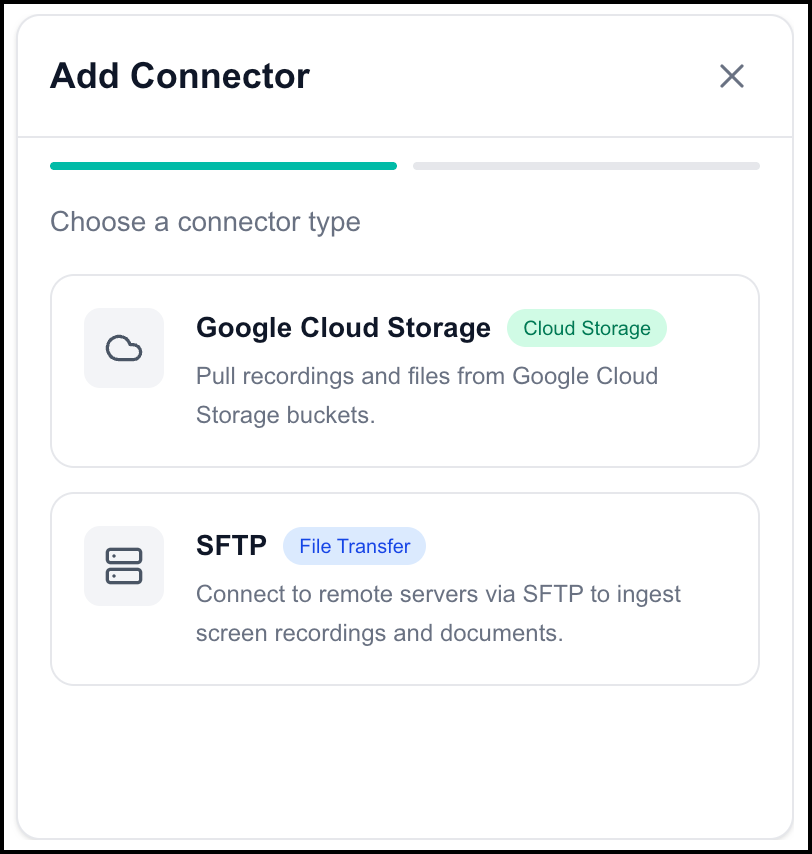 |
Click the type of connector you want to create.
Creating a Google Cloud Storage Connector
Click Google Cloud Storage. The Configure Google Cloud Storage panel opens.
Enter a name for the connection.
Provide the connection details, including the bucket name, prefix (folder path to import from), source application (Chronos desktop or Chrome plugin, available here (https://uniphore.github.io/chronos/index.html) or BYOD (Bring Your Own Data)), and service account JSON (see Prerequisites for details).
Configure redaction settings.
Click Create Connector. The connector is displayed in the list of existing connectors.
Creating an SFTP Connector
Click SFTP. The Configure SFTP panel opens.
Enter a name for the connection.
Provide the connection details, including the host name, port number, remote path, source application (Chronos desktop or Chrome plugin, available here (https://uniphore.github.io/chronos/index.html) or BYOD (Bring Your Own Data)), SSH username, and password. (see Prerequisites for details).
Configure redaction settings.
Click Create Connector. The connector is displayed in the list of existing connectors.
Editing a Connector
To edit a connector:
Click the connector in the list of connectors. The Edit Connector panel opens.
Make changes to the connector.
Test the changes by clicking Test.
Click Save.
Configuring Redaction Settings
Redaction settings control how Process Intelligence treats Personally Identifiable Information (PII) in the data artifacts as they are uploaded. You can specify whether to enable redaction and how information will be redacted: Replaced with a Black Box, Blurred, or Pixelated.
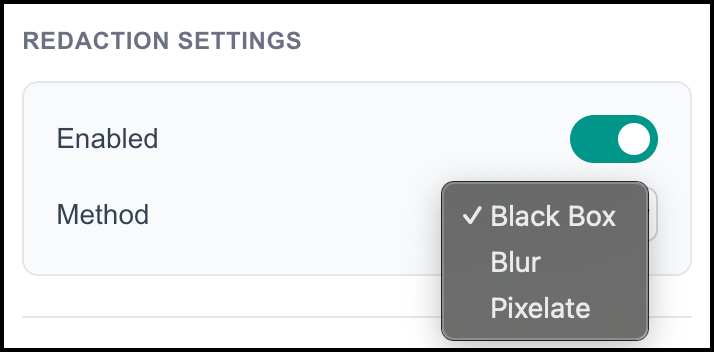 |
Testing a Connector
To test a connector:
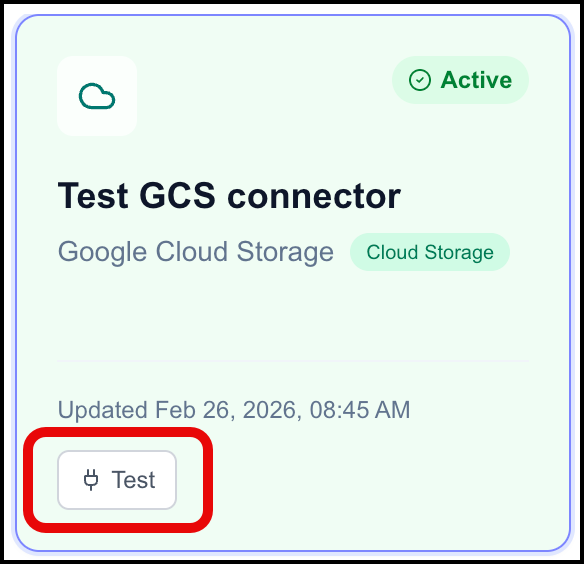
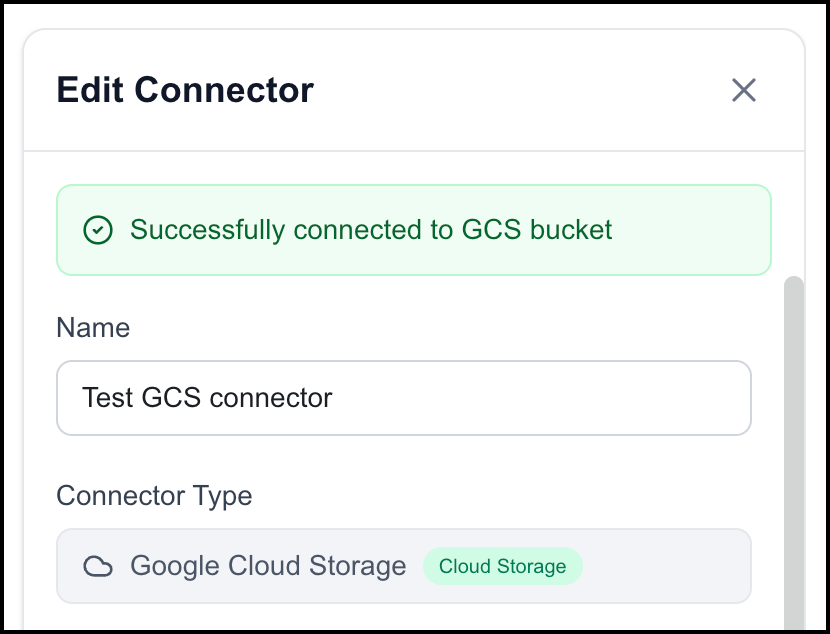
Click Test on the connector on the main Connectors page or in the Edit Connector panel.
The test result appears at the top of the Edit Connector panel.
Deleting a Connector
To delete a connector:
Click the connector to open it in the Edit Connector panel.
Click Delete at the bottom of the Edit Connector panel. Then click Delete to confirm the deletion.
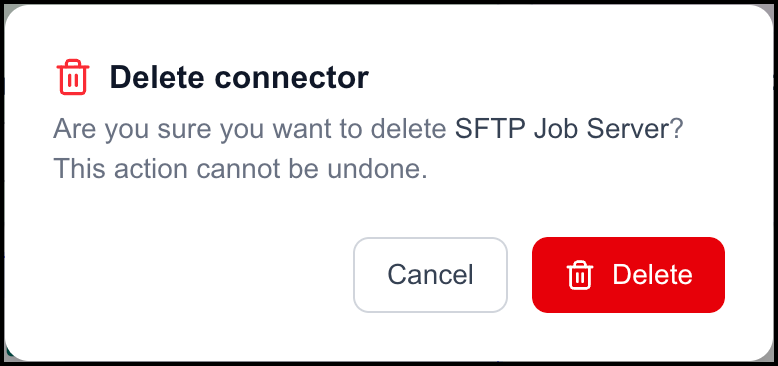
Deleting the connector removes it from the list of connectors.
Data View
Data View is where the raw evidence ingested into Process Intelligence is managed. Everything the system reasons over (recordings, audio, transcripts, logs, documents) lives here. It is also the entry point for triggering a process-discovery run after new evidence has been added. Depending on your level of access, you may also be able to upload additional, or delete existing, data files and instruct Process Intelligence to process uploaded files and Chronos recordings.
To access this page, click Data View in the navigation panel.
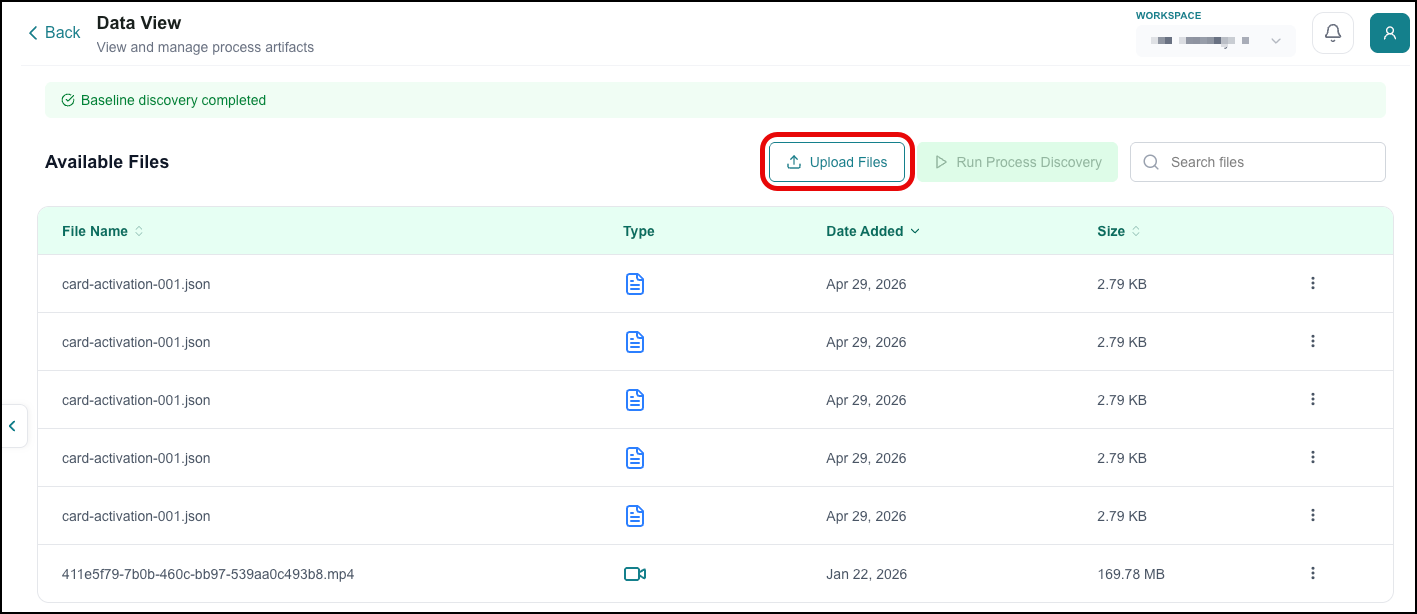
The Data View page opens, and shows a list of files with File Name, Type, Date Added, and Size.
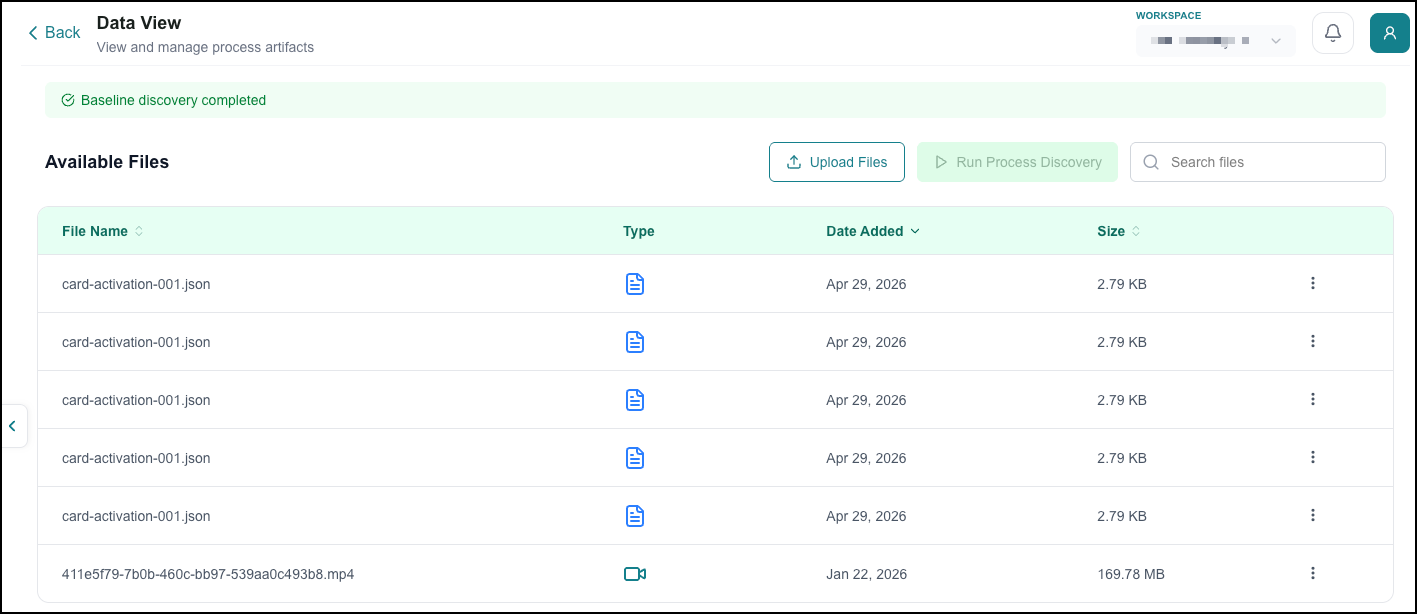
You can sort the list by column type, or search by filename to find a specific file or group of files.
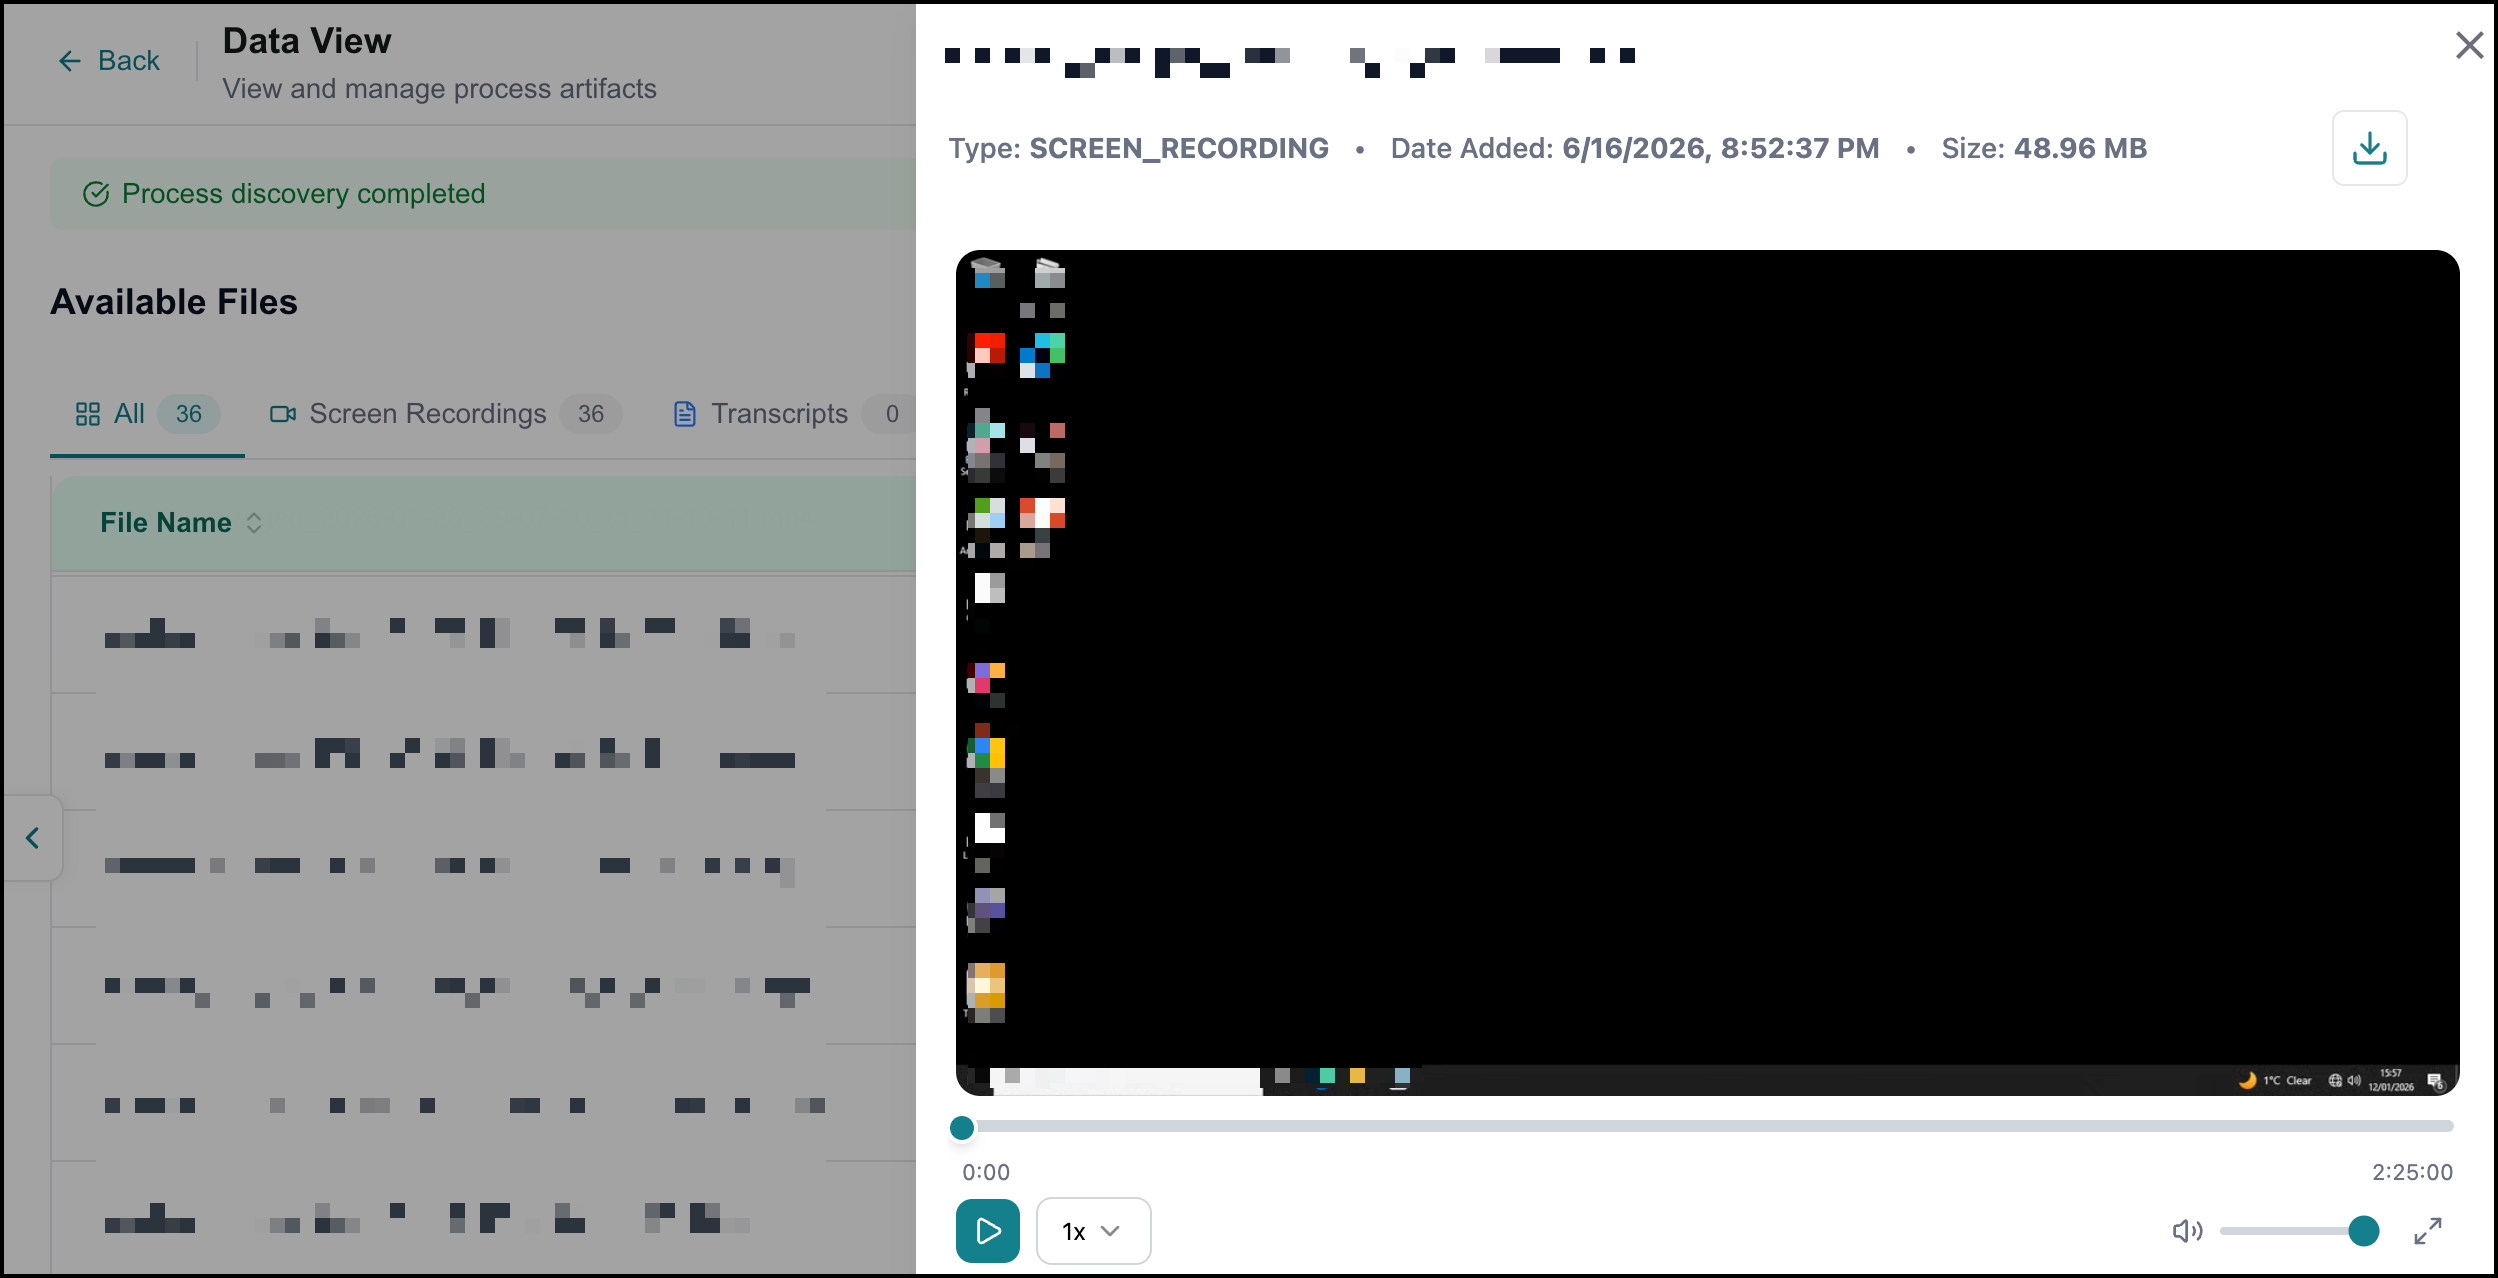
Viewing an Individual File
Click a file in the listing to open it in the viewer. Depending on the file type, you can view, read, or listen to it. You may also be able to download the file.
Uploading Additional Data Artifacts
You can manually upload additional data artifacts, such as audio, video (standalone and multi-part explainer videos), and transcript (JSON) files, by clicking Upload Files.
Before uploading data files to Process Intelligence, you should edit them to remove any PII. To have Process Intelligence redact PII on manually uploaded data artifacts, contact Uniphore.
Uploading Standalone Files
To upload additional artifacts:
Click Upload Files.
The Upload Files dialog opens.
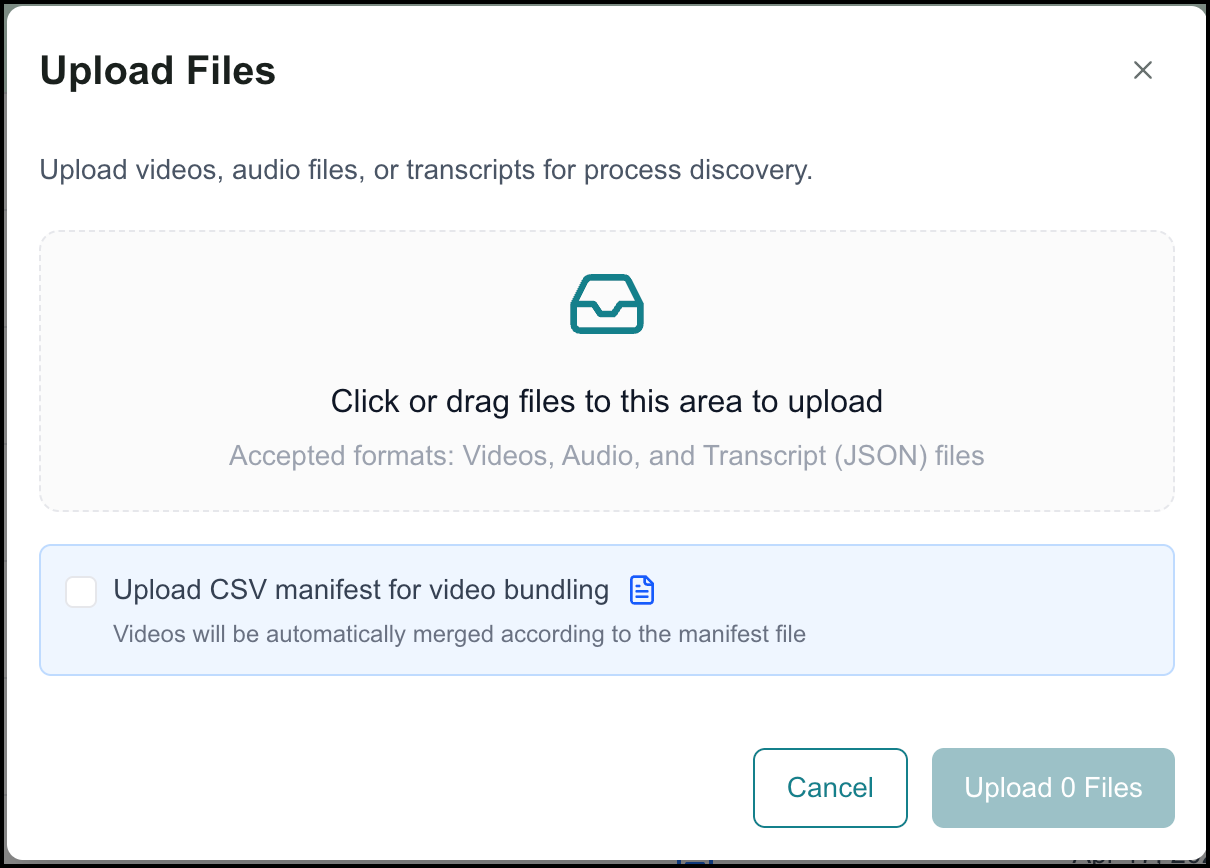
Click the dialog window and select the files to upload, or drag them into it.
Tip
You can provide additional context for process discovery by uploading PDFs together with source files.
Click Upload Files in the dialog window to upload the selected files, or click Cancel.
Once you have uploaded the files, you need to trigger the discovery process.
Uploading and Bundling Multiple-part Videos
Use this process when bundling multiple video segments into a single process artifact using a CSV manifest file. This is useful, as a single, very long video session recording could exceed bandwidth, network, or filesystem limits.
Before uploading, create your CSV manifest file. The manifest has the following required columns: bundle_id,file_name,sequence,agent_id.
Example manifest file:
bundle_id,file_name,sequence,agent_id
P001,video_part1.mp4,1,agent_1
P001,video_part2.mp4,2,agent_1
P002,video_v2.mp4,1,agent_2
Videos with the same bundle_id will be merged together.
To upload multi-part video files:
Click Upload Files.
The Upload Files dialog opens.
Click the dialog window and select the files to upload, or drag them into it.
Mark the Upload CSV manifest for video bundling checkbox:
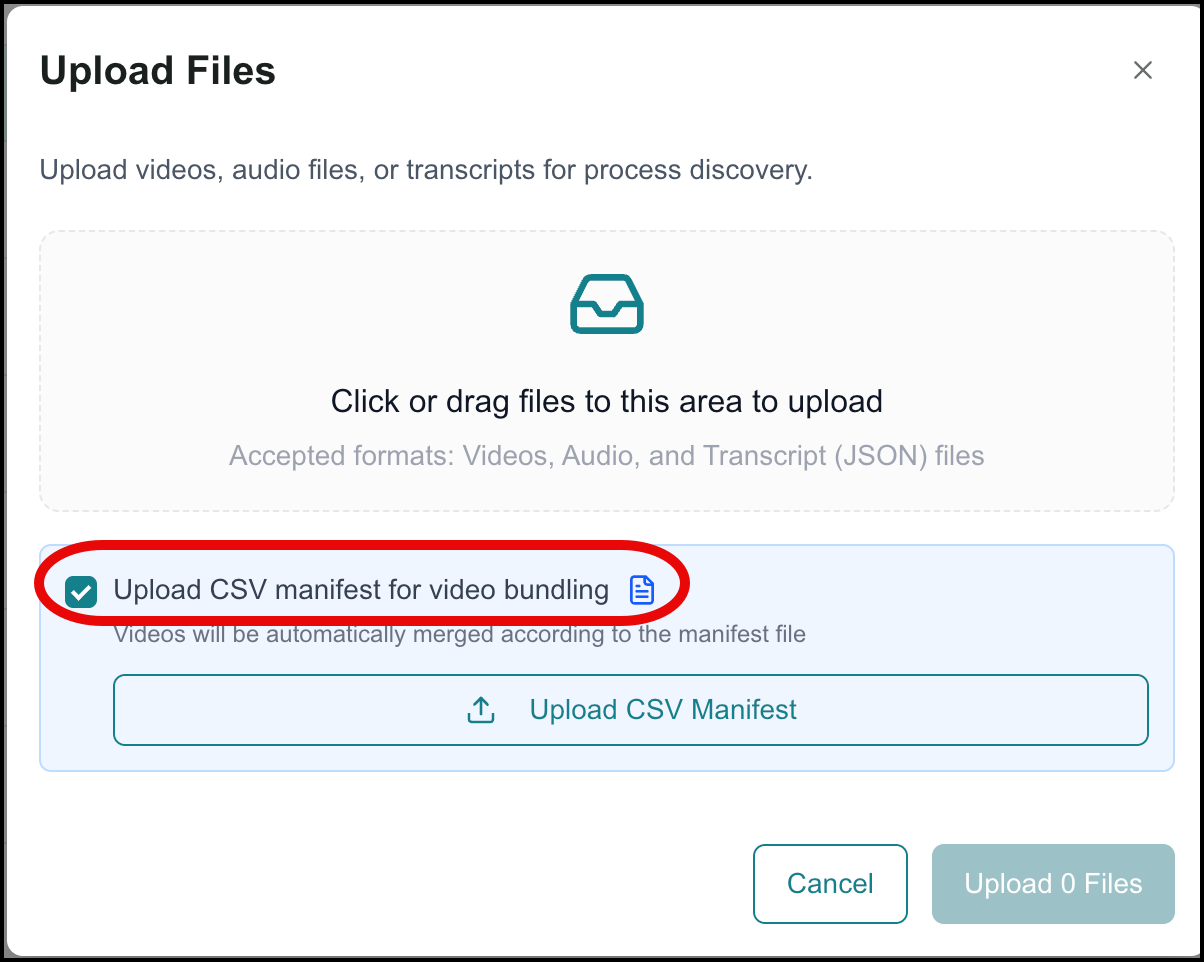
Click Upload CSV Manifest and select your .csv file. Click Open.
Click Upload Files in the dialog window to upload the selected files, or click Cancel.
Once you have uploaded the files, you need to trigger the discovery process.
Triggering the Discovery Process
Whenever new source files (video sessions captured by Chronos and manually uploaded data files) are available, you need to trigger discovery to identify new processes.
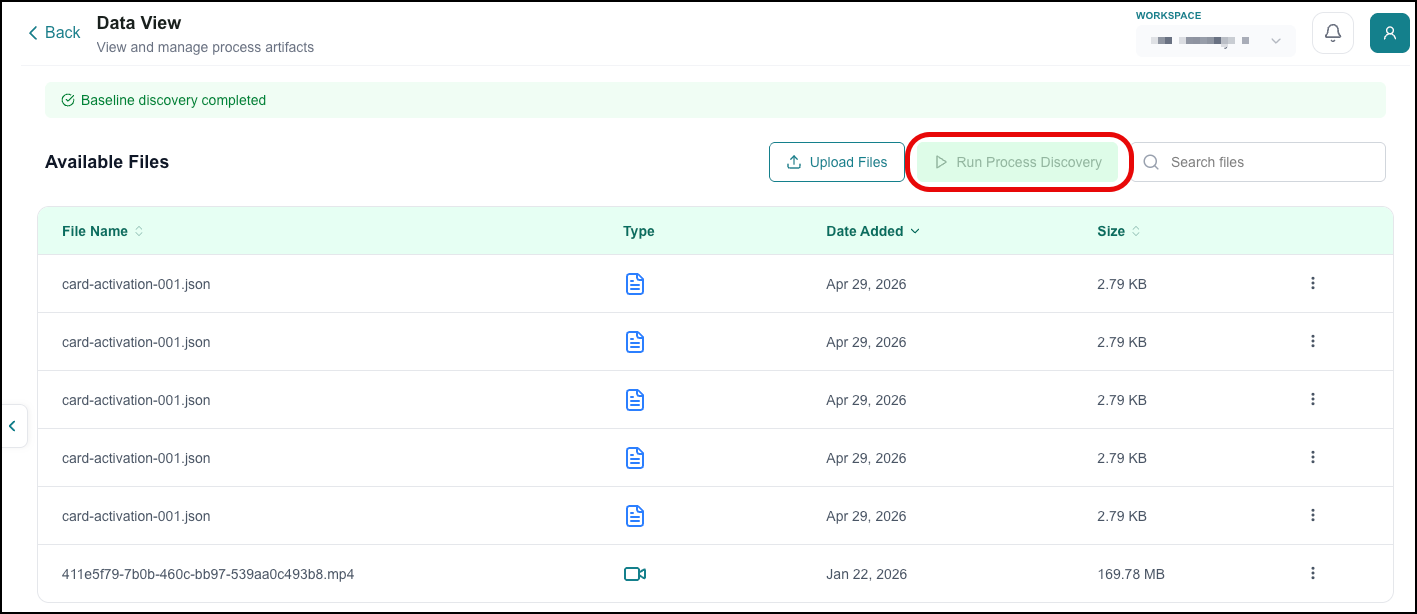
To trigger discovery on any newly available data files and Chronos sessions:
Click Run Process Discovery. Process Intelligence attempts discovery.
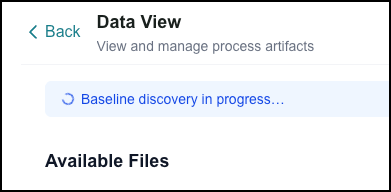
Process Intelligence displays a message indicating the result.
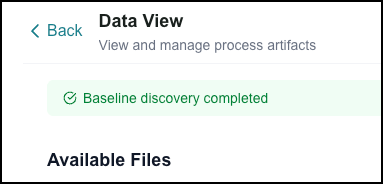
Go to the Cognitive Analysis page to view the discovered processes. Depending on the number of data files to process and the network load, the discovery process could take up to an hour.
Note
If an error occurs, retry triggering the discovery process. If the error persists, contact your Uniphore Process Intelligence support team.
Downloading Existing Data Files
You can download uploaded data files to your local computer by clicking the Download ( ) icon while viewing a file:
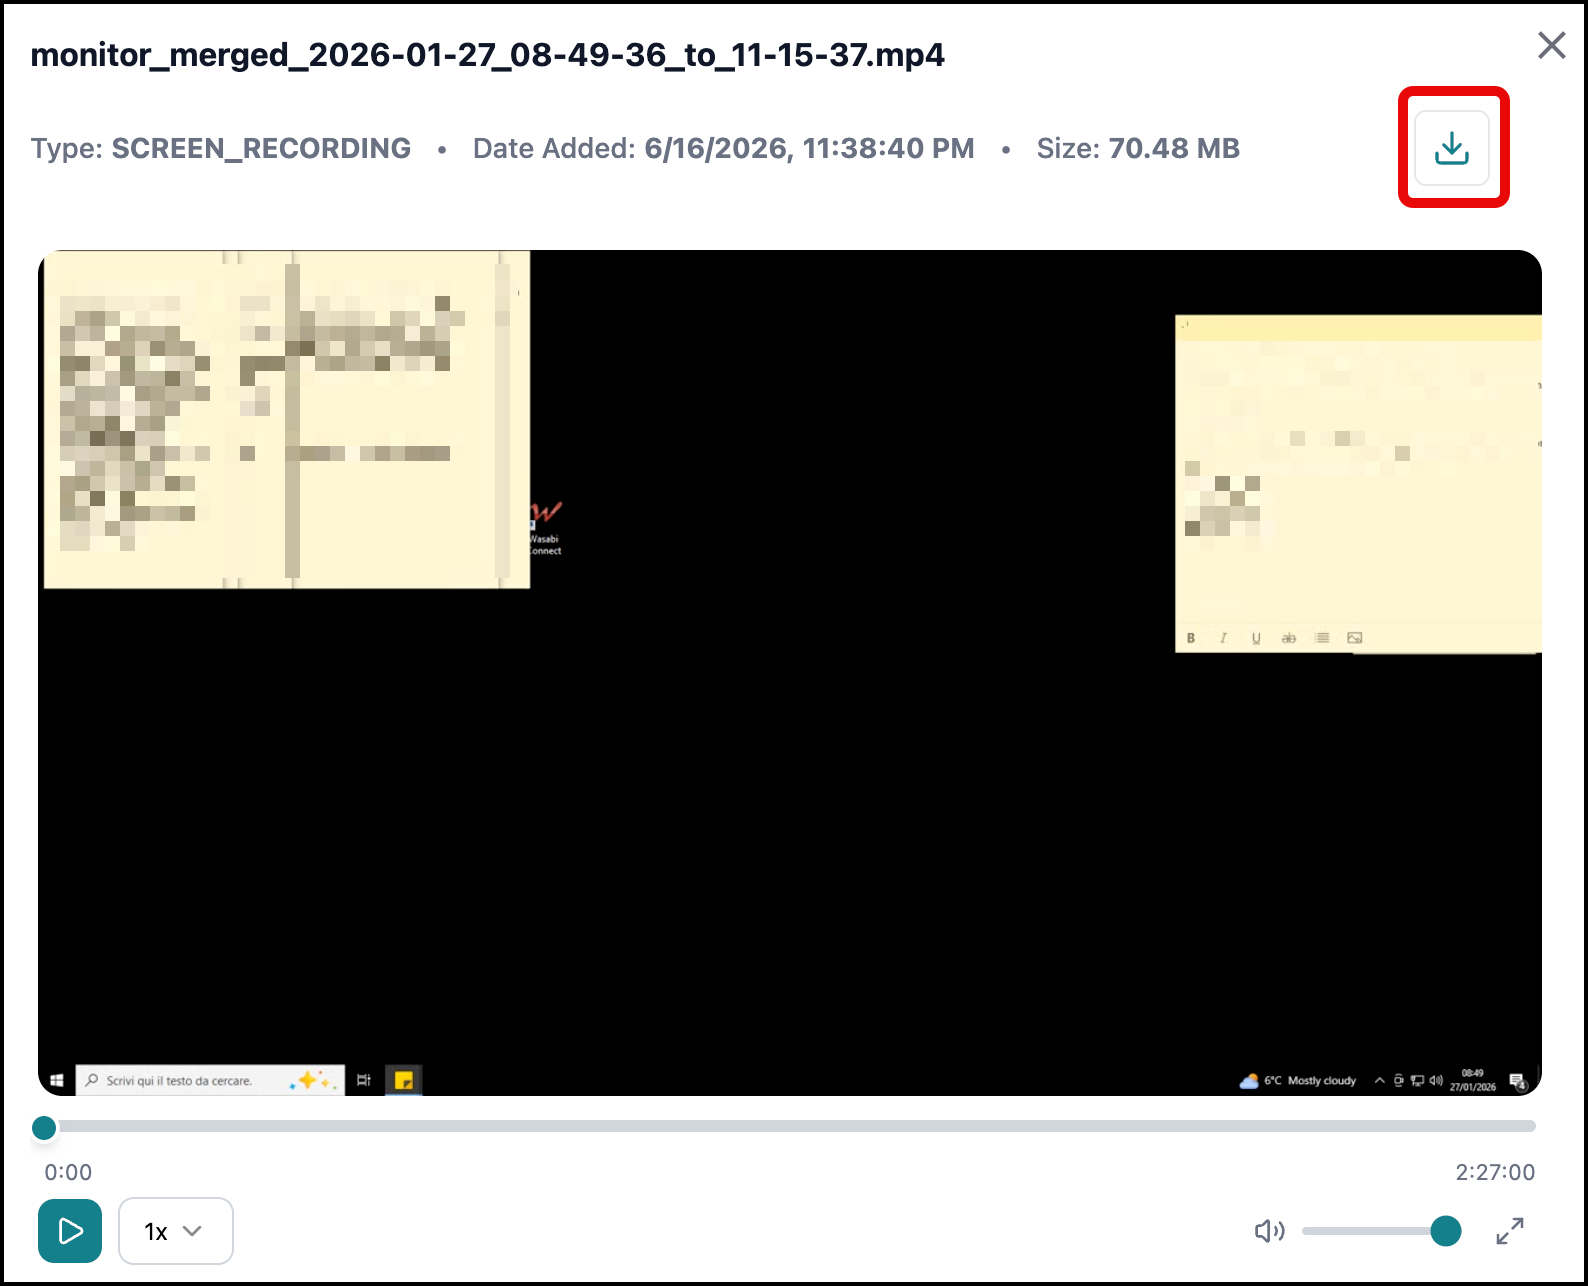 |
Deleting Data Files
Depending on your level of access, you may be able to delete existing data files.
To delete a data file:
On the Data View page, click the Ellipsis
icon for the item to remove.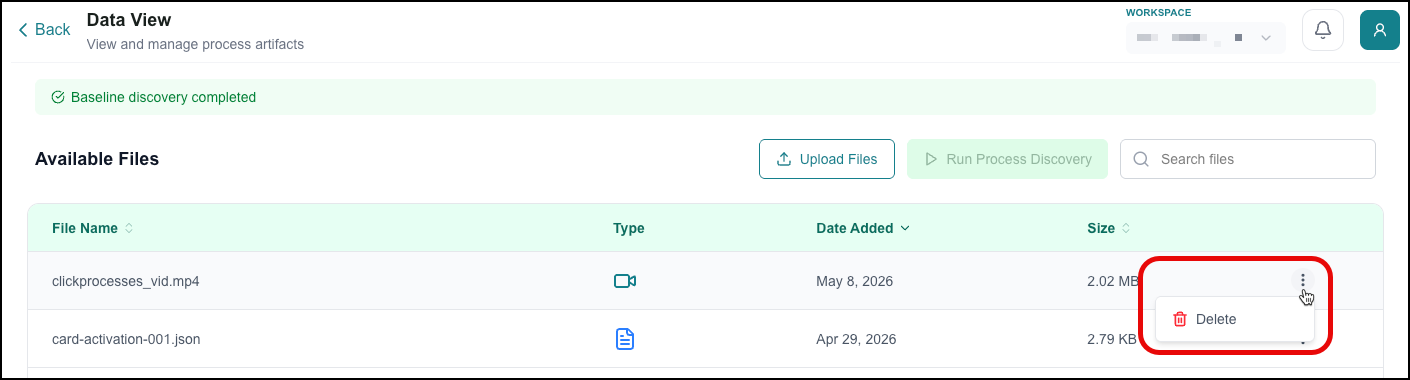
Click Delete. Next, click Delete in the confirmation dialog:
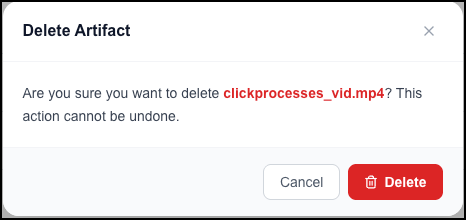
The data file is deleted.
User Management
The User Management page lets you create and manage users.
To access this page, click User Management in the navigation panel.
The User Management page opens and displays a list of the users in the system.
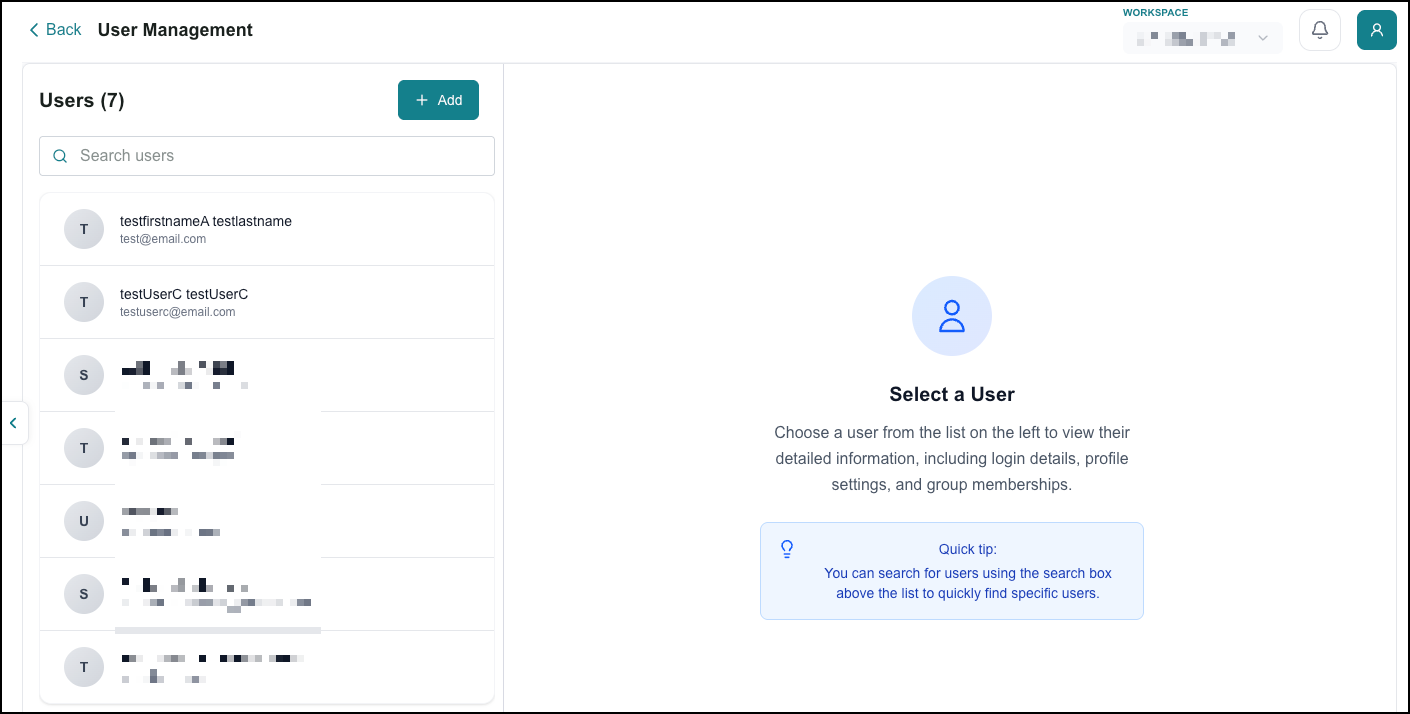
Users are assigned roles: Admin or User. A user's role determines that user's access to Process Intelligence functions. You can create or edit users. Use the Search field to refine the list of displayed users.
Roles and Permissions
Here is a list of permissions by role. Administrator users have all of the User permissions as well.
Role | Permission |
|---|---|
Administrator | Create Workspace |
Administrator | User Management |
Administrator | Run Sync Connection |
Administrator | Create/Edit/Delete Connector |
Administrator | Run Discovery |
User | Test Connection |
User | Edit SOP Map |
User | Create/Rename/Delete SOP |
User | Upload/Delete Data |
Creating Users
Limited to Admin users.
To create a user:
Click Add.
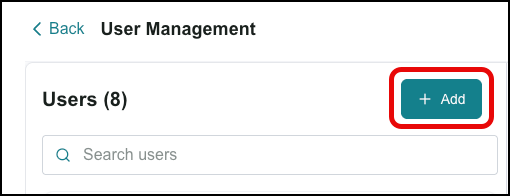
The Add User dialog opens.
Enter the user's name, email address, and role.
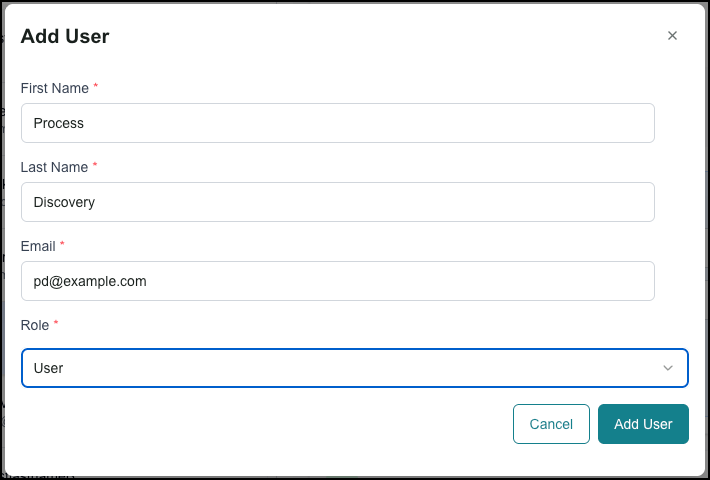
Click Add User.
The user is created.
Editing Users
Limited to Admin users.
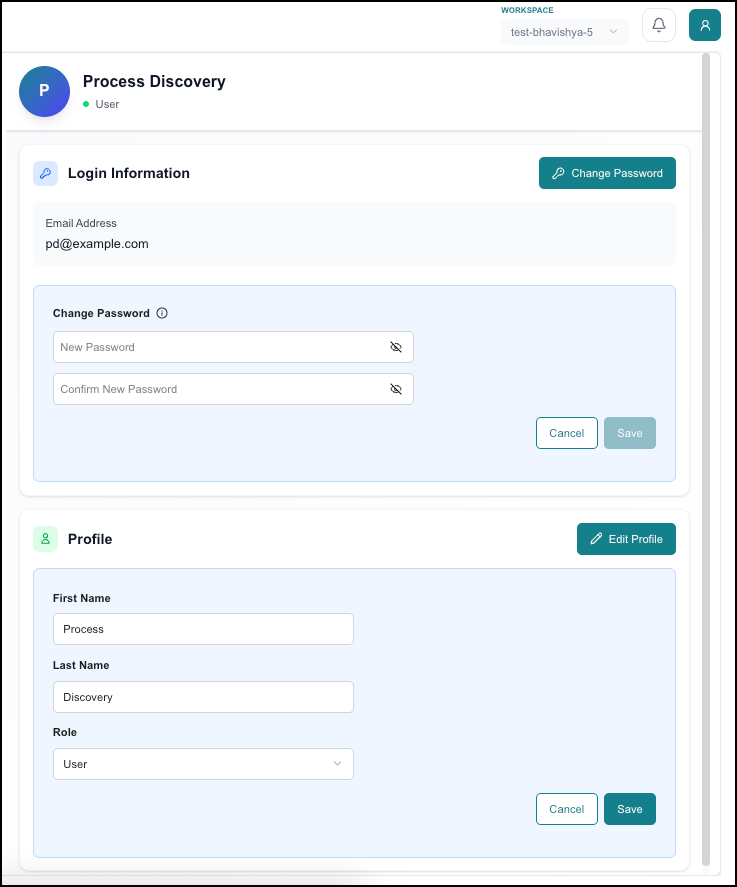
When editing a user, you can change the user's password, name, or role. Click a user to edit it. Then click Save to save the changes.
 |
Explainer Video Recording Best Practices
This section describes how to record a screen-recording video so that the Process Discovery algorithm can extract the highest-quality process understanding from it. Following these practices will materially improve the completeness and accuracy of the discovered process, which, in turn, powers downstream activities such as SOP generation, process-improvement analysis, and automation opportunity assessment.
The richer the captured process is, the more the platform can do with it. Record the video as if you were explaining the process to someone who has never performed it before. That level of detail is what makes all of these downstream uses possible.
Plan the Recording Before You Press Record
To reduce the number of re-takes:
Pick exactly one business process per video. Do not bundle multiple unrelated processes into a single recording. Each video produces one process.
Cover the full end-to-end execution. Begin with how the work arrives (ticket, email, scheduled job, customer call) and end with the final resolution/handoff/system update.
Decide which path you will execute live. This is your "happy path." Any alternate paths (exceptions, denials, escalations, retries) you cannot execute live should still be described verbally (see Cover Decision Points and Branches).
Use a representative test record with realistic data so screens look like real production work. Avoid empty or placeholder records that produce blank screens.
Redact or use test data for anything sensitive (PII, payment details, customer identifiers). The video and any screenshots extracted from it will be stored in our system.
Start with a Brief Verbal Introduction
Before you begin clicking, take 15–30 seconds to say what this process is. Something like "This is the monthly journal-entry close — I'm in Oracle EBS, and the goal is to post and approve the close for each ledger".
You don't need to recite a checklist. The algorithm picks up context from whatever you say naturally: process name, the systems involved, the expected outcome, anything not obvious from the screen. Just frame the recording so the rest of it makes sense.
Narrate as You Work
Talking through what you're doing, even loosely, meaningfully improves the output. You do not need to provide a play-by-play of every click; the algorithm can infer most mechanical actions from the screen on its own. What it cannot infer is information in your head: why a step matters, the business reason for a choice, or context that isn't visible on screen.
A few habits that go a long way (when they fit naturally):
A short note before a meaningful action ("now I'll open the pre-close report") is useful when the click target is not obvious.
Briefly explain why a step exists, especially for non-obvious ones.
Calling out applications, screens, or fields by their actual names when it's easier than expecting the algorithm to read them off the UI.
Mentioning any rule or threshold you are applying as you apply it (see Mention Business Rules When They Apply).
It is okay to stay quiet through a stretch of routine UI work; the algorithm will still capture the steps. The narration adds context that the screen alone cannot provide.
Cover Decision Points and Branches
It is important to note that business processes are graphs, not straight lines. The algorithm can only model the branches it has some signal about. The path you actually click is captured either way; alternate paths only show up if you describe them.
When you reach a decision point, the most useful thing you can do is briefly state what you are evaluating and the alternatives. For example: "I'm checking whether the variance is over $500. If it is, I file a manual adjustment; if not, I move on to the next ledger." Then continue and perform whichever path applies.
Pausing briefly on the screen you are evaluating helps too. It gives the algorithm a clean moment to anchor the decision step on. But you do not need a strict procedure; a single sentence covering the criteria and the alternatives is usually enough.
Ideally, you can demonstrate a non-trivial alternate path live (e.g., an exception, escalation, or retry). If not, a sentence describing what would have happened on that path allows the algorithm to represent it as a synthetic instance.
Mention Business Rules When They Apply
Business rules are the durable knowledge that defines how the process is supposed to work: thresholds, validations, compliance constraints, and SLAs. They enforce SOP correctness, surface governance requirements, and define what automation logic is allowed to do.
The algorithm can pick up rules that are visible on screen (error messages, threshold prompts, validation banners), but rules that live only in your head, such as "variances over $500 need manager approval", or "we never refund a pending transaction", only get captured if you mention them. So when a rule influences something you're doing, a quick callout helps.
Common categories worth flagging when relevant:
Validations: "Email must be in a valid format."
Thresholds: "Orders over $500 require manager approval."
Constraints: "Maximum 3 retry attempts before escalation."
Compliance/authorization: "Only supervisors can override pricing," "Customer identity must be verified before account changes."
SLAs: "Response must be sent within 24 hours."
Sequencing: "Payment must be confirmed before the shipping label is generated."
Global/cross-cutting: "All interactions must be logged," "System session times out after 30 minutes."
The list above is not exhaustive. Call out whatever rules genuinely apply.
Show Loops and Iterations When You Can
Many processes repeat steps, such as closing ledgers one at a time, working through a queue of tickets, and retrying after a validation failure.
Providing two iterations is ideal because it makes the loop pattern unambiguous. But one iteration plus a quick "and I'd repeat this for each remaining item" also works. The algorithm can recognize iteration from your description.
A short note on the loop's check helps: "Now I check whether there are more ledgers. If yes, I go back; if not, I move on." This is the same habit as Cover Decision Points and Branches, just for loops.
Mention the exit condition when it is not obvious from the screen.
Call Out Verification and Quality Gates
Some steps are checks rather than actions: verifying row counts match, confirming debits and credits net to zero, reconciling totals, and comparing IDs across systems. These look similar to ordinary review screens; however, they play a different role: they are the points where the process formally gates on data integrity.
A quick verbal callout, such as: "I'm checking that debits and credits net to zero before posting", helps the algorithm represent these as their own verification steps rather than folding them into the surrounding action. That distinction matters downstream for audit, training, and any automation that needs to preserve the gate.
Capture-Quality Best Practices (for Good Screenshots)
The algorithm picks "representative timestamps" for each step and extracts the corresponding frames as screenshots that visually document each step. These are used in generated SOPs, in process visualizations, and as ground-truth references when reviewing automation candidates. Frames are picked from your video, so the video must contain good frames.
Do:
Record at high enough resolution that on-screen text is readable (1080p / 1920×1080 minimum; 1440p preferred).
Keep the application window maximized and fully visible.
Make sure the UI is fully rendered when you pause: no spinners, blank panels, or half-loaded tables.
Avoid:
Webcam/face-cam overlays that cover the working area. If you must include your face, pin it to a small corner and ensure it never overlaps the application content. The algorithm is instructed to skip frames where the face dominates, so fewer such frames means better screenshots.
Rapid window switching. Stay on each window long enough for the algorithm to anchor the step there.
Length and Format
Preferred length: 15–55 minutes per process. Videos under 55 minutes are processed in a single pass, resulting in the most coherent output.
Format: Standard screen-recording formats are accepted (MP4 / MOV / WebM). MP4 with H.264 video and AAC audio is the safest choice.
Frame rate: 24–30 fps is sufficient. Higher rates only inflate file size.
Recording a Long Process in Multiple Parts
If the full process is too long to record comfortably in one sitting, or you need to stop and resume (across breaks, days, or shifts), record it as multiple part-files. Our solution joins the parts in the correct order and processes them into a single video, provided you specify the correct order in a manifest file.
When to use multiple part-files;
The full process realistically runs longer than ~1 hour.
You need to pause for an overnight job, an SLA window, or a colleague's handoff before continuing.
You prefer to record several focused 20 to 40-minute parts, rather than one fragile 90-minute take.
How to record the parts:
Use a consistent process name across all parts, in both the file names and (in Part 1) the verbal introduction.
Do not split mid-step. Stop at a clean step boundary, not in the middle of a form submission, a decision, or a loop iteration.
Do not repeat content across parts. Parts are joined end-to-end, so any overlap will appear twice in the merged video. Pick up cleanly where the previous part left off.
Keep applications, screen layouts, and test records consistent across parts. Do not switch test customers or accounts mid-process.
Only the first part needs the verbal introduction described in Start with a Brief Verbal Introduction. Subsequent parts can start directly with the next step — no recap or outro is required.
Each individual part can be recorded the same way as a single-take video. The practices in the rest of this guide apply to each part.
CSV Manifest (Optional)
To group multiple part-files into a single recording, upload an optional CSV manifest alongside the videos. Each row maps one video file to a bundle_id (the group key), a sequence (the merge order within that bundle), and the agent_id of the person performing the process. All files that share a bundle_id are concatenated in sequence order before processing, so a process split across several recordings is treated as a single end-to-end video.
Required columns: bundle_id , file_name , sequence , agent_id
Example:
bundle_id,file_name,sequence,agent_id
P001,video_part1.mp4,1,agent_1
P001,video_part2.mp4,2,agent_1
P002,video_v2.mp4,1,agent_2
In the example above, P001 is a two-part recording (joined in order: part 1 then part 2), while P002 is a single-file recording. If you upload only single-file recordings, the manifest is not needed.
End the Recording Cleanly
Narrate the outcome of the run: "The journal has been posted and approved. The close is complete for this ledger."
Briefly summarize what came next or what would happen on a different outcome (escalation path, follow-up, etc.).
Stop recording after the final screen has finished rendering. Do not cut off mid-action.
Checklists
Pre-Flight Checklist
Select one end-to-end process.
Prepare test data and non-sensitive records.
Silence notifications and other system sounds.
Test the microphone and find a quiet place to record.
Maximize the application window.
Pin the webcam (if used) to a corner that does not overlap content.
Set the screen recorder to at least 1080p.
Know the happy path and descriptions for alternate paths.
Know the business rules, thresholds, and SLAs you will mention.
Post-Recording Checklist
Verify audio quality throughout the recording.
Ensure you have included a brief verbal introduction to frame the process.
Confirm that decision points have a sentence covering the criteria and the alternatives (live demo of alternatives is a bonus, not required).
Confirm that major business rules that are not visible on the screen are documented.
Check that loops were either demonstrated or briefly described.
Ensure that no sensitive data (PII, secrets, payment data, etc.) is on screen.
Verify the final outcome was narrated.
For multiple-part videos, ensure that the parts are split at clean step boundaries with no repeated content across boundaries, and a CSV manifest is provided.
Concepts
Process Identification and Modeling
Process Intelligence does not rely on manually documented workflows. Instead, it derives processes automatically by analyzing recorded interactions: screen recordings, audio, transcripts, and system logs. The result is a data-driven model of how work actually happens, rather than how it is assumed or intended to happen. This distinction, observed reality versus documented assumption, is central to the value Process Intelligence provides.
The Occurrence-to-Process Hierarchy
Process Intelligence is built on a two-level data model. At the bottom level are occurrences: individual recorded instances of a task being performed. At the top level are processes: aggregated models built from many occurrences. Understanding this hierarchy is essential: when you view a process in Process Explorer, you are seeing a composite picture derived from all recorded occurrences, not a single instance. When you want to examine a specific interaction, go to Process Occurrences.
Paths and Variants
Process Intelligence identifies all the distinct ways a process is actually executed and represents each as a path. Paths may reflect different outcomes, escalation routes, workarounds, or agent-specific behaviors. The All Paths view combines all variants into a single map to show the full range of possible execution sequences. Recognizing and analyzing path variation is foundational to understanding process health and identifying improvement opportunities.
Friction as a Measurable Quantity
Rather than treating inefficiency as a qualitative observation, Process Intelligence quantifies it using the Friction Index: a 0–10 score calculated from signals such as system switching, repeated loops, and silence. This makes operational drag comparable across processes, agents, and time periods. A process with a Friction Index of 8 can be directly compared to one with a Friction Index of 3, enabling prioritization of improvement efforts based on data rather than intuition.
Lifecycle: From Raw Evidence to Optimization
Process Intelligence is designed around a workflow that moves from raw evidence to optimization:

Ingest - Connectors pull raw evidence into the workspace on a schedule or on demand.
Discover - The discovery pipeline extracts steps from the evidence, groups recurring patterns into processes, and identifies variants within each process.
Analyze - Cognitive Analysis and Variant Analysis surface where the process is healthy, where it is not, and why.
Optimize - SOP Studio captures the target behavior. Process The Optimization and Automation Journey turns diagnosis into an action plan. ROI Analysis quantifies the value of each action.
Iterate - As more evidence arrives, the discovered process refines and the analysis updates. The same loop is run continuously rather than as a one-time audit.
Each stage builds on the previous one. The workflow is designed to be repeatable. As new recordings are continuously uploaded, the process models stay up to date, and the cycle begins again.
Aggregate vs. Instance Analysis
Process Intelligence supports analysis at two different levels of granularity, and choosing the right level depends on the question being asked. Aggregate analysis, available through Process Explorer and Variant Analysis, answers questions about patterns across many interactions: What is the most common path? Where do bottlenecks typically occur? Instance analysis, available through Process Occurrences and the Occurrence Map, answers questions about a specific interaction: What exactly happened during this call? What anomalies were detected? Both levels are necessary for a complete understanding of process performance.
Variant Comparison and Root Cause Analysis
A key analytical capability in Process Intelligence is the ability to compare paths directly. Use Variant Analysis to place two or more paths side by side, apply filters (such as agent or AHT range), and view metrics for each. Combined with the AI-generated Root Cause Analysis insights, this enables you to move beyond identifying that a problem exists to understanding why it exists, and what to do about it.
SOPs as Living Documents
In Process Intelligence, SOPs are not static documents that you write once and file away. They are generated directly from observed process data and can be regenerated or updated as processes evolve. Use the SOP Editor to configure scope (e.g., top 80% of paths vs. all edge cases), apply filters, and edit the resulting process map before exporting. This means SOPs reflect actual operational behavior rather than idealized descriptions, and can be kept current as that behavior changes.
PII Redaction and Data Privacy
Because Process Intelligence ingests recordings of real agent interactions, it necessarily handles sensitive data. PII redaction is built into the ingestion pipeline: personal information is removed from files as they are uploaded, before they are stored or analyzed. Redaction is configurable at the connector level, allowing organizations to control the method used (Black Box, Blurred, or Pixelated). This ensures that the analytical value of interaction data can be captured without retaining personally identifiable details.
Source Data Transparency
Process Intelligence maintains a direct link between its analytical outputs and the underlying source material. In Process Explorer, you can click any step in a process flow to access the original video, transcript, or audio used by Process Discovery to build that step. This transparency allows you to validate the accuracy of process models, understand the context behind specific steps or decisions, and build confidence in the data driving optimization recommendations.
Data Ingestion and Storage
Connectors define how Chronos screen recordings and other explainer videos, transcripts, and audio files are ingested into Process Intelligence, specifying where files originate (Google Cloud Storage or SFTP), how they are accessed, and how PII within them is redacted on upload. Once uploaded, files are stored within Process Intelligence and are visible on the Data View page. Process Intelligence supports multiple customers through a multi-tenant architecture, meaning each organization's data is stored and accessible only within their own environment.
Glossary for Process Intelligence
Name | Description |
|---|---|
Average Handle Time (AHT) | The average total time taken to complete a process from start to finish, including hold times. AHT is displayed as a key metric throughout Process Intelligence and is used to compare path performance and identify inefficiencies. |
Chronos | The Uniphore desktop application and Chrome extension used to record agent interactions. Chronos recordings are uploaded to Process Intelligence and serve as the primary source data for process identification and ongoing validation of SOP adherence. |
Friction Index | A 0–10 score that quantifies operational drag within a process, based on factors such as system switching, repeated loops, and silence. Higher scores indicate greater inefficiency. Displayed at both the project level (Cognitive Analysis) and the individual process level (Process Explorer). |
Occurrence | A single recorded instance of a process being executed. Occurrences are the raw data units that Process Intelligence aggregates to identify and model processes. Each occurrence captures the agent involved, the date, highlights, and associated recordings, transcripts, and logs. |
Occurrence Flow | A visual representation of the steps taken during a single occurrence. Displayed on the Occurrence Map, it is synchronized with the Timeline, video, and transcript. |
Occurrence Map | The detailed view for an individual occurrence. It displays all data associated with that interaction: the Timeline, Occurrence Flow, metadata, session information, turnaround time, anomalies detected, and insights. |
Path | A distinct variant of how a process is executed. A single process may have multiple paths, reflecting different agent behaviors, escalation routes, workarounds, or outcomes. |
Ping-Pong Behavior | A process inefficiency pattern characterized by repetitive back-and-forth activity between departments or teams. |
Process | A standardized, end-to-end sequence of steps used to achieve a specific business intent (for example, "New Account Opening" or "Password Reset"). Processes are identified by Process Intelligence through analysis of recorded interactions. |
Process Flow | The visual map of a selected path, showing each step in sequence, including branches and decision points. You can zoom, drag, resize, and toggle the level of detail shown. |
Project | The organizational container for a Process Intelligence deployment. All processes, occurrences, connectors, and SOPs are scoped to a project. Depending on the configuration, you may select a project from the Projects dropdown. |
Root Cause Analysis | An AI-generated analysis that identifies the underlying factors contributing to friction, inefficiency, or complexity in a given process path, and suggests actions to address them. |
Standard Operating Procedure (SOP) | A document that defines the steps and procedures for a given process. In Process Intelligence, SOPs are created and edited in SOP Studio and can be exported as PDF or Word files. Each SOP can optionally include screenshots and other visuals, as well as a workflow diagram. |