Customer Trends
The Teams Customer Trends tab has two views that can be toggled. The default Team's Customer Trends tab displays the dashboard that provides summarization of customer sentiment and engagement. To view details of the Customer Trends, use the toggle button to change the view. It shows each team member’s EQ in table format.
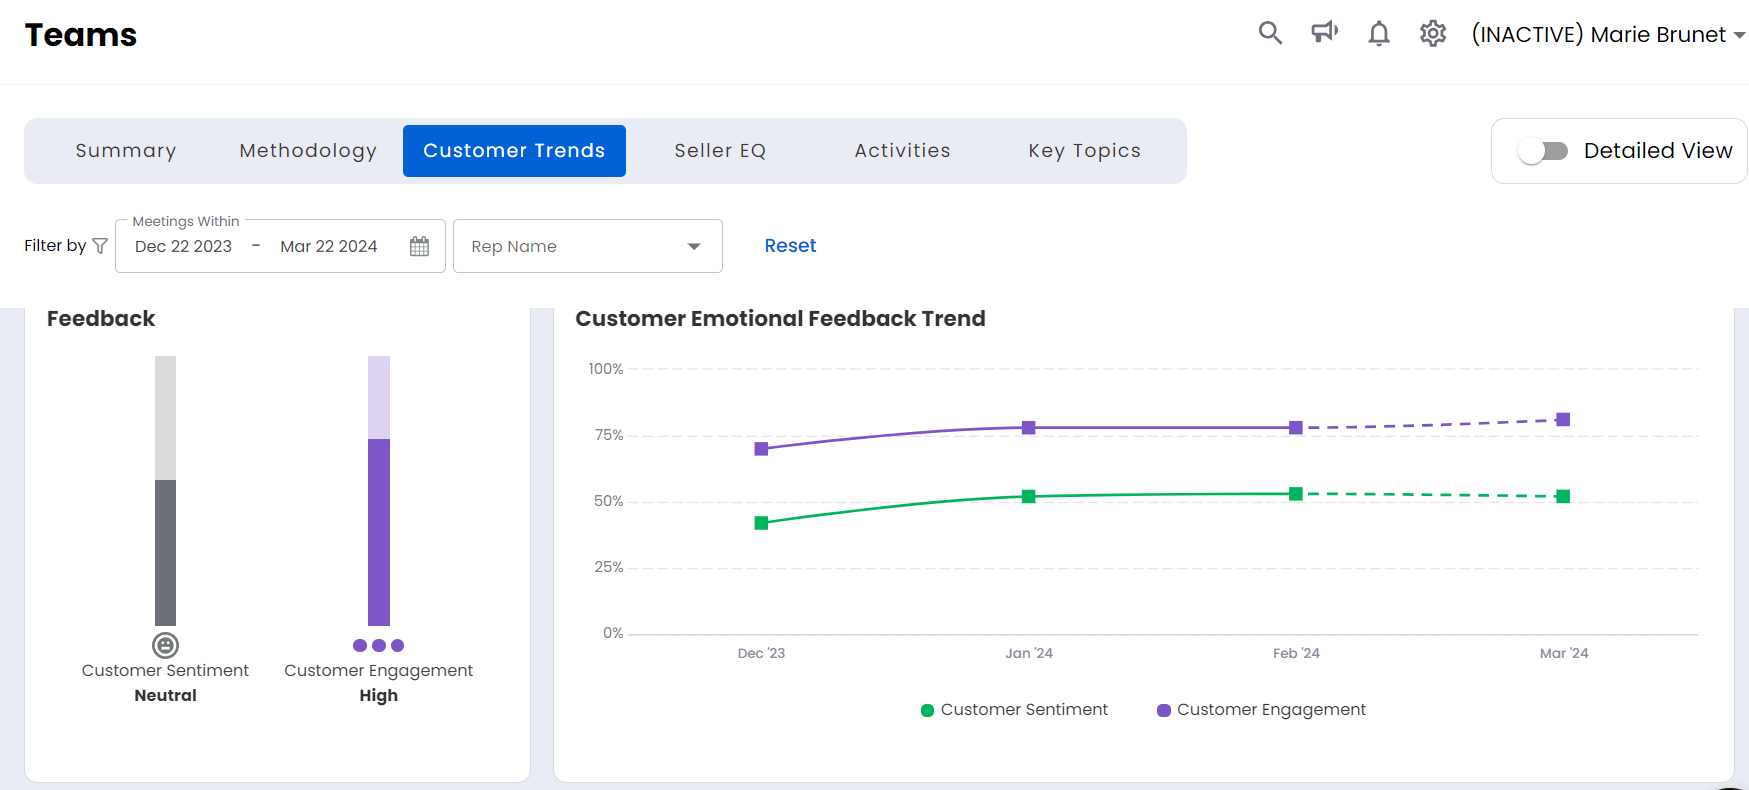
Dashboard View
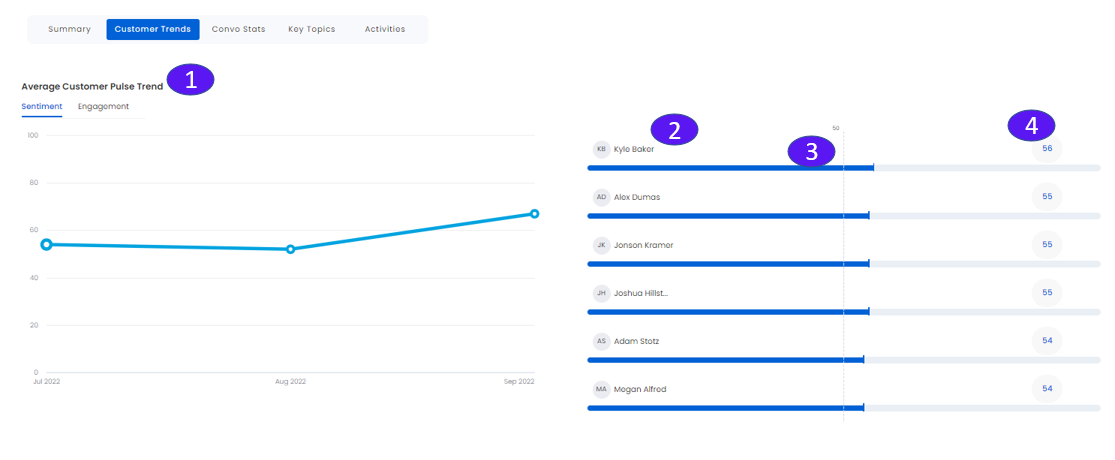
Detailed View
1. Average Customer Pulse Trend
The graph shows the average value of either Sentiment (default) or Engagement trend across the entire team for the past four months. Click Engagement to see the engagement graph and how the leaderboard changes.
2. Leaderboard
Employee icon, and name ranked from high to low. This is dependent on the graph selected.
3. Bar graph
Shows the customer Sentiment/Engagement value (%) achieved by each employee.
4. Numeric Value of Average Customer Pulse
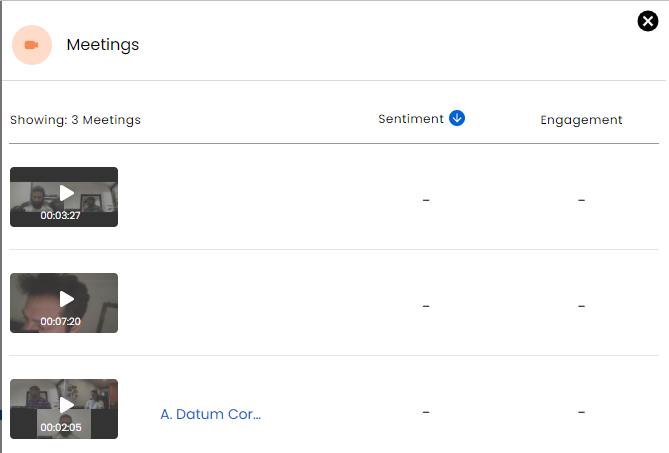
These numbers represent the value of the horizontal bar graph. Mouse over the numbers to see a View Meetings hover. When clicking on the number, it will open a slide-out, which allows you to view all the meeting information for this employee regarding the sentiment/engagement. The meeting information shows the meeting name, value, and contact. Click the meeting icon to view the meeting. Click the cancel button at the top right corner to close the slide-out.