Custom Analytics
Conversation Insights Agent Custom Analytics serves as the centralized analytics platform for reporting and dashboarding across customer interactions. It enables users to create custom dashboards, analyze operational performance, and visualize key metrics from a single location.
When both Conversation Insights Agent and Real-Time Guidance Agent are deployed for an account, Custom Analytics provides access to Conversation Insights Agent analytics and Real-Time Guidance Agent analytics through a unified interface. Users can also access access Real-Time Guidance Agent out-of-the-box dashboards under Analytics.
While both analytics experiences are available within the same platform, they focus on different types of insights:
Conversation Insights Agent Analytics provides visibility into customer conversations, agent performance, customer satisfaction, compliance adherence, operational efficiency, and other interaction-based metrics.
Real-Time Guidance Agent Analytics provides visibility into Guided Flow performance, including flow execution, triggered intents, step-level progression, completion rates, and flow abandonment trends.
Custom Analytics enables users to access all analytics data from a single location and create personalized data visualizations using the Designer tool. This tool offers options for selecting fields, metrics, and visualization types, including tables, bar charts, and bubble charts. Users can build dashboards tailored to their specific analytical needs and save them for future use, providing greater flexibility and focus on areas of interest.
Real-Time Guidance Agent-specific metrics, dimensions, and dashboards remain distinct within the platform, allowing users to easily identify whether they are analyzing customer interaction analytics and Guided Flow analytics while benefiting from a consistent reporting experience.
Note
When only Conversation Insights Agent is deployed for an account, Custom Analytics provides access only to Conversation Insights Agent analytics. Users can create dashboards using Conversation Insights Agent metrics and dimensions, while Product Names: Guidance_Agent analytics and out-of-the-box dashboards are not available.
Before getting started with Custom Analytics, see the Data Dictionary.
 |
Design Custom Dashboard
The Designer enables you to create custom dashboards using available fields and add custom fields as needed.
Note
To create a dashboard, you must have both Manage Access and Edit Access permissions for the folder where the dashboard will be saved.
Before creating a custom dashboard, review the Data Dictionary to become familiar with the available fields.
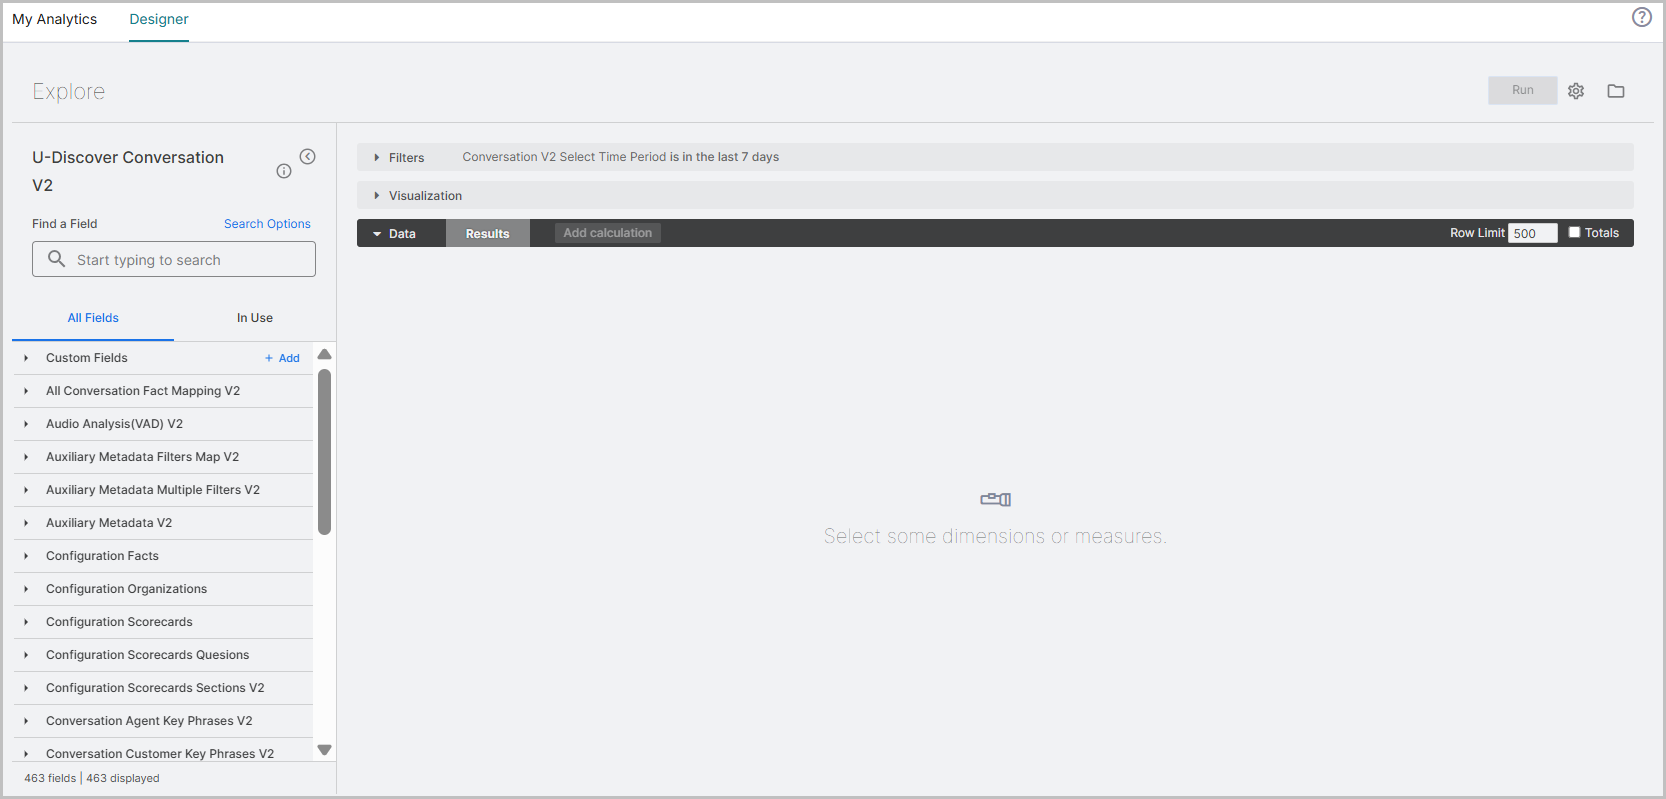
Navigate to Custom Analytics > Designer.
Add fields from the All Fields tab, which displays all available fields in Explore. The In Use tab shows all Explore fields currently in use.
Use the Find a Field search bar to search and select fields matching specific terms and criteria.
Note
The data shown in an Explore dashboard is determined by the dimensions and measures selected. A Dimension can be a group or a bucket of data, while a Measure is information about that bucket of data.
Click the required Field to add to the Data.
Important
To view conversation details, you must add the Conversation Id Link field to the Data and set the Visualization type to Table. Without this configuration, it is not possible to drill down into individual conversation details.
Up to 5 conversation details can be viewed simultaneously.
Use Custom Fields to create new fields.
While most fields are created by developers, custom fields allow the creation of ad hoc custom dimensions and measures. Admin permission is required to use this feature.
Open the Visualization tab and select the type of visualization that best displays your data. Table format is the default Visualization type.
Expand Filters to view the currently applied filter. Click + Filter to add a new field and define a filter condition.
In Custom Filters, you can add fields, constants, functions, and operators to customize your filtering. These filters remain tile-specific and cannot be converted into dashboard filters.
Once your query is set up, click Run to preview.
Click Settings, then hover your mouse over Save. Based on your requirement, you can save:
As a new dashboard: Select the folder where you want to save your dashboard. Ensure you have the Manage Access and Edit Access permissions for the folder. When saved as a new dashboard, the dashboard name and tile name remain the same by default. You can modify the dashboard name or the tile name at any time.
To an existing dashboard: Select the folder and the dashboard where you want to save the new tile. Ensure you have the Manage Access and Edit Access levels for the folder. Once saved, the new tile will appear under the chosen dashboard. You can enter a name for the tile; otherwise, it will be saved without a name and appear as an unnamed tile under the dashboard.
The saved tile and dashboard will be listed in My Analytics.
Note
For more information, refer to Create a Dashboard.
My Analytics
My Analytics displays all custom dashboards that you have designed. You can select and open any dashboard to review its data and perform edits as necessary.
Working with Custom Dashboards
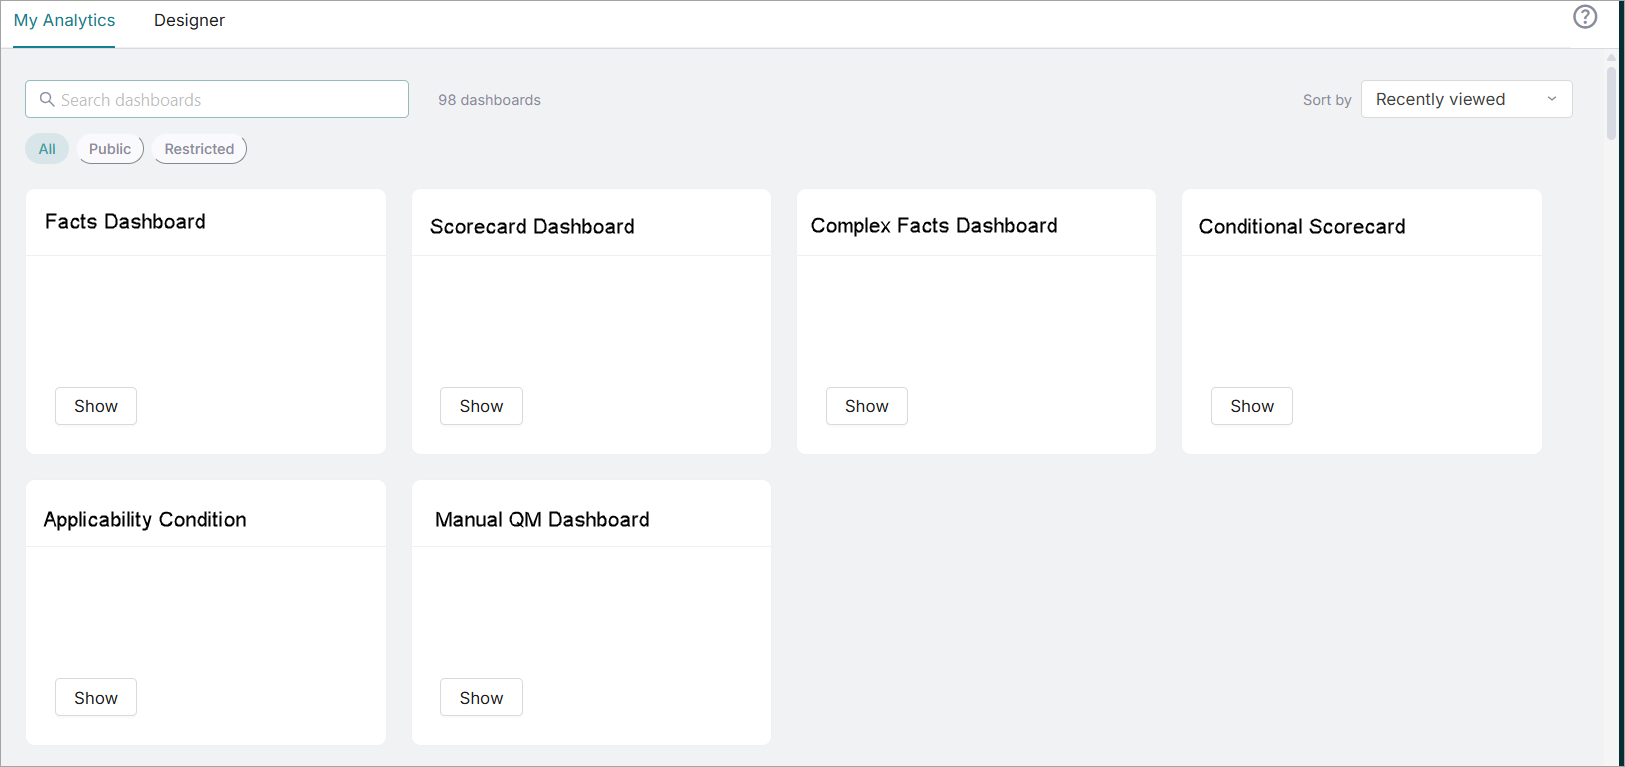
Navigate to Custom Analytics > My Analytics. All dashboards created by the user are displayed.
Select the dashboard you wish to view and click Show. The dashboard is displayed.
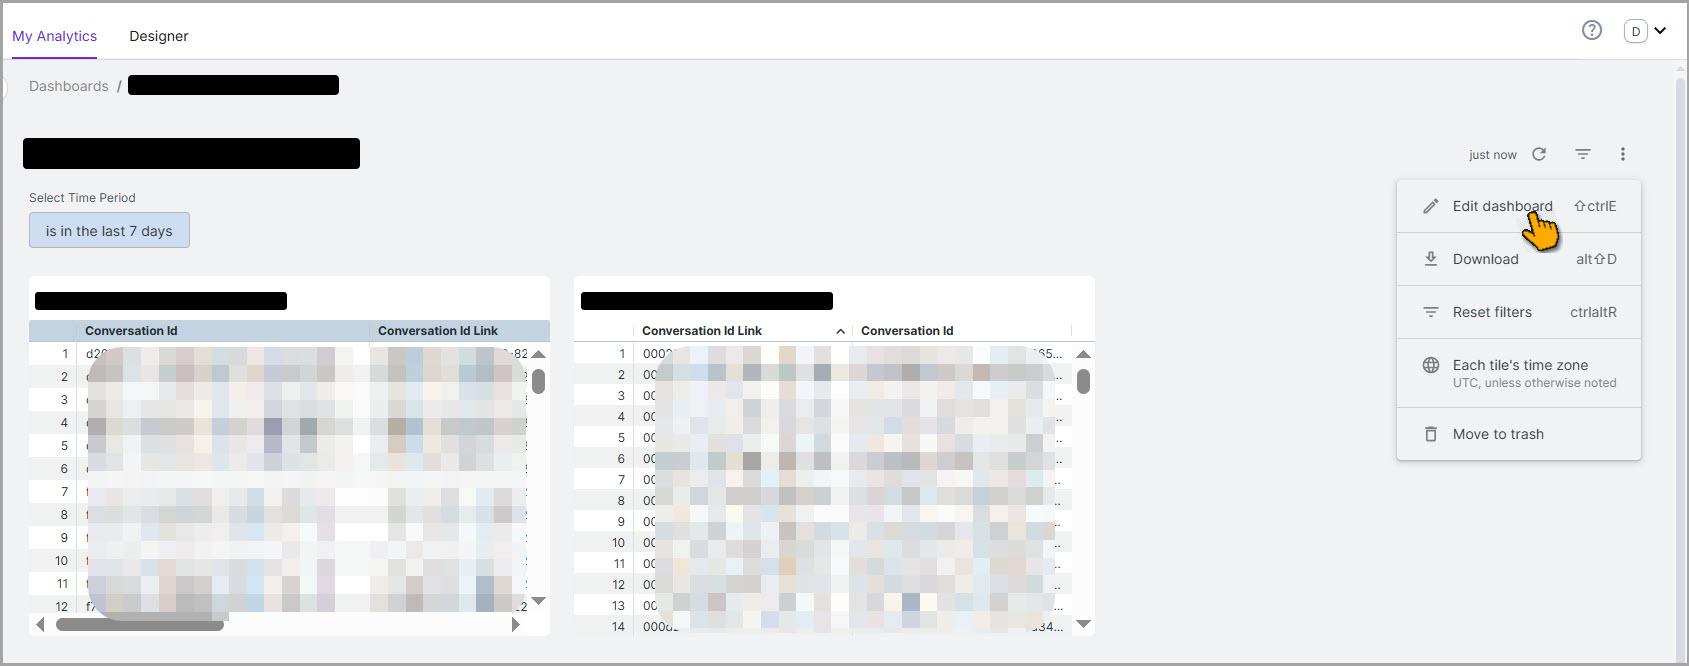
In the Select Time Period, choose the time range for which you want to view details. The default filter, "is in the last 7 days," is applied, which means data from the current day and the previous 6 days is displayed.
Use the icons in the top-right corner to refresh, hide/show filters, and edit the dashboard, respectively.
Use the search box to find a dashboard from the list.
Click any visibility setting to display the corresponding dashboard. The available options are All, Public, or Restricted. This option is available for dashboard owners. To learn more about this filter, click here.
Use Sort by to view dashboards by Recently viewed or Name.
From the View page, click Dashboard actions (
 ) at the top right corner and select Edit dashboard.
Go to the details section and click Edit. The Edit Tile appears.
The Edit Tile screen displays all elements available in Explore (Designer). In the Edit Tile, make the required changes.
To see a preview of the updated dashboard, click Run before saving.
To apply the changes, click Save in the Edit Tile.
Click Save on the Dashboards screen to save the overall dashboard changes.
Click Dashboard actions (
) at the top right corner and select Download.In the Download dialog, select the following details:
Format: Select the format in which you want to download the dashboard. You can download it as a PDF or CSV file.
Note
It is recommended to select CSV when downloading tiles with tables.
Paper Size: Applicable for PDF format only. When you select PDF, you can apply the paper size by selecting the required size from the dropdown. Fit Page to Dashboard is the default selection.
Orientation: Applicable only when the Fit Page to Dashboard option is not selected. The available options are Portrait and Landscape.
Expand tables to show all rows: Applicable for PDF format only. When selected, the entire table content is included in the PDF; otherwise, only the on-screen view is downloaded.
Note
Currently, we have set the downloadable row limit to 5000 per table, regardless of the rows in the table. This is a configurable limit.
Arrange dashboard tiles in a single column: Applicable for PDF format only. When selected, all tables across tiles are included in the PDF, one after another.
Click Open in Browser to view the dashboard in a separate window.
Click Download to save the dashboard in the specified format to your local directory.
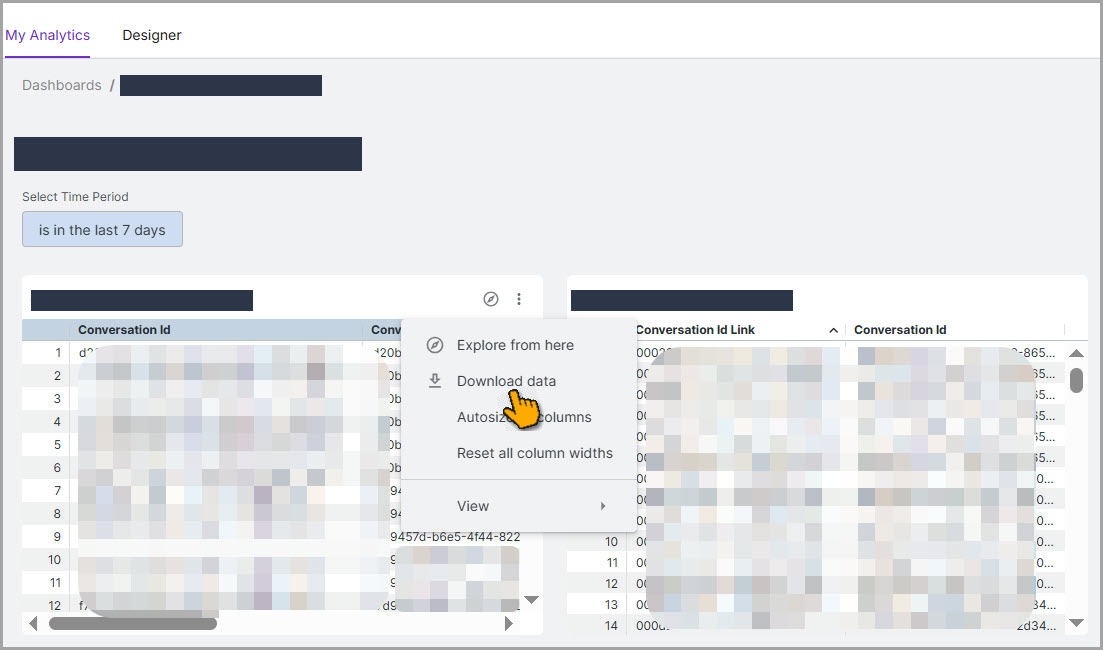
Navigate to the tile to be downloaded.
Click Tile actions in the top-right corner and select Download data.
In the Download dialog, select the following details:
Format: Select the format in which you want to download the dashboard. You can download it as a TXT (tab-separated values), Excel Spreadsheet (Excel 2007 or later), CSV, JSON, HTML, Markdown, or PNG (Image of Visualization).
Note
It is recommended to use the CSV format when downloading dashboards with 7 or more tables.
Advanced data objects > Results: Choose whether you want visualization settings applied to your TXT, Excel, CSV, JSON, HTML, or Markdown data download. Applicable for all formats except PNG (Image of Visualization). For more details, click here.
With visualization options applied: When selected, visualization settings are applied to your download data.
As displayed in the data table: When selected, visualization settings are not applied to downloaded results.
Advanced data objects > Data values: Choose how you want the downloaded query results to appear.
Formatted: When selected, numbers will be rounded off as defined in the Explore.
Unformatted: When selected, no special formatting is applied, and the results are shown as available.
Advanced data objects > Number of rows to include: Choose how many rows to be downloaded per table.
Current result table: When selected, the results show the total number of rows in the table.
Custom: When selected, you can enter the number of rows to download.
Note
Currently, the maximum number of rows that can be downloaded per table is 5000. Any table or custom value exceeding this limit will be automatically capped at 5000.
Click Download to save the tile in the specified format to your local directory.
Folders are used to organize the Custom Dashboards more efficiently. Folder management is available only to the Administrator and Analyst.
Note
Reach out to your Uniphore Support Representative to enable Folder functionality for your tenant.
To access Folders, click the Folder icon on the top right corner of the Explore section. The Folder menu includes Favorites, My Folders, and Shared.
Favorites: View all dashboards and looks you've marked as favorites in one convenient location. To add items to Favorites, click the heart icon next to any dashboard or look name in My Analytics. From Favorites, you can move dashboards between folders or delete dashboards.
My Folder: Access your personal folders. Each user can view and manage their own folders, while folders created by other users are not accessible to them. From My Folders, you can create folders, move dashboards between folders, including both existing dashboards and duplicated copies, or delete dashboards.
Shared: View Account-level (tenant) shared folders. Any user with BI designer role access can view the folder details. You can create new Account-level shared folders accessible to all users with BI Designer role access within your Account. You can also duplicate dashboards from shared folders.
Custom dashboards in Conversation Insights Agentcan now have controlled visibility. Administrators and Analysts can set the visibility access. The dashboards can be set to either Public or Restricted view.
Public: Dashboards with Public access are visible to all users. This is the default access.
Restricted: Dashboards with Restricted access are visible to dashboard owners and users or roles assigned to view the dashboard.
To set the visibility access:
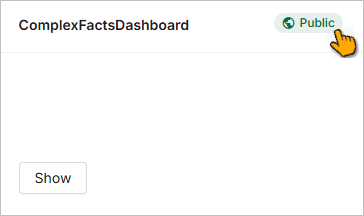
Click the access status in the dashboard widget. The Manage Access dialog appears.
Select Public or Restricted, depending on your access requirements.
If you select Restricted, you can grant access to a role or a specific user. The list shows all roles available for the tenant and the users available for each role.
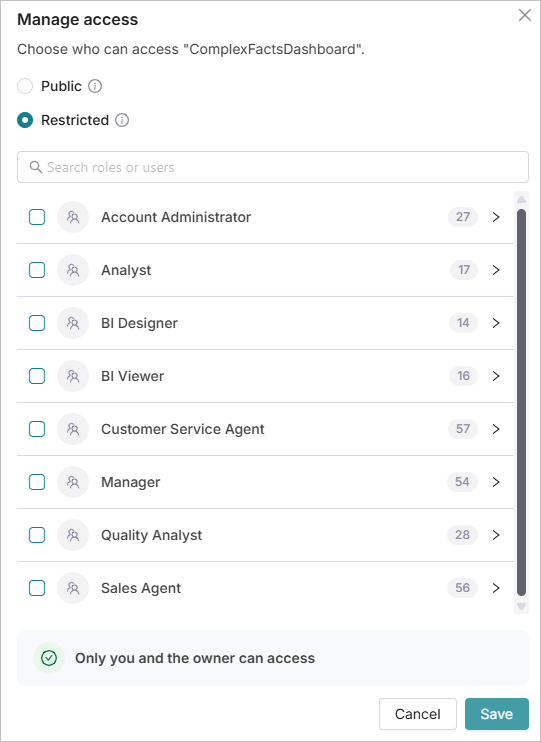
After selection, you can view the selected Role and the User at the bottom of the dialog.
Click Save.
Real-Time Guidance Agent Analytics
Note
Prior to Release 2026.05, Business Information (BI) Dashboards were maintained in the Real-Time Guidance Agent.
The Analytics Dashboard provides out-of-the-box Real-Time Guidance Agent performance and Business Information (BI) Dashboards for your account, drawn from runtime data, when both Conversation Insights Agent and Real-Time Guidance Agent are deployed for an account.
The dashboard presents intuitive views of key metrics for chats and conversations across your call center, helping your organization monitor operational performance, identify conversation trends, and develop service solutions that better address the evolving needs of your customers.
Using our Analytics Dashboards, you and your team can easily access visual insights about customer journeys over time, filter for key values, set activity ranges, manipulate views, and more.
The Real-Time Guidance Agent performance and BI Dashboards access the full spectrum of your account's activity data and are refreshed at two-minute intervals by default. We developed them using Looker, a leading business intelligence software platform that specializes in the preparation, presentation, and analysis of enterprise-scale data.
Currently, Conversation Insights Agent provides the following prepared Real-Time Guidance Agent Dashboards for each account, out-of-the-box:
Conversation AI - Summarizes the efficiency of AI models deployed in the account.
Conversation Experience - Overall experience summary for Agents and Enterprise Users.
GenAI Call Summary Status - Provides real-time visibility and insights for Generative AI-based Call Summaries.
Operational: Agents - Operations-based summary of Agent presence and Session activity.
Operational: Conversations - Operational overview and performance aspects for Conversations.
Viewing Real-Time Guidance Agent Performance and BI Dashboards
Real-Time Guidance Agent and BI Dashboards help you to explore and understand your account activity data, interactively.
Each Dashboard presents a selected dataset, designed to answer specific questions about account and business activities.
Note
Users with the Account Administrator, Analyst, Quality Analyst, BI Designer, or BI Viewer role can view the out-of-the-box Real-Time Guidance Agent dashboards.
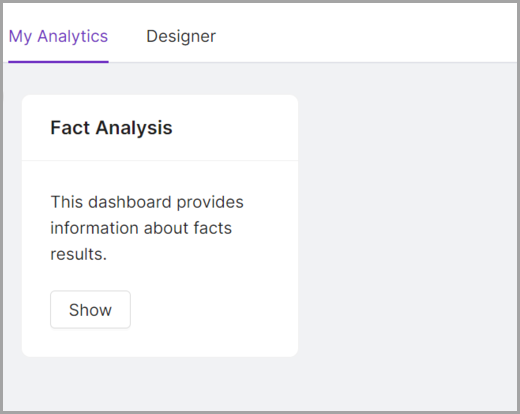
From the Insights menu, select Analytics. The Analytics page opens with the currently available Dashboards displayed:
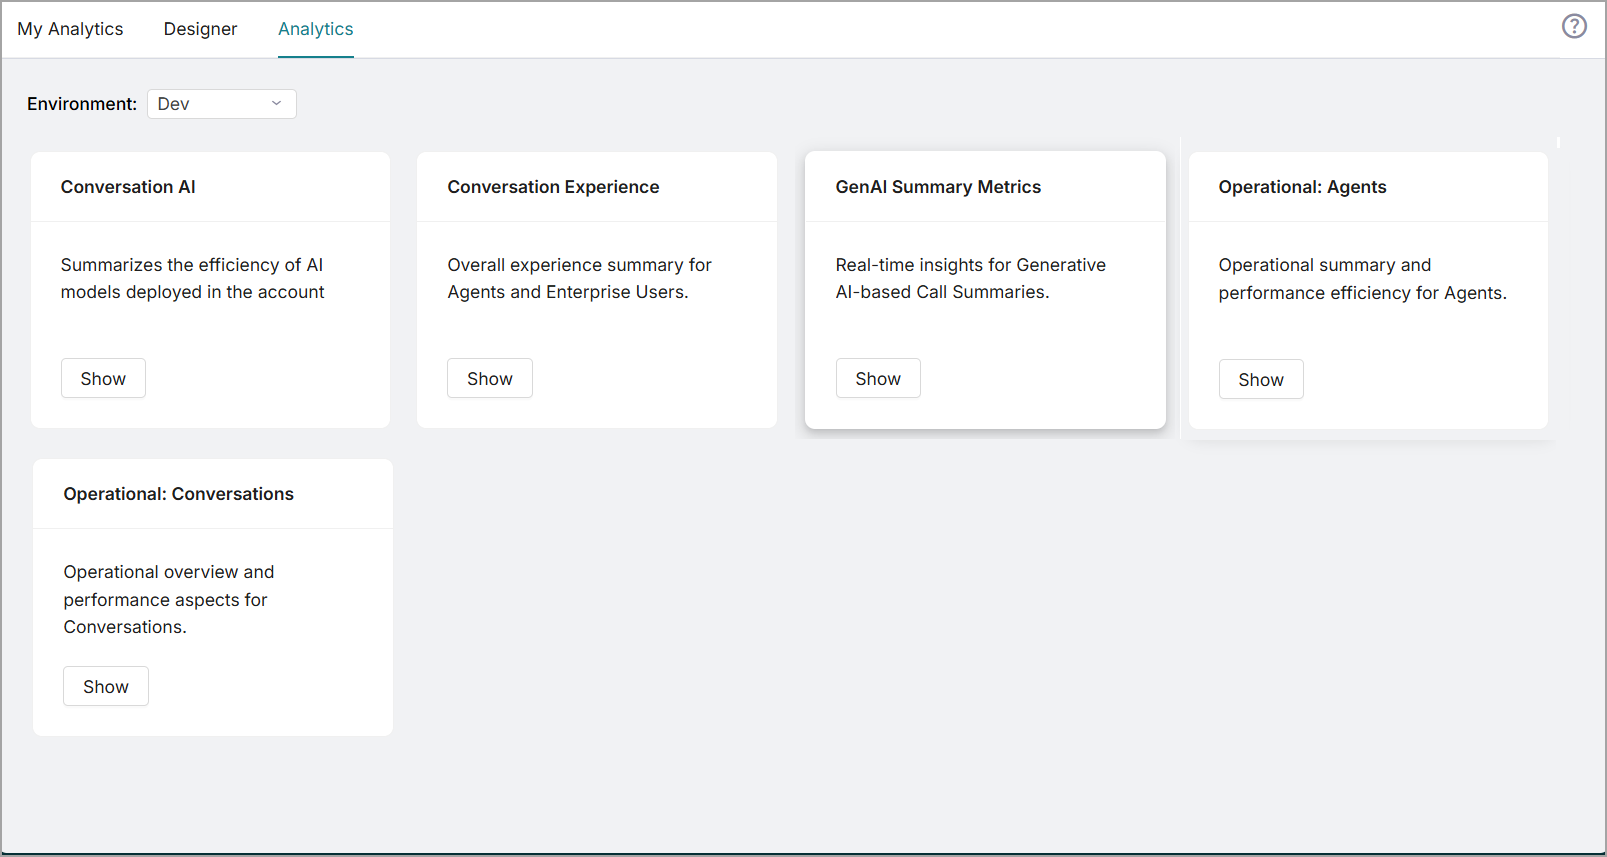
Click Show in the Dashboard you want to view. The selected Dashboard will be displayed.
Note
If you receive a HTML 401 authentication error when attempting to access the BI Dashboards, make sure that your browser is not blocking third-party cookies. For more details about handling this and similar authentication errors, see the Looker documentation.
Working with RTGA Performance and BI Dashboards
When both Real-Time Guidance Agent and Conversation Insights Agent are deployed for an account, the Analytics section enables you to view Real-Time Guidance Agent Dashboards and examine activity metrics and data subsets over a selected time period.
You can actively interact with a displayed Dashboard to filter relevant data, as described below.
Looker supports the following activities while viewing a BI Dashboard:
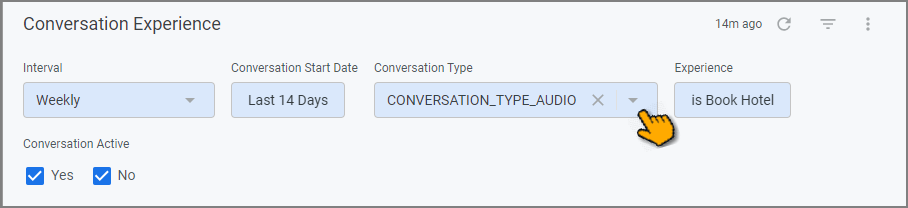
Filter the Dashboard | You can limit which specific data will be used for displayed calculations using the Filter dropdowns found at the top of the Dashboard. The Filters will vary according to the Dashboard you are using:
TipIf the Filter dropdowns are not currently visible, click on the Filter Display To use the Filter, select the values and ranges that you want the Dashboard to focus on, then click the Refresh While filtering is active, all displayed charts, tables, and summaries will reflect only data that matches the filter. To remove a Filter, click the X on the right side of its dropdown. The Dashboard will refresh to reflect your updated filtering selection. To quickly reset all filters to their default values, from the upper right corner of the Dashboard, click Reset filters: 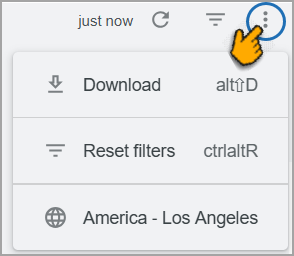 | ||
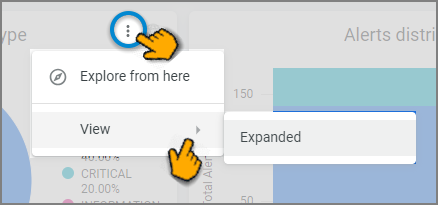
Expand the View of a Dashboard Metric | To view an enlarged image of the selected metric, from the upper right corner of the tile for the metric open the Tile Actions sub-menu and click View > Expanded.
An enlarged popup of the metric will be displayed. | ||
Manage Time Zone | You can select which time zone is used to display Dashboard values. You can choose from:
When the Globe To change the selected time zone, first, from the upper right corner of the Dashboard, click the current time zone option menu: 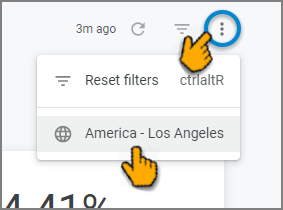 Then, from the dropdown list, select the desired time zone display option: 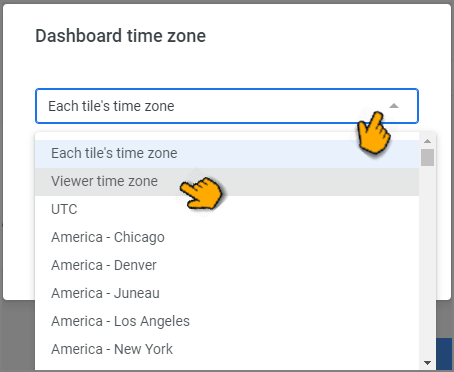 All of the Dashboard titles will be instantly updated to reflect your selection. | ||
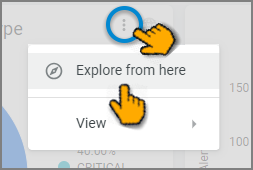
Explore a Dashboard Metric | To 'drill down' into a selected data point for further analysis, from the upper right corner of the tile for the relevant metric, open the Tile Actions sub-menu and click Explore from here.
A new, independent Explore browser tab will open providing you with interactive options, including:
The Explore browser tab provides many additional features for analyzing, downloading, printing and sharing data. NoteChanges made to views or data in the Explore tab will not have any impact on views or data in the main Dashboard. | ||
Download Dashboard | To download the specific dashboard in PDF or CSV format, from the upper right corner of the Dashboard, click Download. When downloading in PDF, you can find these settings in the download window. 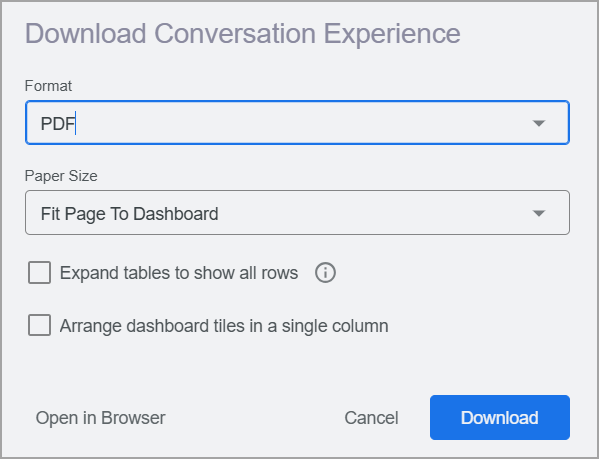
|



For a complete description of Looker Dashboard features, refer to Looker documentation.
Default Real-Time Guidance Agent Dashboards
Conversation Insights Agent provides a default set of Real-Time Guidance Agent Performance and BI Dashboards for each account, enabling a quick way to answer many basic questions about your call center operations right 'out-of-the-box'. The Dashboards provide key metrics and graphical chart displays that reflect runtime data, as well as historic data.
Conversation AI
| This dashboard summarizes the efficiency of AI models deployed in the current account. |
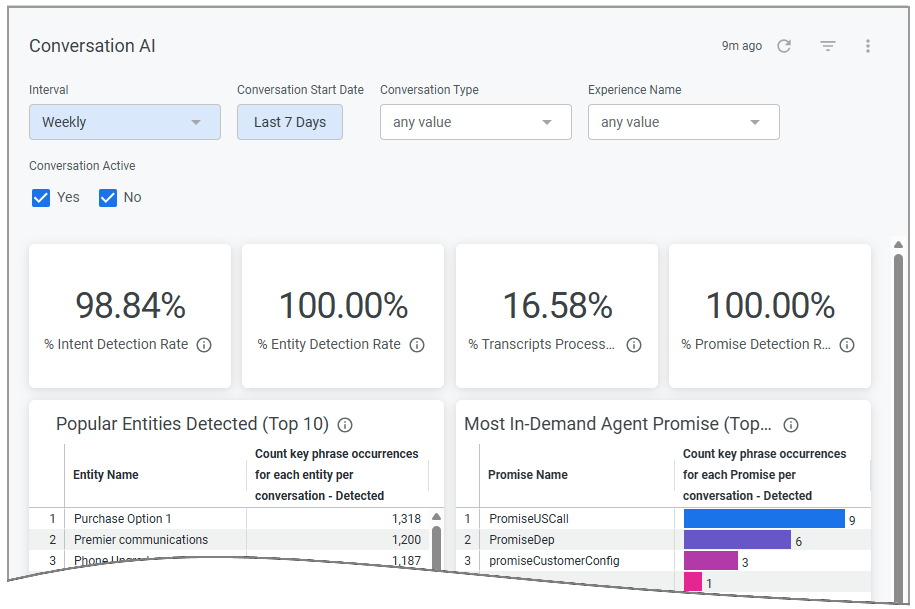
Component / Sample Questions | Details |
|---|---|
AI Metrics | Key metrics that provide at-a-glance statistics about Conversation AI activities that match the selected filter values.
|
Popular Entities Detected (Top 10) Which Entities are used most often? | A chart that shows the ten Entities that were detected the highest number of times and match the selected filter values. |
Most In-Demand Agent Promise (Top 10) What are the Promises most often made by Agents? | A chart that shows the ten Promises that were detected the highest number of times and match the selected filter values. |
Number of Flows Which Flows are executed most often? | A trend chart that shows the total count of each Flow detected with the selected filter values, displayed by Interval. |
Conversation Experience
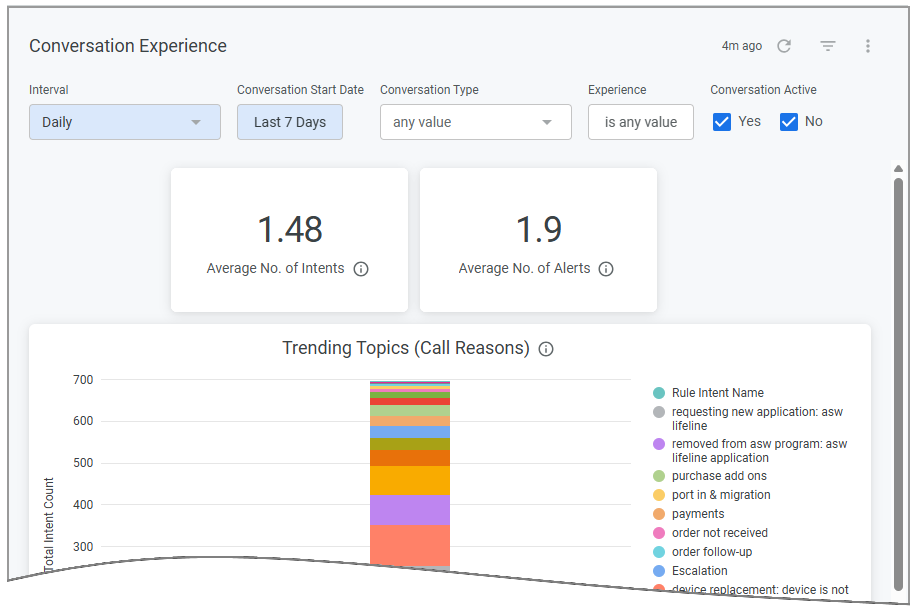 | This dashboard provides a summary of the overall experience for Agents and enterprise users. |
Component / Sample Questions | Details |
|---|---|
Experience Metrics | Key metrics that provide at-a-glance statistics about Conversation Experience activities that match the selected filter values.
|
Trending Topics (Call Reasons) What Call Reasons were most often given to Agents last month? This week? | A trend chart that shows the number of times each Call Reason (i.e., Intent) was detected with the selected filter values. |
Alert Type What types of Alerts are raised most often? What proportion of Alerts raised were Critical? | A chart that shows all Alerts raised that match the selected filter values, displayed proportionately by Alert Type. |
Alerts Distribution What Alerts were most often sent to Agents last week? To Supervisors? | A trend chart that shows the total number of Alerts detected that match the selected filter values, displaying the number received only by Agents and the number received by Supervisors. |
Promise Status Tracker How many Agent Promises are currently unfulfilled? How many are completed? | A chart that shows the number of Agent Promises detected that match the selected filter values, displayed by their current Promise Status. |
GenAI Call Summary Status
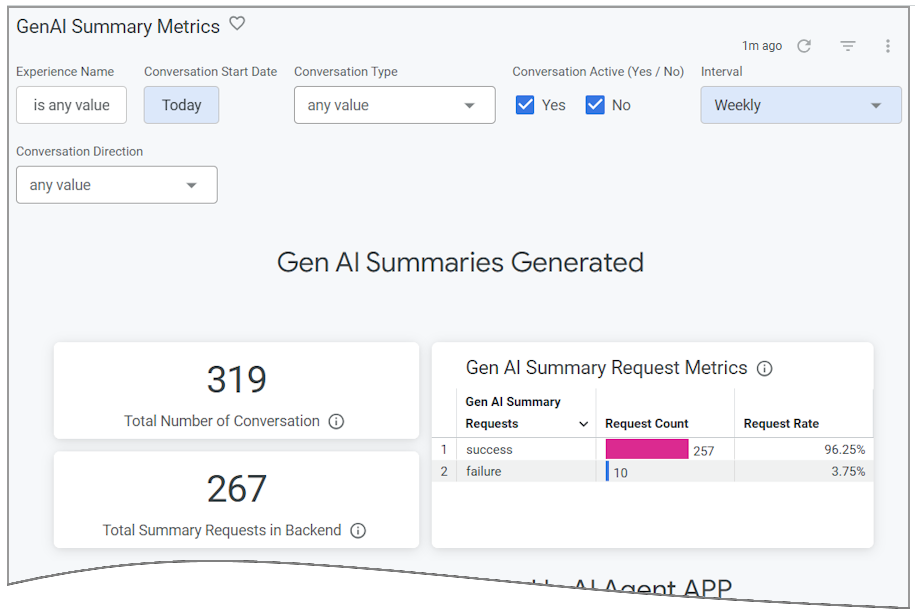 | This dashboard provides real-time visibility for generative AI-based Call Summaries created in the current account. |
Component / Sample Questions | Details |
|---|---|
GenAI Summaries Generated How many times was a GenAI Call Summary requested for processing in the back-end for my account? How many processing failures occurred in the back-end? | Shows the success or failure count of summary requests that are received from Agents for processing, based on the selected filter values. NoteThese elements show only requests arriving in the back-end, prior to results being sent to an Agent.
|
GenAI Summaries Received In the AI Agent Application How many times was a GenAI Call Summary displayed to an Agent? How many times did GenAI Call Summary data fail to be transmitted to the Agent? | Tracks the summaries as they are displayed to and handled by an Agent in the AI Agent Assist application, based on the selected filter values.
|
GenAI Summaries Submissions How many submissions were made manually? How many automatically? How many times did an Agent edit a GenAI Call Summary? | Tracks the status of submissions based on the selected filter values, including how many were submitted manually or automatically, and how many summaries were edited by the Agent prior to submission.
|
Operational: Agents
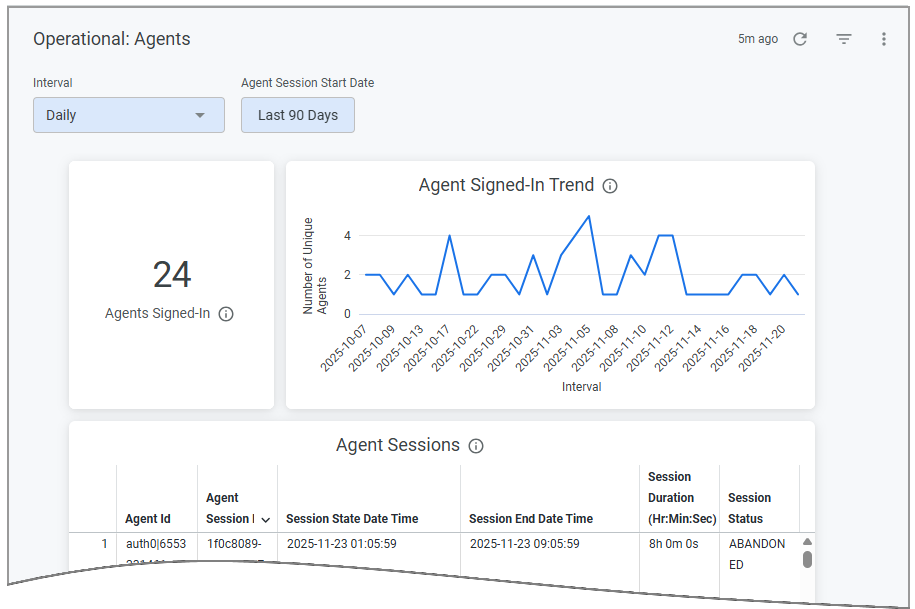 | This dashboard provides an operations-based summary of Agent presence and Session activities. |
Component / Sample Questions | Details |
|---|---|
Agent Metrics | Key metrics that provide at-a-glance statistics about Agent activities that match the selected filter values.
|
Agents Signed-In Trend How many Agents were signed in yesterday? How many last week? | A trend chart that shows the number of unique Agents who signed in during each bucket covered by the selected filter values. Each Agent is counted once per bucket (not per Agent Session). |
Agent Sessions Which Sessions were completed in under 5 minutes? Which Agents conducted the most Sessions? | A chart that shows details and completion status for each unique Agent Session that matches the selected filter values, displayed in order of Session occurrence. |
Operational: Conversations
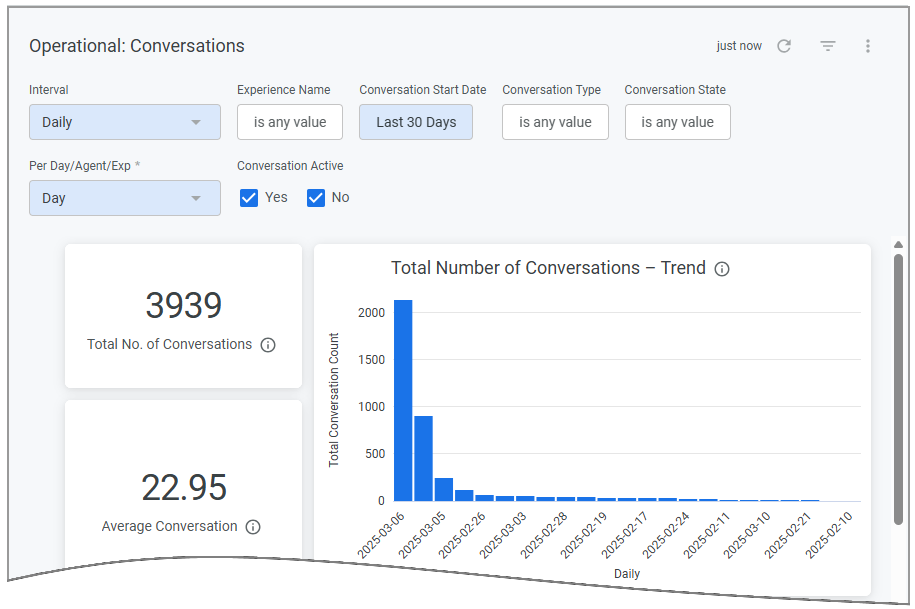 | This dashboard provides an operations-based overview, showing various aspects of Conversation performance. |
Component / Sample Questions | Details |
|---|---|
Conversation Metrics | Key metrics that provide at-a-glance statistics about Conversations that match the selected filter values.
|
Total Number of Conversations - Trend How many Conversations occurred in the last day? In the last week? | A trend chart that shows the number of Conversations that match the selected filter values, displayed by Interval. |
Number of Active Conversations (Call/Chat) – Trend How many active Conversations were there last Tuesday afternoon? | A trend chart that shows the number of active Conversations that match the selected filter values, displayed by Interval. |
Number of Active Conversations (Call/Chat) Of all active Conversations, how many were voice calls? | A chart that shows the number of active Conversations that match the selected filter values, displayed proportionately by Conversation Type. |
Average Handle Duration – Trend How long does an Agent handle a Conversation, on average? Does the average handling time change significantly from month to month? | A trend chart that shows the average duration of Conversations (i.e., from Conversation start until Summary submission) that match the selected filter values, displayed by Interval. |
ACW Timing – Trend How long does an Agent perform after call work on a Conversation? Does after call work time change significantly from month to month? | A trend chart that shows the average duration of After Call Work (ACW) by the Agent prior to submitting the Call Summary (i.e., the time between the end of the Conversation and Summary submission), displayed by Interval. |
Conversations – Trend What is the overall trend for Conversations, as they relate to our Experiences and Agents, per day? Per week? | A trend chart that shows total count for Conversations that match the selected filter values, displayed by Interval. In addition, for each Interval, an average count is displayed per Agent, per Day and per Experience. |
Number of Concurrent Agents - Trend How many Agents were active in a conversation simultaneously last week? How many three hours ago? | A trend chart that shows the number of Agents simultaneously active in conversations, according to the selected filter values, displayed by Interval. |
Average Number of Calls Handled Per Agent (Top 10) Who are the top performing Agents this month? | Names of the ten Agents who took the highest average number of Conversations matching the selected filter values, by the number of calls they handled, in descending order. |
Data Dictionary of Custom Analytics
In this section, all fields available in Custom Analytics are listed, along with their descriptions and types. These are categorized based on the components available in the dashboard.
Item | Field Name | Description | Type |
|---|---|---|---|
1 | Pivoted Fact 1 Name | Name of the first fact used to pivot the data. | String |
2 | Pivoted Fact 2 Name | Name of the second fact used to further pivot the data. | String |
3 | Pivoted Fact 3 Name | Name of the third fact used to further pivot the data. | String |
1 | Pivoted Fact Value 1 | The values corresponding to the selected Pivoted Fact 1 Name. It can be used as a filter. | String |
2 | Pivoted Fact Value 2 | The values corresponding to the selected Pivoted Fact 2 Name. It can be used as a filter. | String |
3 | Pivoted Fact Value 3 | The values corresponding to the selected Pivoted Fact 2 Name. It can be used as a filter. | String |
This view provides information about metadata provided with the conversation.
Item | Field Label | Description | Type |
|---|---|---|---|
1 | Auxiliary Metadata Name | Name of the Auxiliary Metadata | String |
2 | Auxiliary Metadata Value | Auxiliary Metadata Value (Dimension) | String |
3 | Conversation Id | Primary key Identifier of the Conversation | String |
4 | Auxiliary Metadata Value | Auxiliary Metadata Value (Measure) | List |
This view provides information about facts that are configured in the application.
Item | Field Label | Description | Type |
|---|---|---|---|
1 | Channel | Channel | String |
2 | Created By | Created By | String |
3 | Created Date | Created Date | Number |
4 | Deleted | Deleted | Number |
5 | Description | Description | String |
6 | Direction | Direction | String |
7 | Environment | Environment | String |
8 | Exact Match Phrases | Exact Match Phrases | String |
9 | Exact Match Speaker | Exact Match Speaker can be: Agent, Customer, or Either. | String |
10 | Exact Match Type | Exact Match Type can be ANY or ALL. | String |
8 | Fact Group Id | Fact Group Id | String |
9 | Fact ID | Fact ID | String |
10 | Fact Name | Fact Name | String |
11 | Fact Type | Fact Type | String |
12 | Fact Version | Fact Version | Number |
13 | Is System Fact (Yes / No) | Is System Fact | Boolean |
14 | Key Fact (Yes / No) | Key Fact | Boolean |
15 | Language | Language | String |
16 | Org Id | Org Id | String |
17 | Query | Query | String |
18 | Response Type | Response Type | String |
19 | Status | Status | String |
20 | Tenant Id | Tenant Id | String |
21 | Updated Date | Updated Date | Number |
22 | Count | Count | Count distinct |
This view provides information about the organization hierarchy configured on the system.
Item | Field Label | Description | Type |
|---|---|---|---|
1 | Active | Active | Number |
2 | Child Order | Child Order | Number |
4 | Name of Organization | Node Label | String |
4 | Node Type Id | Node Type Id | Number |
5 | Org Id | Org Id | Number |
6 | Parent Id | Parent Id | String |
7 | Tenant Id | Tenant Id | String |
8 | Version | Version | Number |
9 | Count | Count | Count distinct |
The view provides information about scorecards configured on the system.
Item | Field Label | Description | Type |
|---|---|---|---|
1 | Scorecard Channels | Scorecard Channels | Number |
2 | Scorecard Description | Scorecard Description | String |
3 | Scorecard Direction | Scorecard Direction | Number |
4 | Scorecard Id | Scorecard Id | String |
5 | Scorecard Language | Scorecard Language | String |
6 | Scorecard Name | Scorecard Name | String |
7 | Scorecard Organization Hierarchy | Scorecard Organization Hierarchy | Number |
8 | Scorecard PassRange | Scorecard PassRange | Number |
9 | Scorecard Scorerange Description | Scorecard Scorerange Description | String |
10 | Scorecard Scorerange Maximum Value | Scorecard Scorerange Maximum Value | Number |
11 | Scorecard Scorerange Minimum Value | Scorecard Scorerange Minimum Value | Number |
12 | Scorecard Scorerange Name | Scorecard Score range Name | String |
13 | Scorecard Status | Scorecard Status | String |
14 | Scorecard Tenant Id | Scorecard Tenant Id | String |
15 | Scorecard Version | Scorecard Version | String |
16 | Count | Count | Count distinct |
17 | Scorecard Name Filter | Scorecard Name Filter | String |
This view provides information about scorecard questions configured on the system.
Item | Field Label | Description | Type |
|---|---|---|---|
1 | Scorecard Question Section Id | Scorecard Question Section Id | String |
2 | Scorecard Sections Question - Associated Fact | Scorecard Sections Question - Associated Fact | String |
3 | Scorecard Sections Question - Impact | Scorecard Sections Question - Impact | String |
4 | Scorecard Sections Question - MeasureName | Scorecard Sections Question - MeasureName | String |
5 | Scorecard Sections Question - Modification Date | Scorecard Sections Question - Modification Date | Date time |
6 | Scorecard Sections Question - Question Order | Scorecard Sections Question - Question Order | Number |
7 | Scorecard Sections Question - Text | Scorecard Sections Question - Text | String |
8 | Scorecard Sections Question - Weightage | Scorecard Sections Question - Weightage | Number |
9 | Scorecard Sections Question -Help Text | Scorecard Sections Question -Help Text | String |
10 | Scorecard Sections Question -Is Auto Evaluation Enabled (Yes / No) | Scorecard Sections Question -Is Auto Evaluation Enabled | Yesno |
11 | Scorecard Sections Question -Is AutoFail Question (Yes / No) | Scorecard Sections Question -Is AutoFail Question | Yesno |
12 | Scorecard Sections Question Id | Scorecard Sections Question Id | String |
13 | Section Question Scorecard Tenant Id | Section Question Scorecard Tenant Id | String |
14 | Count | Count | Count |
This view provides information about scorecard sections configured on the system.
Item | Field Label | Description | Type |
|---|---|---|---|
1 | Scorecard Section Creation Date | Scorecard Section Creation Date | Date time |
2 | Scorecard Section Id | Scorecard Section Id | String |
3 | Scorecard Section Modification Date | Scorecard Section Modification Date | Date time |
4 | Scorecard Section Name | Scorecard Section Name | String |
5 | Scorecard Section Parent Section Id | Scorecard Section Parent Section Id | String |
6 | Scorecard Section Weightage | Scorecard Section Weightage | Number |
7 | Scorecard Sections Name - Agent Performance | Scorecard Sections Name for Agent Performance | String |
8 | Scorecard Sections Name - Team Performance | Scorecard Sections Name for Team Performance | String |
9 | Section Scorecard Id | Section Scorecard Id | String |
10 | Section Scorecard Tenant Id | Section Scorecard Tenant Id | String |
11 | Count | Count | Count |
This view provides information about conversations. This is a base view.
Item | Field Label | Description | Type |
|---|---|---|---|
1 | Agent Id | Agent Identifier | String |
2 | Conversation Channel | Type of the communication medium Example: VOICE / CHAT | String |
3 | Conversation Direction | Direction for conversation | String |
4 | Conversation Duration (seconds) | Pre-calculated field for the conversation duration of all the audio analysis type. | Number |
5 | Conversation Id | Primary key Identifier of the Conversation | String |
6 | Conversation Language | Conversation Language | String |
7 | Conversation Meta Data | Conversation Meta Data | String |
8 | Conversation Organization Id | Conversation Organization Id | String |
9 | Conversation Start Date Date Date | Start Date of the Conversation | Date date |
10 | Conversation Start Date Date Hour | Conversation Start Date Date Hour | Date hour |
11 | Conversation Start Date Date Month | Start Date of the Conversation | Date month |
12 | Conversation Start Date Date Time | Start Date of the Conversation | Date time |
13 | Conversation Start Date Date Week | Start Date of the Conversation | Date week |
14 | Conversation Start Date Date Year | Start Date of the Conversation | Date year |
15 | Session Id | Identifier of the Conversation | String |
16 | Agent Performance - Average Handled Duration | Average of audio analysis of conversations, including all durations. | Average |
17 | Agent Performance - Team Average Handled Duration | Average Conversation Duration - Team | Average |
18 | Agent Performance - Total Conversation Count | Count of Unique Conversations for the selected period | Count distinct |
19 | Average Conversation Duration (hh:mm:ss) | Average number of calls handled per Agent for the Conversation | Number |
20 | Average Conversation Duration (mm:ss) | Average conversation duration | String |
21 | Average Conversation Duration (seconds) | Average conversation duration | Number |
22 | Average Team Handle Time | Average Team Handle Time | Number |
23 | Change from previous period - average handle time | Change from the previous period - average handle time | Number |
24 | Conversation Duration (hh:mm:ss) | Conversation duration (hh:mm:ss) | String |
25 | Team Performance - Team Average Handled Duration | Average Conversation Duration - Team | Average |
26 | Team Performance - Total Team Conversation Count | Total Team Conversation Count for the selected period | Count distinct |
27 | This Period - Average Conversation Count Per Agent | This Period - Average Conversation Count Per Agent | Number |
28 | This Period - Total Agent Count | This Period - Total Agent Count | Count distinct |
29 | This Period - Total Conversation Count | This Period - Total Conversation Count | Count distinct |
30 | Total Agent Count | Count of Unique Agents | Count distinct |
31 | Total Conversation Count | Count of Unique Conversations for the selected period | Count distinct |
32 | Conversation Agent ID Filter | Agent Id Filter | String |
33 | Conversation Id Link | Conversation Id which is required to drill down and view the conversation details. | String |
34 | Select Time Period | Date Filter | Date |
This view provides information about agent key phrases associated with conversations.
Item | Field Label | Description | Type |
|---|---|---|---|
1 | Agent Key Phrases | Agent Key Phrases | String |
2 | Facts Id | Topic Id | String |
3 | This period total number of topics | This period's total number of topics | String |
4 | Date range | Date range | Count distinct |
5 | This Period- Conversation Count | This Period- Conversation Count | Count distinct |
6 | Total number of topic | Total number of topics | Count distinct |
This view provides information about customer key phrases associated with conversations.
Item | Field Label | Description | Type |
|---|---|---|---|
1 | Customer Key Phrases | Customer Key Phrases | String |
2 | Facts Id | Topic Id | String |
3 | This period customer key phrases count | This period customer key phrases count | String |
4 | Distinct Count | Distinct Count | Count distinct |
5 | This Period- Conversation Count | This Period- Conversation Count | Count distinct |
6 | Total number of topic | Total number of topics | Count distinct |
This view provides information about fact evaluation.
Item | Field Label | Description | Type |
|---|---|---|---|
1 | Facts Id | Topic Id | String |
2 | Facts Result Boolean | Facts Result Boolean | String |
3 | Facts Result Confidences | Facts Result Confidences | Number |
4 | Facts Result Explanations | Facts Result Explanations | String |
5 | Facts Result List | Facts Result List | String |
6 | Facts Result Numeric | Facts Result Numeric | String |
7 | Facts Result Numeric Units | Facts Result Numeric Units | String |
8 | Facts Result String Values | Topic Values | String |
9 | Facts Result Turn Start Offset | Facts Result Turn Start Offset | Number |
10 | Agent Performance - Topic Count for Agent | Agent Topic Count for selected period | Count distinct |
11 | Count of Conversation Per Topics(Agent) | Count of Conversation Per Topics(Agent) | Count distinct |
12 | Count of Conversation Per Topics(Team) | Count of Conversation Per Topics(Team) | Count distinct |
13 | Count of Facts evaluated to false | Count of Facts evaluated to false | Count distinct |
14 | Count of Facts evaluated to true | Count of Facts evaluated to true | Count distinct |
15 | Percentage of Facts evaluated to false | Percentage of Facts evaluated to false | Number |
16 | Percentage of Facts evaluated to true | Percentage of Facts evaluated to true | Number |
17 | Team Performance - Topic Count for Team | Team Topic Count for selected period | Count distinct |
18 | This Period - Average Topic Count Per Agent | This Period - Average Topic Count Per Agent | Number |
This view provides information about participants associated with conversations.
Item | Field Label | Description | Type |
|---|---|---|---|
1 | Agent Id | Agent Id | String |
2 | Agent Name | Agent Name | String |
3 | Customer Id | Customer Id | String |
4 | Customer Name | Customer Name | String |
5 | Total Agents | Total Agents | Count distinct |
6 | Total Customers | Total Customers | Count distinct |
This view provides information about base scorecard evaluations.
Item | Field Label | Description | Type |
|---|---|---|---|
1 | Conversation Id | Conversation Id | String |
2 | Is Scorecard Auto_Fail (Yes / No) | Is Scorecard Auto_Fail | Yesno |
3 | Is Scorecard Evaluation Successful (Yes / No) | Is Scorecard Evaluation Successful | Yesno |
4 | Score | Score | Number |
5 | Scorecards Evaluation States | Scorecards Evaluation States | String |
6 | Scorecards Id | Scorecards Id | String |
7 | Scorecards Pass Score (Yes / No) | Scorecards Pass Score | Yesno |
8 | Scorecards Timestamp Date Date | Scorecards Timestamp | Date date |
9 | Scorecards Timestamp Date Hour | Scorecards Timestamp | Date hour |
10 | Scorecards Timestamp Date Month | Scorecards Timestamp | Date month |
11 | Scorecards Timestamp Date Time | Scorecards Timestamp | Date time |
12 | Scorecards Timestamp Date Week | Scorecards Timestamp | Date week |
13 | Scorecards Timestamp Date Year | Scorecards Timestamp | Date year |
14 | Scorecards Version | Scorecards Version | String |
15 | Tenant Id | Tenant Id | String |
16 | Agent Performance - Average Agent Performance | Agent Performance - Average Agent Performance | Average |
17 | Agent Performance - Auto Fails | Auto fails for the selected period | Count distinct |
18 | Agent Performance - Average Agent Performance | Agent Performance - Average Agent Performance | Average |
19 | Average Agent Performance | Average Agent Performance | Average |
20 | Count Auto Fails | Count Auto Fails | Count distinct |
21 | Date Range - Team Average Agent Performance | Date Range - Team Average Agent Performance | Average |
22 | Scorecard PassRange Reference | Average | |
23 | Team Performance - Auto Fails | Team Auto fails for the selected period | Count distinct |
24 | Team Performance - Team Average Agent Performance | Average | |
25 | Team Performance - Team Average Agent Performance | Team Performance - Team Average Agent Performance | Number |
26 | This Period - Auto Fails | Auto fails for the selected period | Count distinct |
27 | This Period - Average Auto Fail Count Per Agent | This Period - Average Auto Fail Count Per Agent | Number |
28 | This Period - Average Performance Score | This Period - Average Performance Score | Average |
29 | Total Scorecard Score | Total Scorecard Score | Sum |
This view provides information about the scorecard question evaluations.
Item | Field Label | Description | Type |
|---|---|---|---|
1 | Conversation ID | Conversation ID | String |
2 | Parent Section Id | Parent Section Id | String |
3 | Scorecard ID | Scorecard ID | String |
4 | Sections ID | Sections ID | String |
5 | Sections Score | Sections Score | Number |
6 | Sections Timestamp Date Date | Sections Timestamp | Date date |
7 | Sections Timestamp Date Hour | Sections Timestamp | Date hour |
8 | Sections Timestamp Date Month | Sections Timestamp | Date month |
9 | Sections Timestamp Date Time | Sections Timestamp | Date time |
10 | Sections Timestamp Date Week | Sections Timestamp | Date week |
11 | Sections Timestamp Date Year | Sections Timestamp | Date year |
12 | Tenant ID | Tenant ID | String |
13 | Agent Average Scorecard Section Weightage | Agent Average Scorecard Section Weightage | Average |
14 | Agent Average Section Score | Agent Average Section Score | Average |
15 | Agent Section Score (%) | Agent Section Score (%) | Number |
16 | Team Average Scorecard Section Weightage | Team Average Scorecard Section Weightage | Average |
17 | Team Average Section Score | Team Average Section Score | Average |
18 | Team Section Score (%) | Team Section Score (%) | Number |
This view provides information about conversation sentiments.
Item | Field Label | Description | Type |
|---|---|---|---|
1 | Conversation Id | Conversation Id | String |
2 | End of Conversation Sentiment | End of Conversation Sentiment | String |
3 | Participant Id | Sentiment Participant Id | String |
4 | Tenant Id | Tenant Id | String |
5 | Average Customer Sentiments (Number) | Average Customer Sentiments (Number) | Average |
6 | Average Customer Sentiments (Text) | Average Customer Sentiments (Text) | Average |
7 | Customer Negative Sentiments (%) | Customer Negative Sentiments (%) | Number |
8 | Customer Neutral Sentiments (%) | Customer Neutral Sentiments (%) | Number |
9 | Customer Positive Sentiments (%) | Customer Positive Sentiments (%) | Number |
10 | Overall Conversation Sentiments | Overall Conversation Sentiments | Number |
11 | This Period - Total Conversations | This Period - Total Conversations | Count distinct |
12 | This Period - Total Customer Negative Conversations | This Period - Total Customer Negative Conversations | Count distinct |
13 | This Period - Total Customer Neutral Conversations | This Period - Total Customer Neutral Conversations | Count distinct |
14 | This Period - Total Customer Positive Conversations | This Period - Total Customer Positive Conversations | Count distinct |
This view provides information about sentiments journey.
Item | Field Label | Description | Type |
|---|---|---|---|
1 | Conversation Chunk Sentiment | Conversation Chunk Sentiment | String |
2 | Conversation Chunk Sentiment Participant Id | Conversation Chunk Sentiment Participant Id | String |
3 | Conversation Chunk Sentiment offset | Sentiment Chunk offset | Number |
4 | Tenant Id | Tenant id | String |
5 | Average Agent Conversation Sentiment | Average Agent Conversation Sentiment | Average |
6 | Average Customer Conversation Sentiment | Average Customer Conversation Sentiment | Average |
This view provides information about agent performance.
Item | Field Label | Description | Type |
|---|---|---|---|
1 | Facts Id | Topic Id | String |
2 | Facts List Results | Facts List Results | String |
3 | Facts Result Id | Facts Result Id | String |
4 | Facts String Results | Facts String Results | String |
5 | Topic List | Topic List | String |
6 | Agent Performance - Topic Count for Agent | Agent Topic Count for selected period | Count distinct |
7 | Count of Conversation Per Topics | Count of Conversation Per Topics | Count distinct |
8 | Count of Conversation Per Topics(Agent) | Count of Conversation Per Topics(Agent) | Count distinct |
9 | Count of Conversation Per Topics(Team) | Count of Conversation Per Topics(Team) | Count distinct |
10 | Date Range - Count of topic | Date Range - Count Of topic | Count distinct |
11 | Team Performance - Topic Count for Team | Team Performance - Topic Count for Team | Count distinct |
12 | This Period - Average Topic Count Per Agent | This Period - Average Topic Count Per Agent | Number |
13 | Total number of topic | Total number of topics | Count distinct |
This view provides information about conversation topics.
Item | Field Label | Description | Type |
|---|---|---|---|
1 | Facts Id | Topic Id | String |
2 | Facts List Results | Facts List Results | String |
3 | Facts String Results | Facts String Results | String |
4 | Topic List | Topic List | String |
5 | Agent Performance - Topic Count for Agent | Agent Performance Count for selected period | Count distinct |
6 | Count of Conversation Per Topics | Count of Conversation Per Topics | Count distinct |
7 | Count of Conversation Per Topics (Agent) | Count of Conversation Per Topics (Agent) | Count distinct |
8 | Count of Conversation Per Topics (Team) | Count of Conversation Per Topics (Team) | Count distinct |
9 | Date Range - Count of topic | Date Range - Count Of topic | Count distinct |
10 | Team Performance - Topic Count for Team | Team Topic Count for selected period | Count distinct |
11 | This Period - Average Topic Count Per Agent | This Period - Average Topic Count Per Agent | Number |
12 | Total number of topic | Total number of topics | Count distinct |
Item | Field Label | Description | Type |
|---|---|---|---|
1 | Facts Id | Topic Id | String |
2 | Facts Result Id | Facts Result Id | String |
3 | Topic Name | Topic Values | String |
Item | Type | Field Label | Description | DataType |
|---|---|---|---|---|
1 | Dimensions | Alert Recipient | Indicates the user who received the alert, such as an Agent or Supervisor. | String |
Alert Type | Indicates category of the alert generated during conversation, such as Critical, Warning, or Information. | String | ||
2 | Measures | Average Alerts per Conversation | The average number of alerts generated per conversation within the selected reporting period. | Number |
Total Agent Received Alerts | The total number of alerts that were delivered to agents during the selected reporting period. | Number | ||
Total Alerts Count | The total number of alerts generated across all conversations. | Number | ||
Total Supervisor Received Alerts | The total number of alerts notified to supervisors. | Number |
Item | Type | Field Label | Description | Type |
|---|---|---|---|---|
1 | Filter-only fields | Average Conversations Per | Selects the dimension used to calculate and display average conversation metrics.
| String |
Conversation Start Date | The date and time when a conversation was initiated. | Date | ||
Interval | Specifies the time interval used to group and display conversation data in reports and visualizations.
| String | ||
2 | Dimensions | |||
Agent ID | The unique identifier assigned to an agent. | String | ||
Conversation Channel | Categorizes conversations by channel type Chat or Voice. | String | ||
Conversation Duration (seconds) | The total duration of the conversation, measured in seconds. | Number | ||
Conversation ID | The internal unique identifier assigned to a conversation. | String | ||
Conversation Provider | Identifies the platform or provider through which the conversation was conducted. | String | ||
Conversation Start Date | Start date/time of the conversation in the user's timezone. | Date or Time | ||
Conversation State | Indicates the current status of the conversation, such as Active or Ended. | String | ||
Conversation Type | Indicates the type of conversation, such as Chat or Voice. | String | ||
Dynamic Date | Displays the date grouped according to the selected Interval. Use this field as the X-axis in trend charts to visualize conversation metrics over time. | String | ||
Environment | Indicates the environment in which the conversation was processed, such as Dev or Test. | String | ||
Is Conversation Active (Yes/No) | Indicates whether the conversation is currently active. A value of Yes is displayed when the conversation state is CONVERSATION_STATE_ACTIVE; otherwise, the value is No. | Yes_No | ||
Language | Language of the conversation. | String | ||
Session ID | The external or session identifier associated with the conversation. | String | ||
3 | Measures | % Transcripts Processed Rate | The percentage of conversations for which a transcript was successfully processed and generated | Number |
Average ACW Duration (seconds) | The average time Agents spend completing post-call activities after a conversation ends, measured in seconds. | Number | ||
Average Conversation Duration (hh:mm:ss) | The average length of conversations, displayed in hours:minutes:seconds (HH:MM:SS) format. | Number | ||
Average Conversation Duration (seconds) | The average length of conversations, measured in seconds. | Number | ||
Average Conversations per Agent | The average number of conversations handled by each Agent during the selected time period. | Number | ||
Average Conversations per Day | The average number of conversations handled each day during the selected time period. | Number | ||
Average Conversations per Experience | The average number of conversations associated with each experience during the selected time period. | Number | ||
Dynamic Avg Conversation | The average number of conversations based on the selected aggregation basis (Day, Agent, or Experience). | Number | ||
Total Chat Conversations | The total number of unique chat conversations during the selected time period. | Number | ||
Total Conversation | The total number of conversations during the selected time period, including all conversation types. | Number | ||
Total Voice Conversations | The total number of unique voice conversations during the selected time period. | Number |
Item | Type | Field Label | Description | Data Type |
|---|---|---|---|---|
1 | Dimensions | Entity Detected By | The source of the entity detection, either the AI model or a human agent. | String |
Entity Name | The type or name of the detected entity, such as PHONE_NUMBER, DATE, or ACCOUNT_ID. | String | ||
2 | Measures | % Entity Detection Rate (AI) | Percentage of entity detections identified by the AI model. | Number |
Distinct Conversations with Entity | The number of unique conversations in which the entity was detected at least once. | Number | ||
Entity Occurrence Count | The total number of times the entity was detected across all conversations. | Number | ||
Total Conversations with Entity | The number of unique conversations in which at least one entity was detected. | Number |
Item | Type | Field Label | Description | Data Type |
|---|---|---|---|---|
1 | Dimensions | Entity Name | The display name of the detected entity, such as 'Customer Wireless Number'. | String |
Item | Type | Field Label | Description | Data Type |
|---|---|---|---|---|
1 | Dimensions | Experience Name | The display name of the experience or workflow. | String |
Item | Type | Field Label | Description | Data Type |
|---|---|---|---|---|
1 | Dimensions | Flow Name | The name of the flow that was triggered and executed during the conversation | String |
Flow Status | The completion status of the flow executed during the conversation, such as COMPLETED, ABANDONED, | String | ||
2 | Measures | Completed Flows | The total number of distinct flow executions that finished with a status of COMPLETED during the selected time period. | Number |
Flow Completion Rate | he percentage of flow executions that completed successfully during the selected time period. | Number | ||
Total Conversations with Flow | The number of unique conversations that triggered at least one flow during the selected time period. | Number | ||
Total Flow Count | The total number of distinct flow executions during the selected time period. | Number |
Item | Type | Field Label | Description | Data Type |
|---|---|---|---|---|
1 | Dimensions | Intent Detected By | Indicates whether the user’s intent during the conversation was identified by an AI model or by a human agent. | String |
Intent Label | The specific intent identified in the conversation, such as billing query, refund request, or other predefined categories that represent the user’s purpose or issue. | String | ||
Intent Type | The category of the detected intent (e.g., INTENT_TYPE_CALL_REASON). | String | ||
2 | Measures | % Intent Detection Rate (AI) | Percentage of conversations in which the AI model detected one or more intents. Apply the Intent Type filter to view results for a specific intent category, such as Call Reason. | Number |
Average Intents per Conversation | The average number of intents detected per unique conversation. | Number | ||
Total Conversations with Intent | The number of unique conversations in which at least one intent was detected. | Number | ||
Total Intent Occurrences | The total count of intent detections across all conversations. | Number |