Create a New Dashboard
You can generate a new analytics dashboard using a natural-language prompt.
From the Analytics page, select + Create Dashboard.
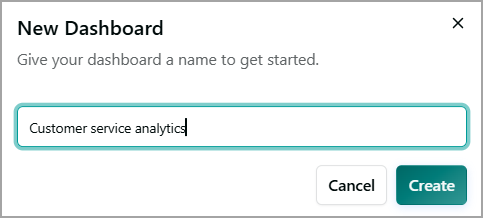
Enter the dashboard name and click Create.
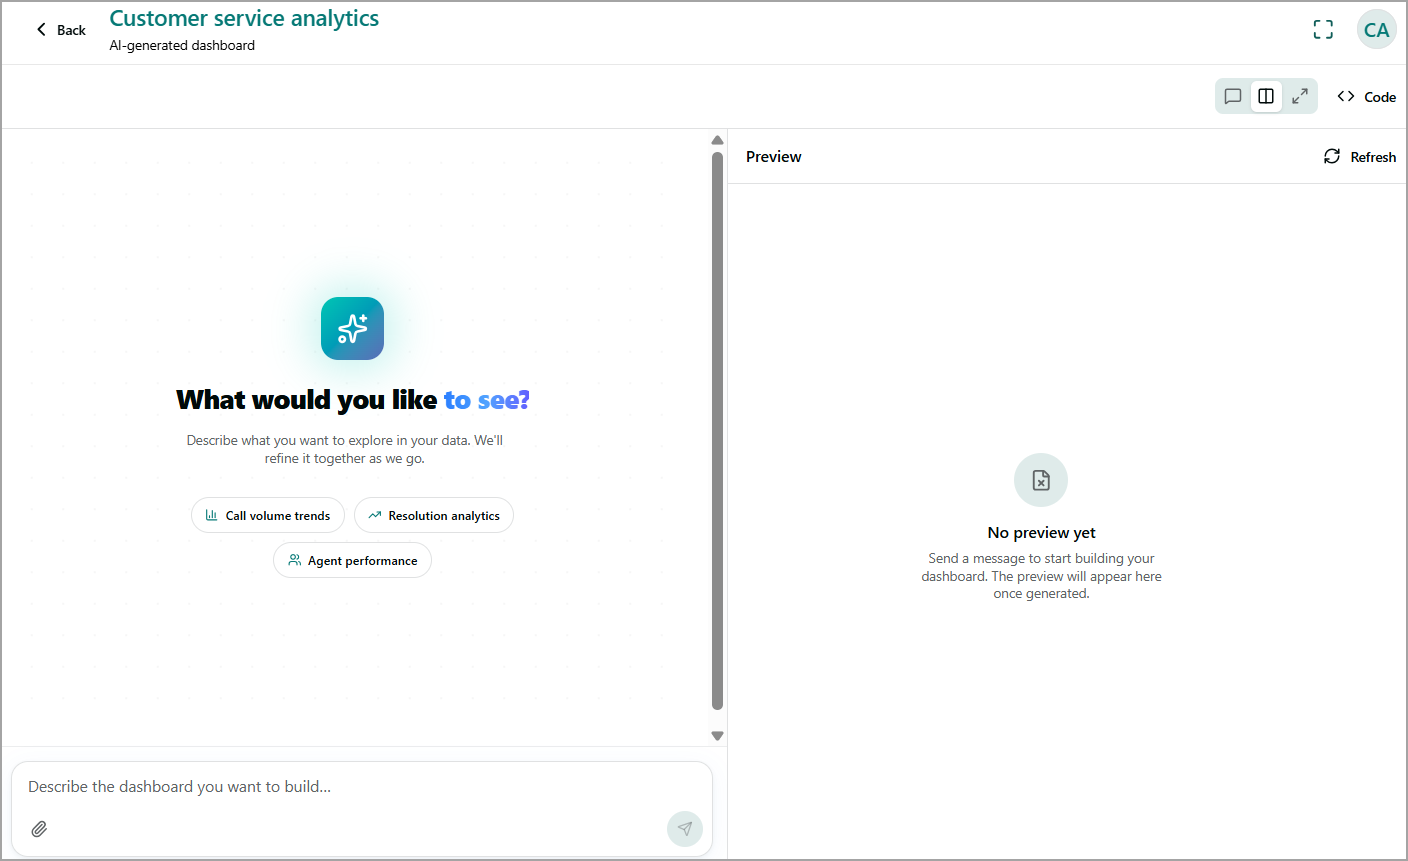
Enter a description of the dashboard you want to create in the Describe the dashboard you want to build... field. For example, show call volume trends, resolution rates, and AI agent performance for the selected period.
Alternatively, select one of the suggested prompts, such as:
Call volume trends - Analyze changes in call volume over time.
Resolution analytics - Analyze conversation resolution and outcomes.
Agent performance - Analyze the performance of AI agents.
Click Send. The system processes your request and generates the dashboard.
Review the generated dashboard in the Preview pane.
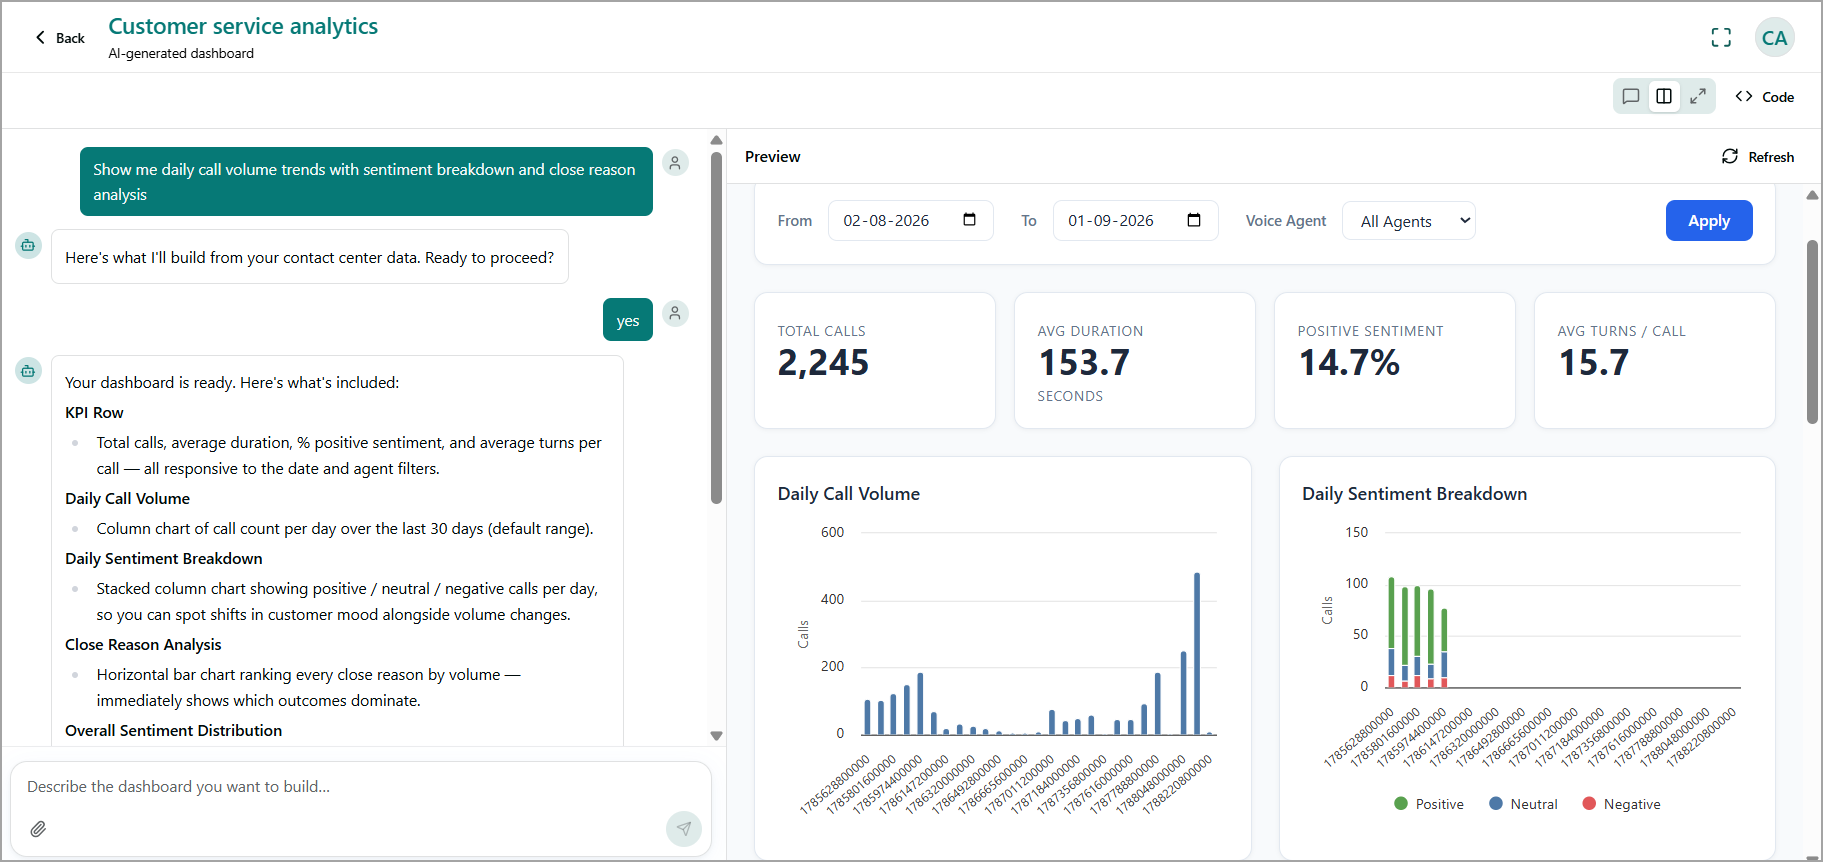
If required, refine the dashboard by entering another request in the input field and click Send again.
Click Refresh to refresh the dashboard preview.
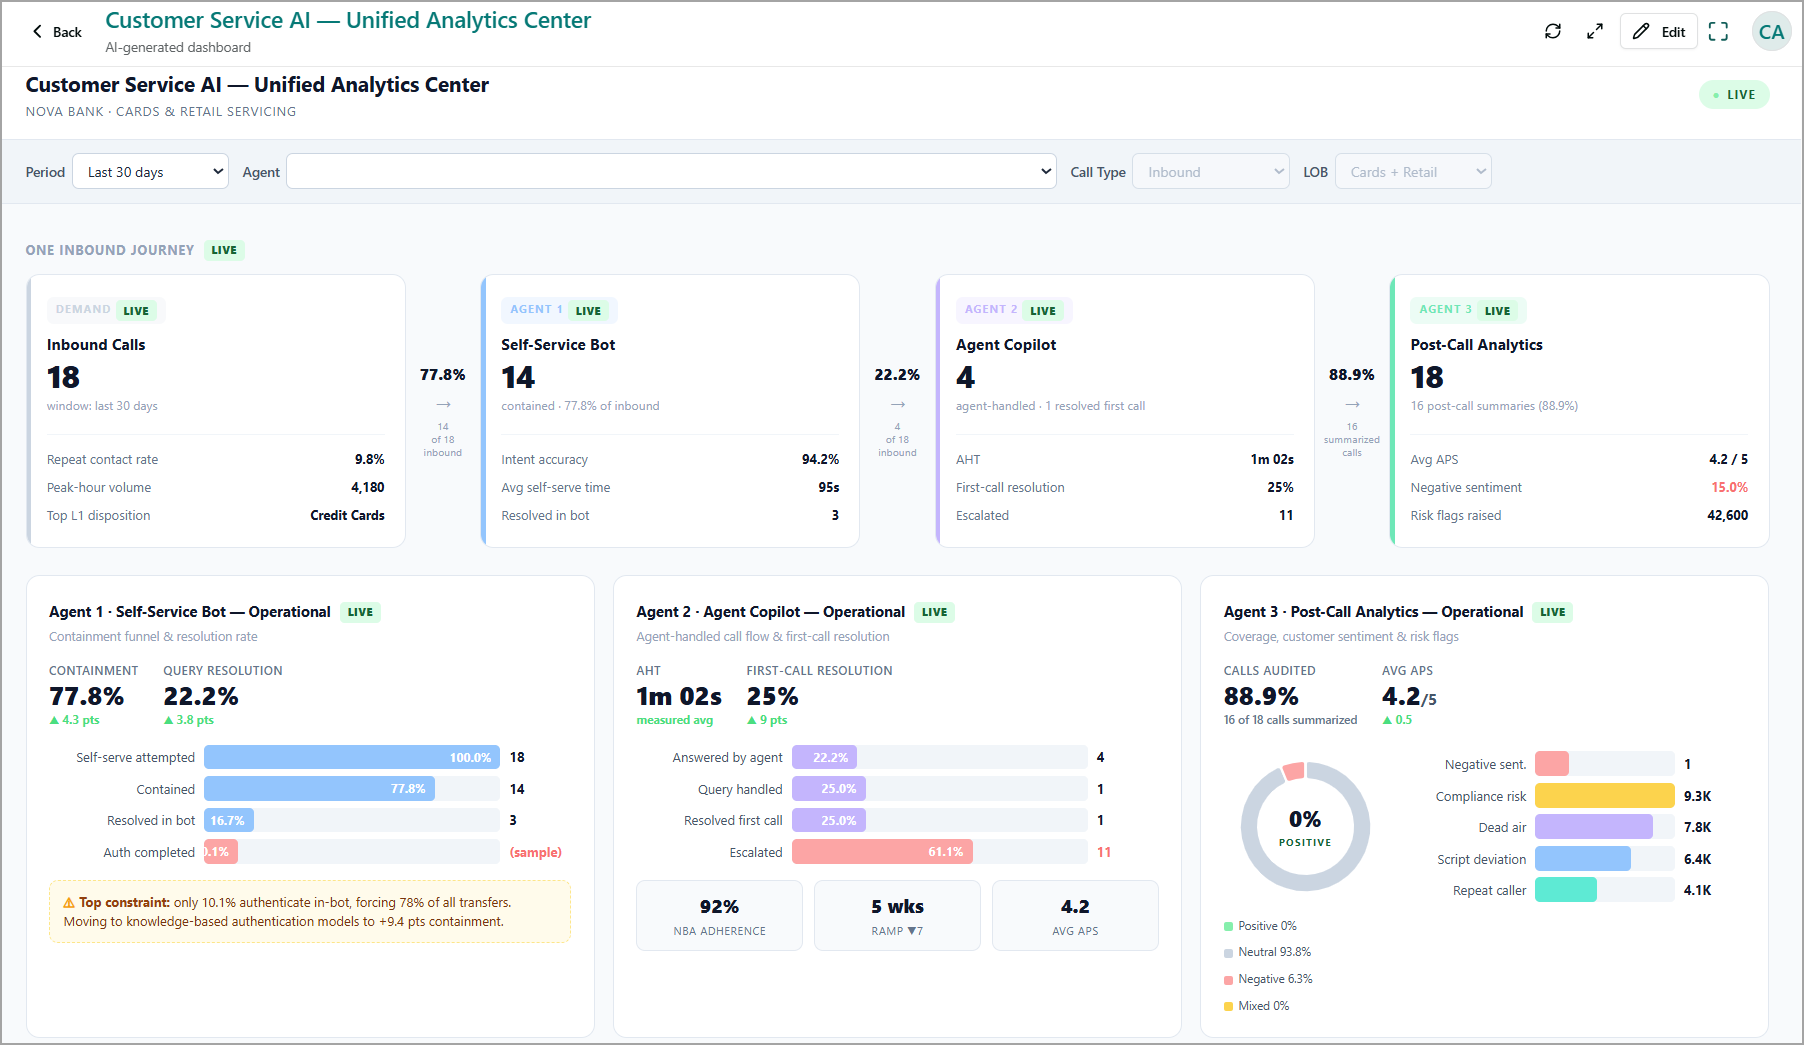
Below is a sample dashboard that provides a unified view of inbound call intake, Self-Service Bot containment, Agent Copilot escalations, and Post-Call Analytics.