Ask Your Data
Use Ask Your Data to query call center data using natural language and generate an AI-powered dashboard based on your request. You can ask questions about your data without navigating predefined reports or creating structured queries.
The system analyzes conversation data, including outputs generated by post-call analytics agents, and presents the results as relevant metrics and visualizations.
For example, you can ask, "What are the most common reasons for unresolved customer calls?"
Ask Your Data generates a dashboard based on your question, helping you explore results, identify trends, and gain insights from your call center data.
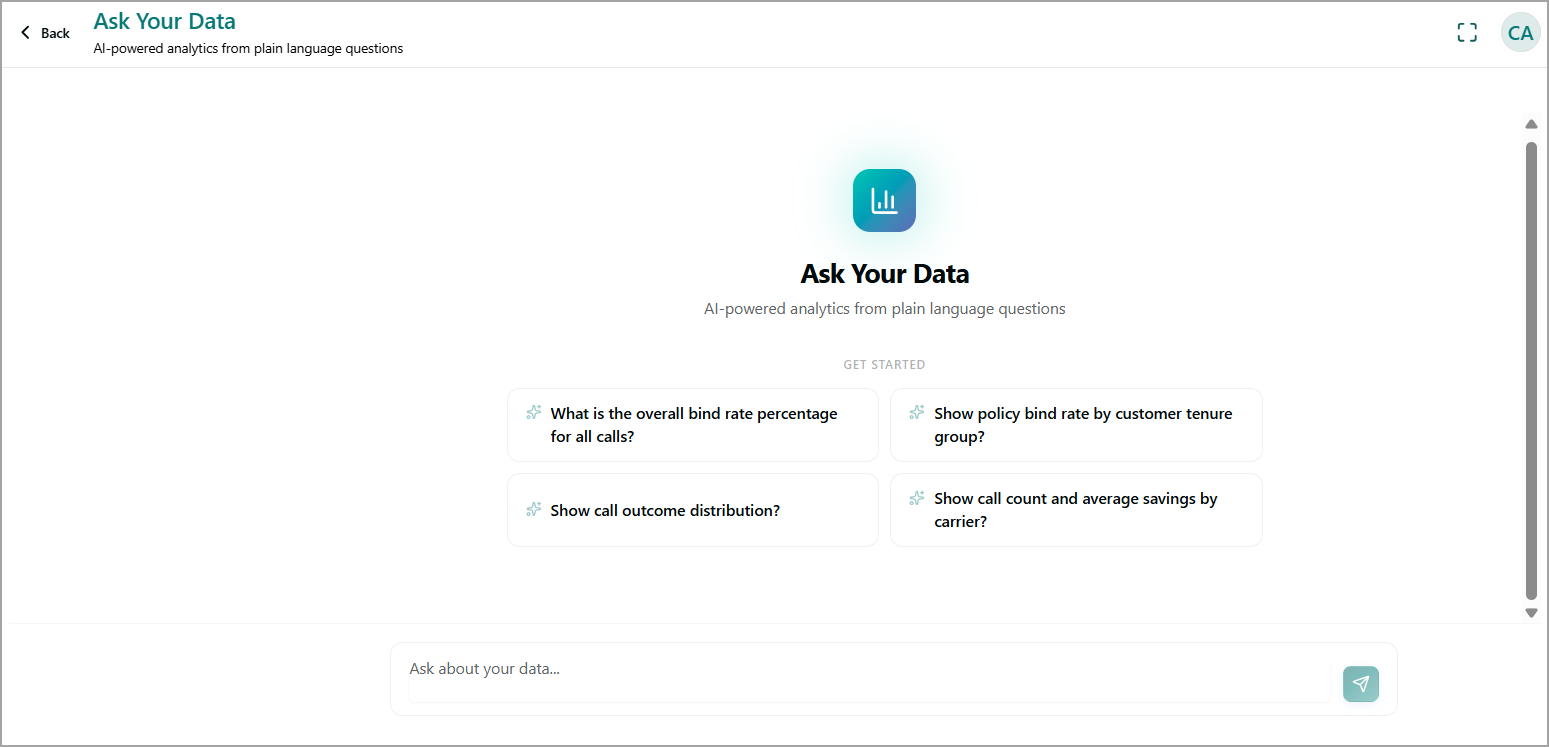
Get Started Suggestions
Use the Get Started suggestion cards to quickly query your call center data. These clickable example questions help you explore your data and get started with Ask Your Data without having to create a query from scratch.
The suggested questions are tailored to the use cases and data available in your workspace. For example, suggestions can include:
Bind rate percentage
Bind rate by customer tenure group
Call outcome distribution
Call count and average savings by carrier
Select a suggestion card to submit the question and generate the corresponding insights. The suggestions displayed in your workspace vary based on the data and use cases available to you.
Ask about your data
Use the Ask about your data… input bar to enter a natural-language question about your call center data. Type your question in the field and click Send  to submit it.
You can ask questions about conversation trends, outcomes, customer interactions, agent performance, or other data available in your workspace.
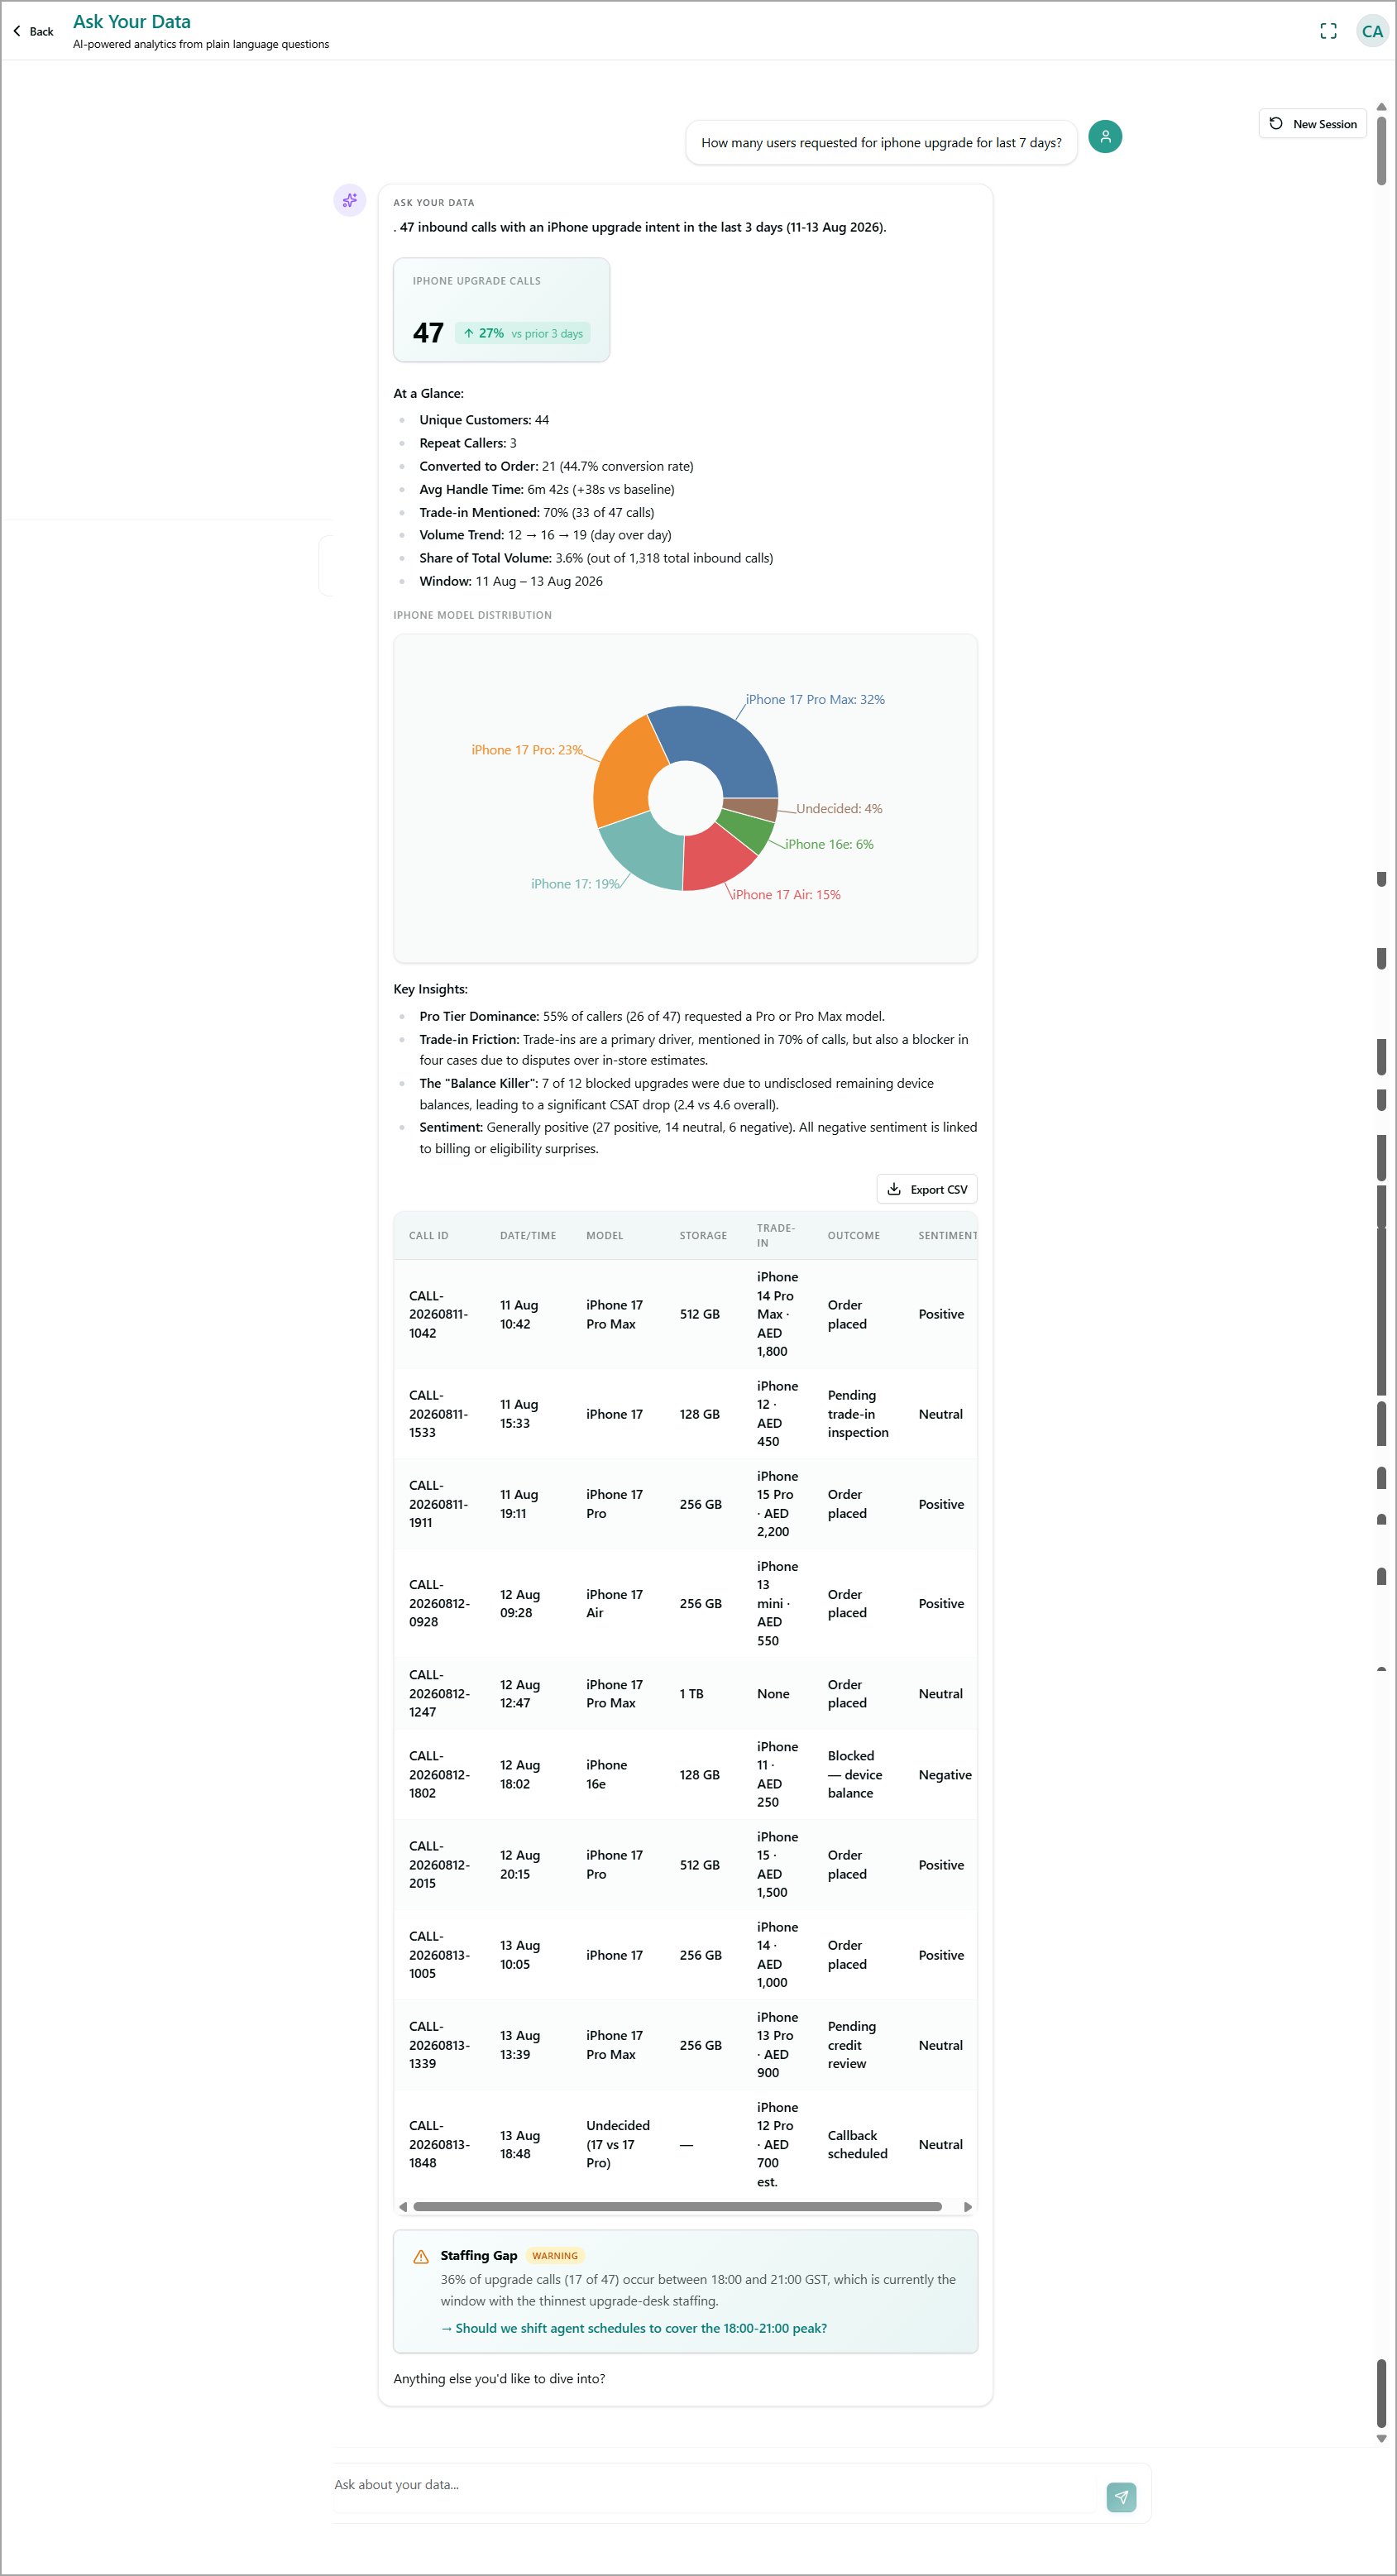
For example, enter “How many users requested an iPhone upgrade?” to view an AI-generated visual breakdown of the relevant data. The following image shows a sample visualization generated by Customer Service AI based on this question.
Important
Wait while Customer Service AI analyzes the underlying call and post-call agent data. More complex or broader questions can take longer to process because the system analyzes a larger number of conversation transcripts and associated data.
Review the Generated Result
Review the visual breakdown generated for your question. The result can include charts, category-based breakdowns, and key insights highlighted in text.
When relevant, the result can also include coaching-style observations. For example, the platform can identify when a large proportion of a specific call type occurs during a particular time period.
To refine the analysis or explore the data further, enter a follow-up question in the Ask about your data… input bar. You can continue the conversation by asking follow-up questions based on the generated result.
Create a Dashboard from a Result
After generating a result, you can save it to a dashboard for future reference.
Select the option to Save, Pin, or Add to dashboard for the generated result. The option is typically available near the generated chart.
Enter a name for the dashboard, or select an existing dashboard to add the result to it.
Repeat these steps for other questions and results that you want to track on the same dashboard.
Open your saved dashboards from the Analytics workspace to review your results without asking the same questions again.