About Analytics
Advanced Analytics is the reporting layer of Customer Service AI. It aggregates the outputs generated by post-call agents, such as Summary, Sentiment, Facts, and Scorecard, which run automatically after each conversation.
The Analytics page lets you create and view interactive analytics dashboards generated from natural-language prompts. Use these dashboards to analyze conversation data, identify trends, and gain insights into customer and agent interactions across self-service and human-agent conversations.
Access Analytics
From the left navigation pane, select Analytics.
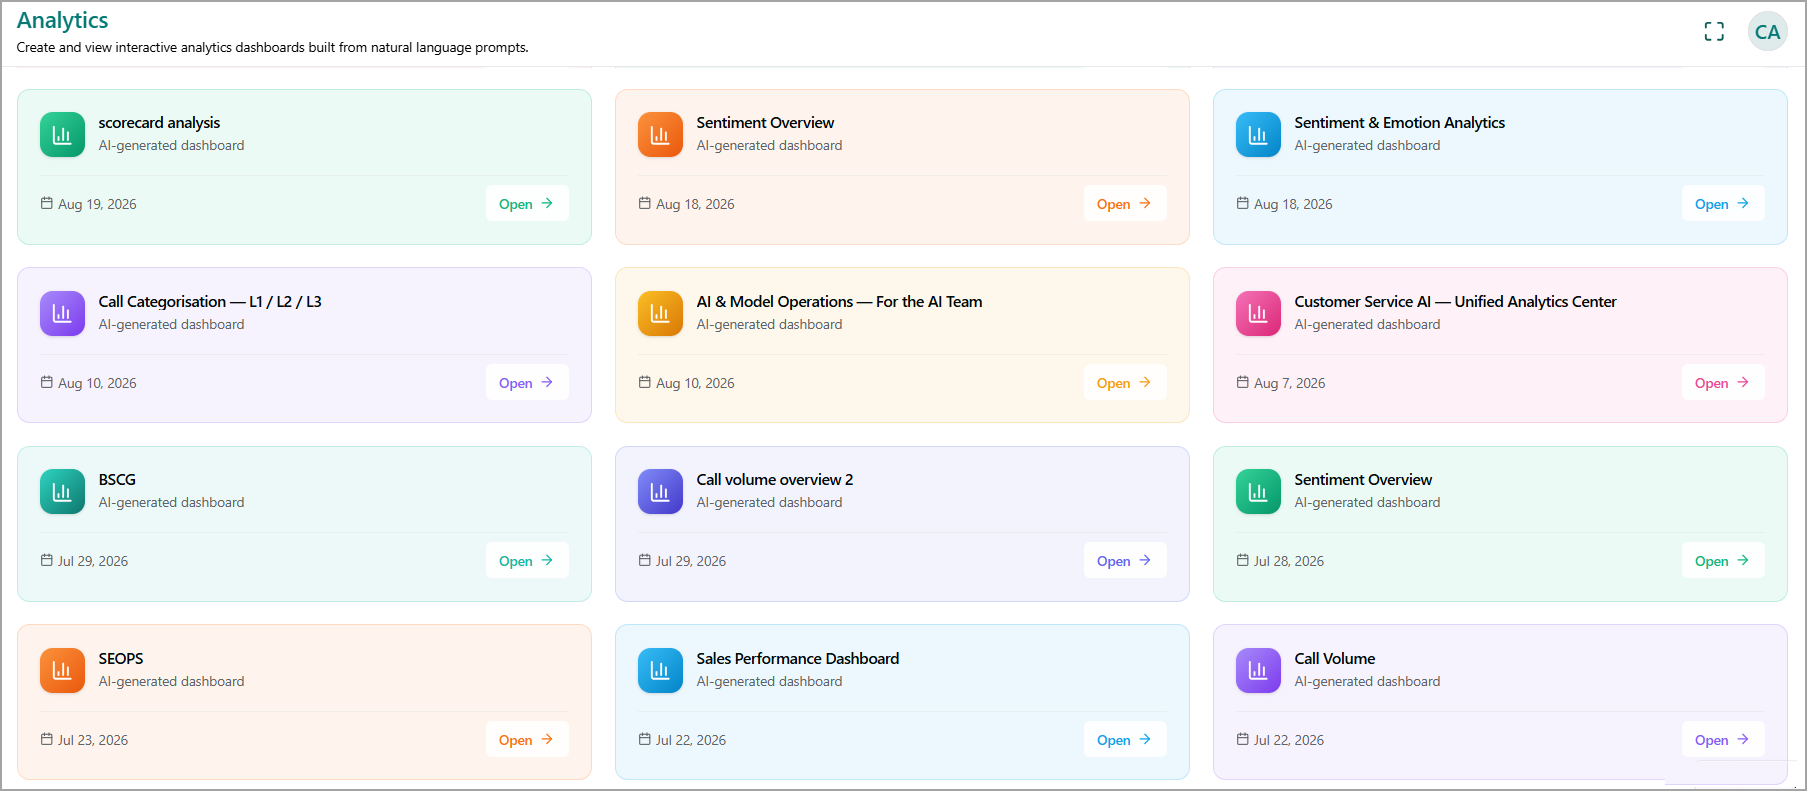
The Analytics page displays dashboards as cards. Each dashboard card includes:
Dashboard name - The name assigned to the dashboard.
Dashboard type - Identifies the dashboard as an AI-generated dashboard.
Created date - Displays the date the dashboard was created.
Open - Opens the dashboard to view its analytics and insights.
Search and Explore Dashboards
Review the available dashboard cards to find the dashboard you want to analyze. Select Open on a dashboard card to view its contents.
Dashboards can cover different analytics areas, such as:
Sentiment and emotion
Scorecards
Call categorization
Customer service analytics
AI and model operations
Other conversations and business metrics