Activities
The Activities tab shows the sales activity metrics for team members (number of emails, number of sales meetings, etc.).
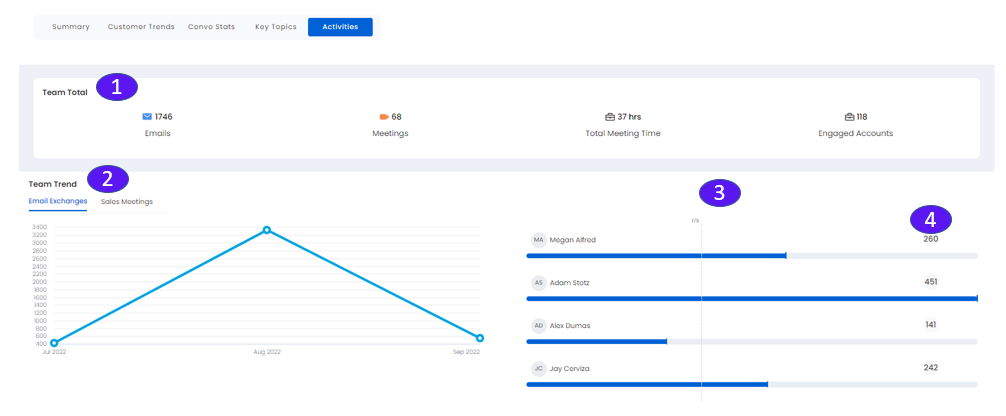
1. Team Total
Shows data for:
Emails: Number of emails during the period.
Sales Meetings: Number of sales meetings during the period.
Total Meeting Duration: Sum of all meeting duration during the period.
Number of accounts engaged: Number of client accounts engaged during the period.
2. Team Trend
Shows trending graphs and bar charts for:
Email exchanges: Number of emails.
Sales Meetings: Number of sales meetings.
3. Leaderboard
Team members (icon, name, and title) are ranked from high to low for both email exchanges and sales meetings. The team average is shown as a vertical line.
Click a team member’s icon to see their individual page.
Click a rep’s blue bar to see more information about their meetings related to emails and sales meetings.
4. Numeric Value of Team Trend
These numbers represent the value of the horizontal bar graph.