Visualization & Analysis
Explore every path, step, and performance driver.
The Orby Process Discovery dashboard provides three layers of visibility:
A Diagram view for understanding the full process and step-level time analysis. A Paths view to compare variants and discover unknown routes.
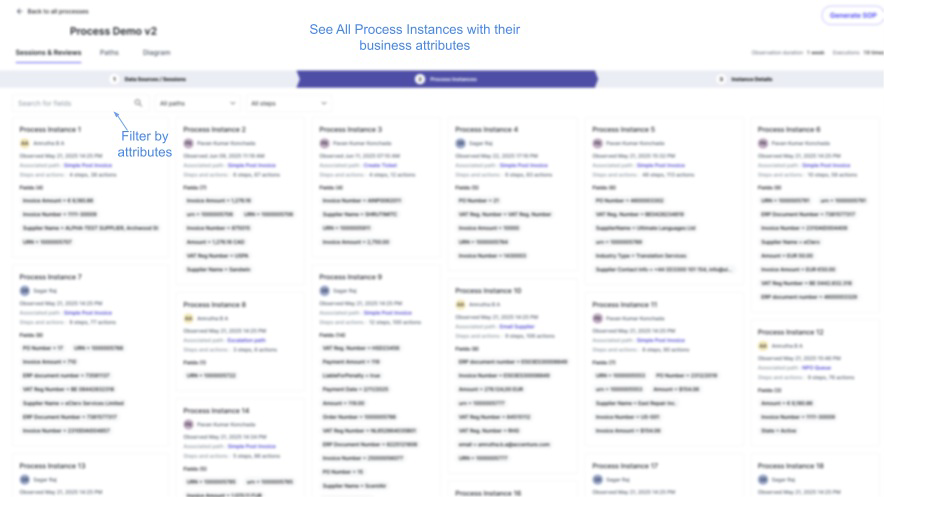
A Process Instance view to analyze specific executions with screenshots and business context.
Diagram View
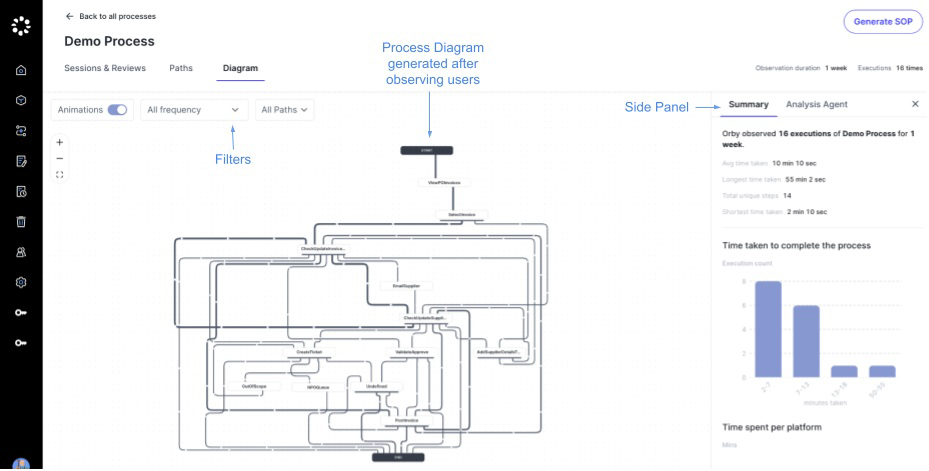
Full end-to-end process map with all observed steps.
View frequency and time spent per step.
Filter to show only the most common steps.
Side panel includes time distribution and platform-wise breakdowns.
 |
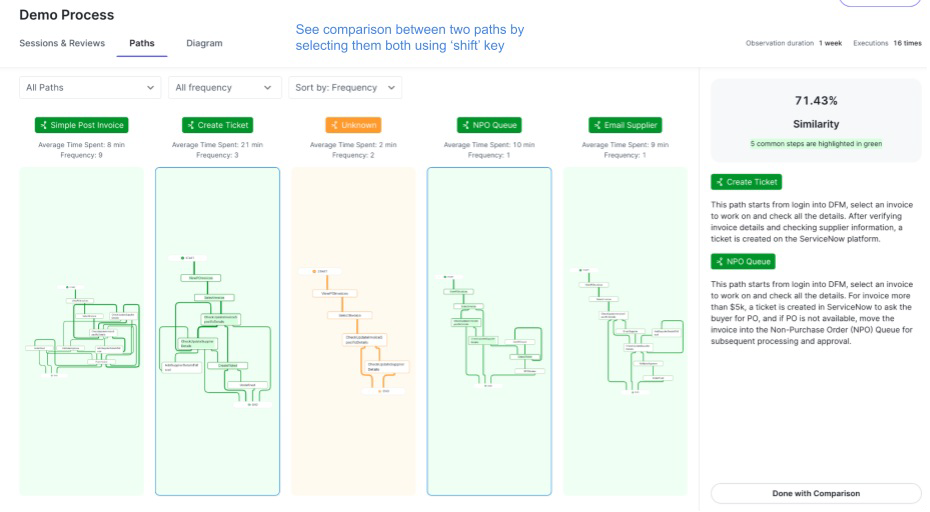
Paths View
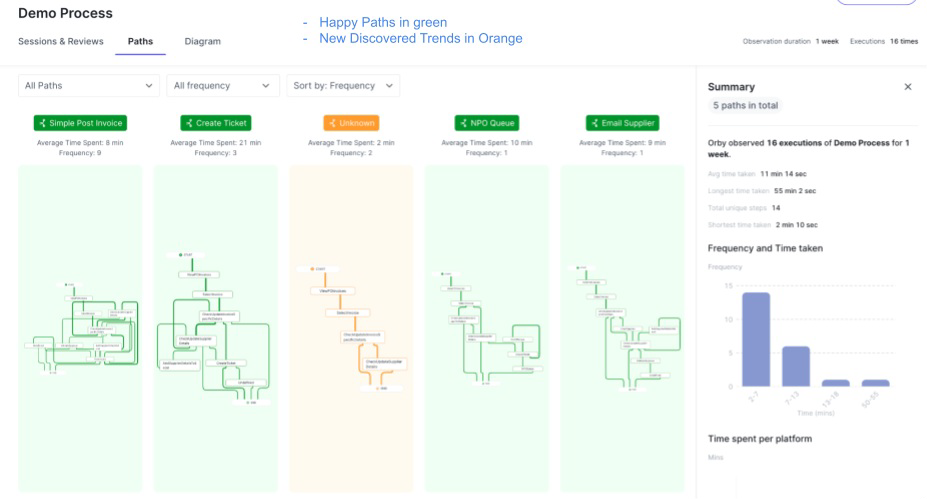
Shows all observed variants, including both Predefined paths (from setup) and automatically discovered ones.
Users can compare time taken, complexity, and step count for each path.
Process Instance View
Each discrete case (e.g., processing a single invoice) is shown as a separate instance.
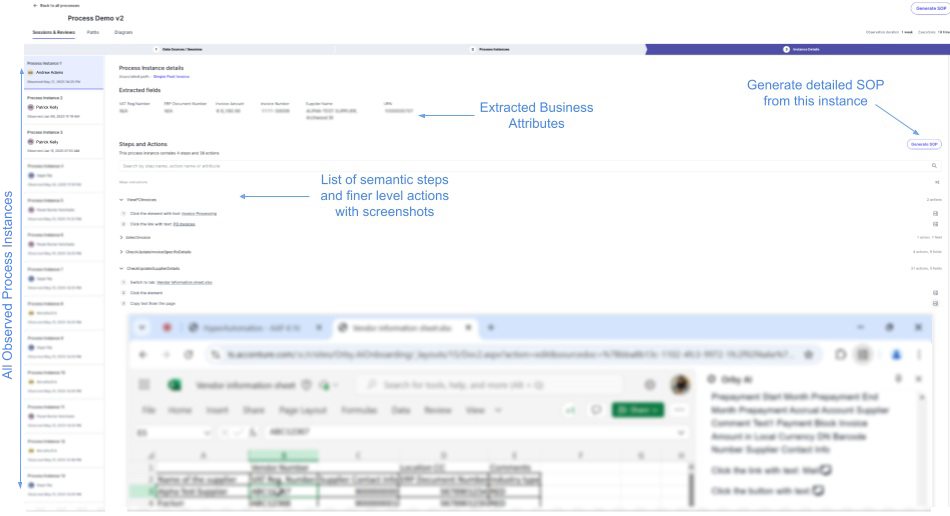
View step-by-step actions, time per action, and screenshots.
Business attributes (e.g., invoice number, priority, amount) are layered in for richer filtering and benchmarking.
Each process instance can also be used to generate a human-readable SOP, useful for documentation, training, or process handoff.