Viewing ROI Analysis
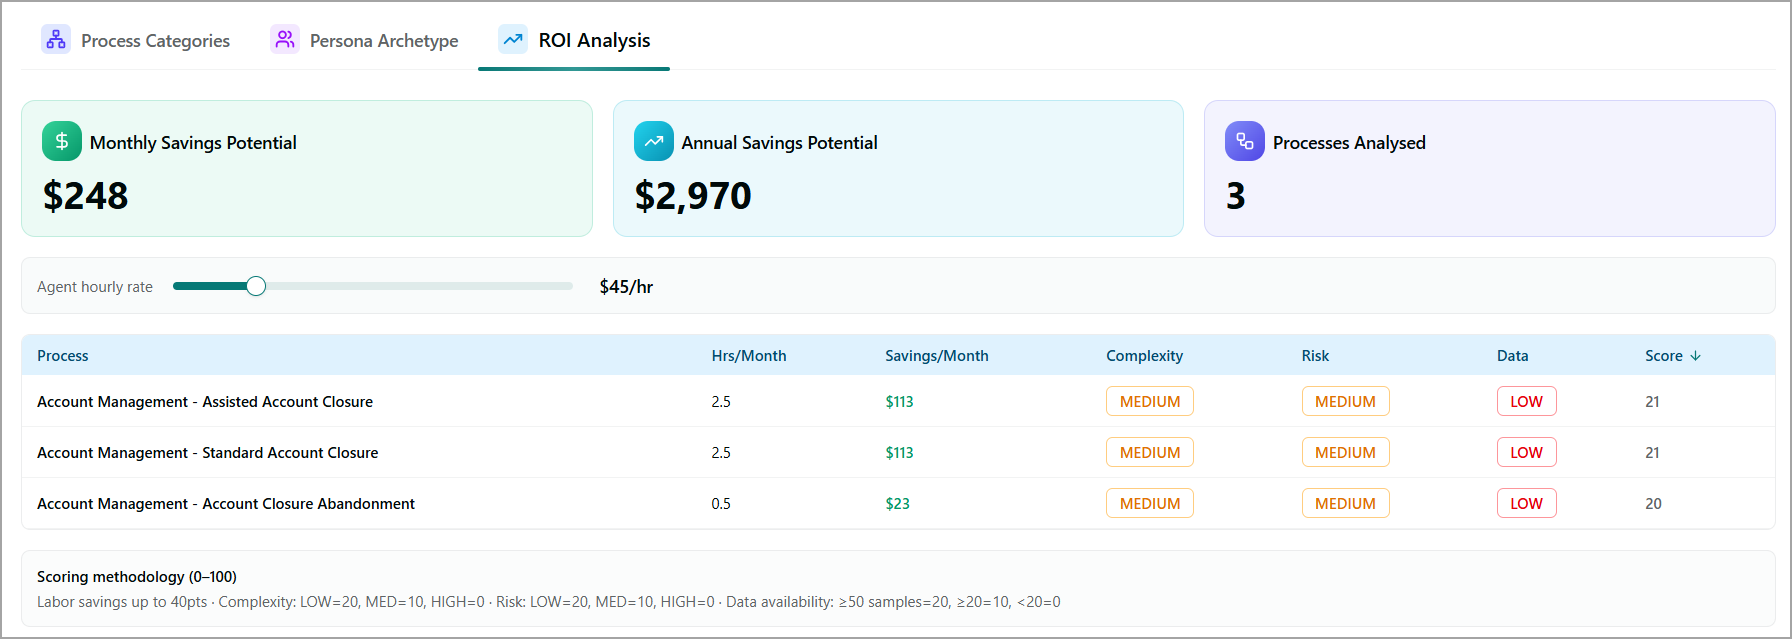
The ROI Analysis tab estimates the potential business value of automating the AI-discovered process categories. It calculates potential labor cost savings based on the selected agent's hourly rate and provides a comparative analysis of each process category using complexity, risk, data availability, and an overall automation score.
Use these insights to identify and prioritize process categories that offer the greatest return on investment (ROI) for automation.
Note
ROI estimates are generated from the analyzed conversation transcripts and the configured agent's hourly rate
ROI Summary:
The ROI summary displays the following metrics:
Monthly Savings Potential – Displays the estimated monthly labor cost savings that can be achieved by automating the analyzed process categories.
Annual Savings Potential – Displays the estimated annual labor cost savings based on the projected monthly savings.
Processes Analyzed – Displays the total number of process categories included in the ROI analysis.
Configure the agent's hourly rate:
Use the Agent hourly rate slider to specify the hourly cost of a customer service agent. As you adjust the hourly rate, the estimated monthly and annual savings are recalculated automatically.
ROI assessment:
The ROI assessment table provides the following information for each discovered process category:
Process – Displays the name of the discovered process category.
Hrs/Month – Displays the estimated number of agent hours spent on the process each month.
Savings/Month – Displays the estimated monthly labor cost savings if the process is automated.
Complexity – Indicates the estimated implementation complexity of automating the process.
Risk – Indicates the estimated business risk associated with automating the process.
Data – Indicates whether sufficient conversation data is available to support the analysis.
Score – Displays the overall automation priority score calculated for the process.
Click the Score column header to sort process categories by their automation score.
Scoring methodology:
The Scoring methodology section at the bottom of the page explains how the Score is calculated for each process category, with a maximum score of 100 points. The score is based on the following factors:
Labor savings - Contributes up to 40 points based on the labor savings the process would generate.
Complexity - Contributes 20 points for LOW complexity, 10 points for MEDIUM, and 0 points for HIGH.
Risk - Contributes 20 points for LOW risk, 10 points for MEDIUM, and 0 points for HIGH.
Data availability - Contributes 20 points for 50 or more transcript samples, 10 points for 20–49 samples, and 0 points for fewer than 20 samples.