Monitoring
Communication Recording Agent monitoring involves proactively identifying potential risks to conversation recording in order to ensure data integrity and minimize the chances of undetected recording failures. Monitoring Communication Recording Agent systems enables visibility into the successful capture and integrity of conversation recordings and detects issues that could lead to breaches or data loss.
This article details how monitoring occurs for Communication Recording Agent systems, what's monitored and why, and outlines the incident handling processes in place.
Dashboards
The majority of monitoring is internal and managed between Uniphore Support teams. Most issues and incidents are internally detected and resolved without any impact or noticeable service interruption to customers. While most of the monitoring metrics are internal facing, Communication Recording Agent provides its users with two 'out of the box' dashboards that provide an overview of the conversations and policies in the system. The dashboards provide key metrics and graphical chart displays that reflect the conversations and policies in the system.
For more information on Communication Recording Agent dashboards, click here.
Policies Dashboard
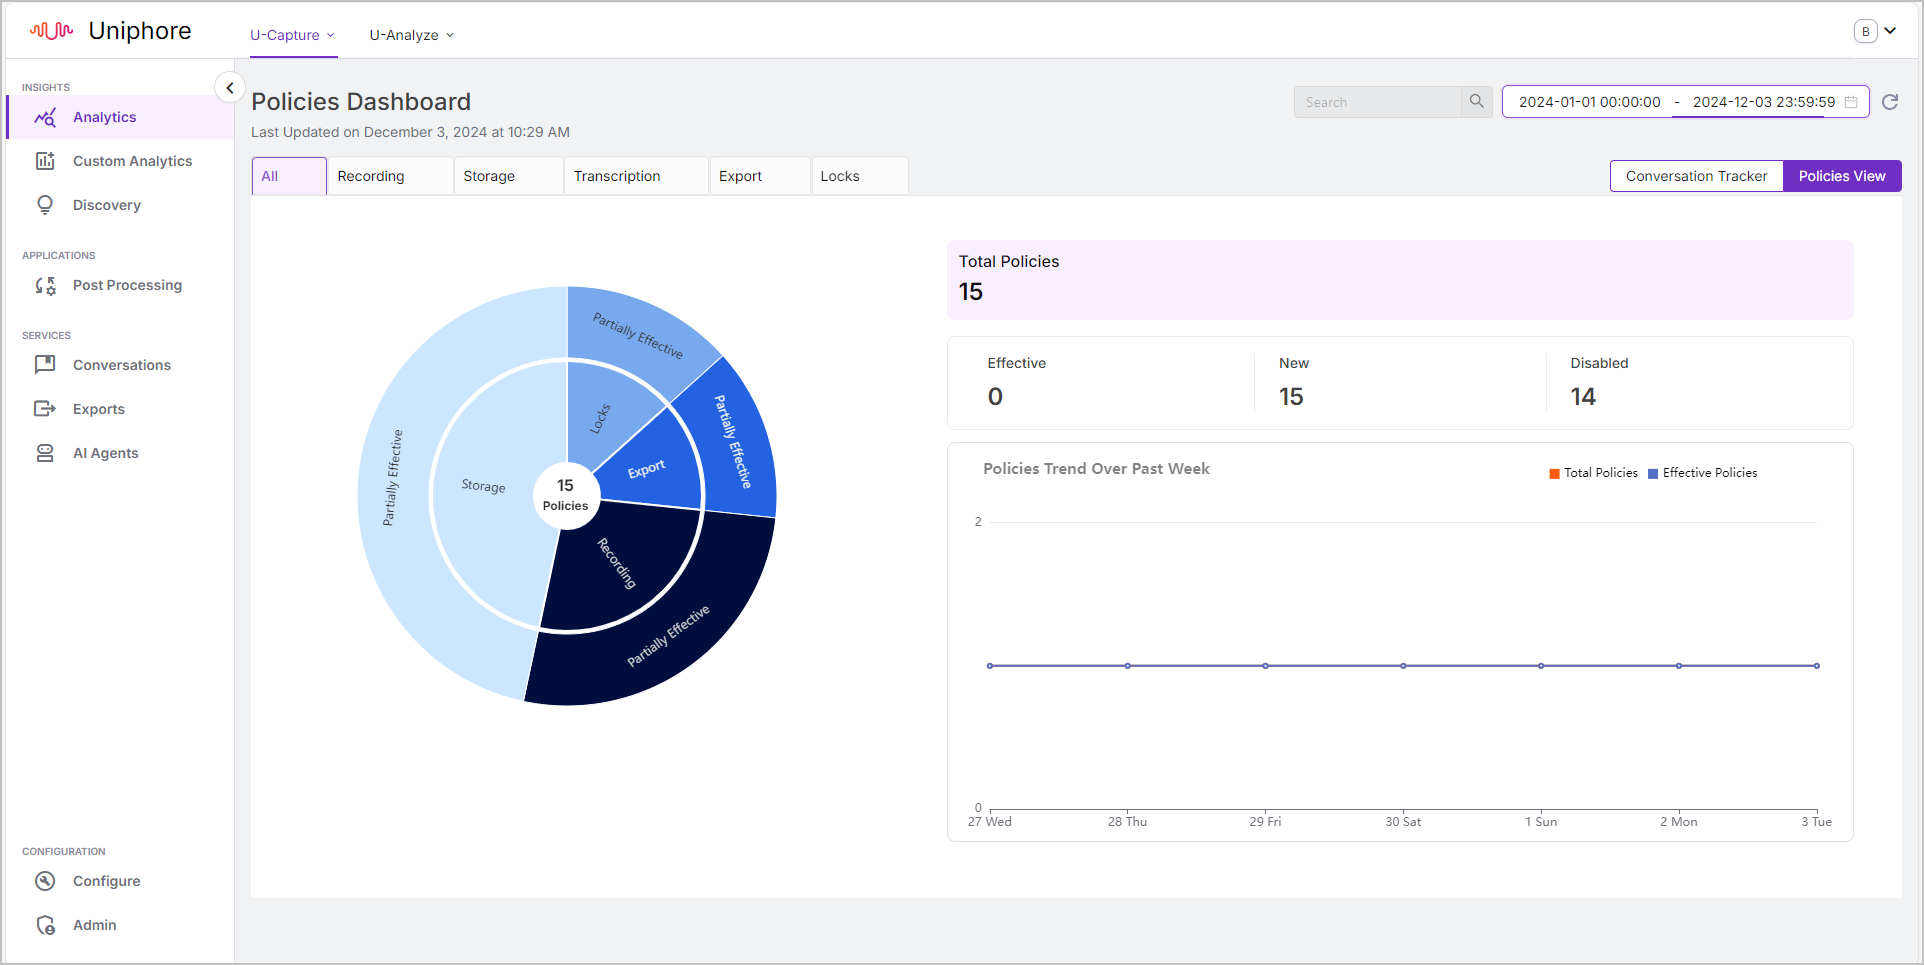
Use the Policies Dashboard to view an overview of your policies by category, including their count and effectiveness. You can also see the total number of policies, the total number of effective, new, and disabled policies in the system, and your policy effectiveness over past weeks.
Conversation Capture Dashboard
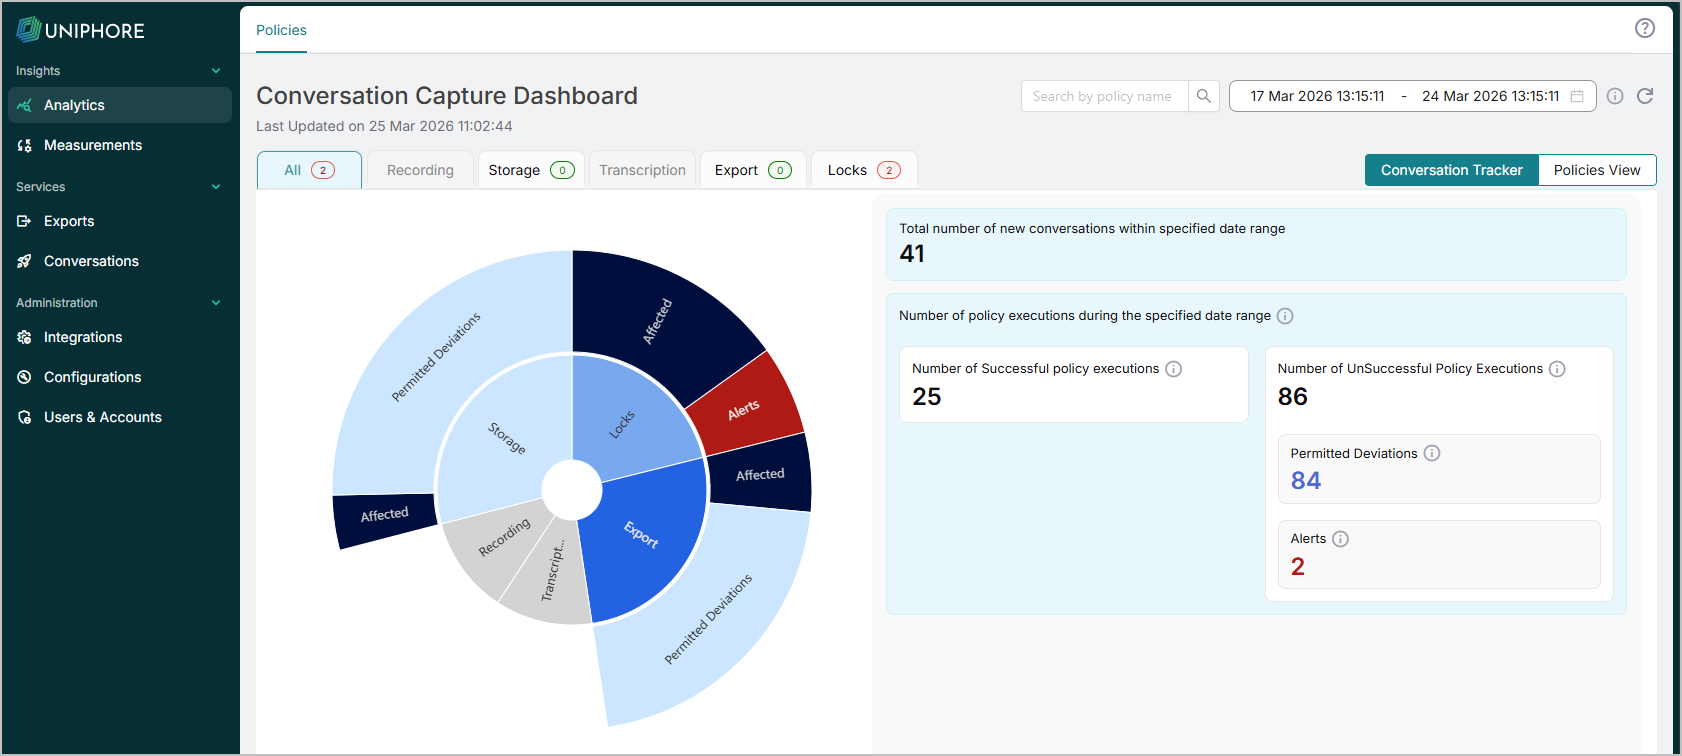
Use the Conversation Capture Dashboard to get information about your conversations, see the total number of conversations in the system, how many conversations are affected by each policy category, any exceptions, and any alerts. You can also see the total number of conversations without policies affecting them.
Internal Monitoring
Uniphore Support teams continuously monitor the Administration Platform along with the applications running on it. As mentioned, the majority of monitoring is internal and managed between Uniphore Support teams. Most issues and incidents are internally detected and resolved without any impact or noticeable service interruption to customers. The lists below outline the internal metrics monitored by our Support teams for the Software as a Service (SaaS) application Communication Recording Agent.
Note
Potential enhancements to the monitoring service are found as part of the incident handling process, therefore the monitored systems and metrics are always improving over time. The below lists are accurate at the time of writing, however the monitoring service is always evolving to provide the best support possible.
Customer Dashboard Internal Monitoring
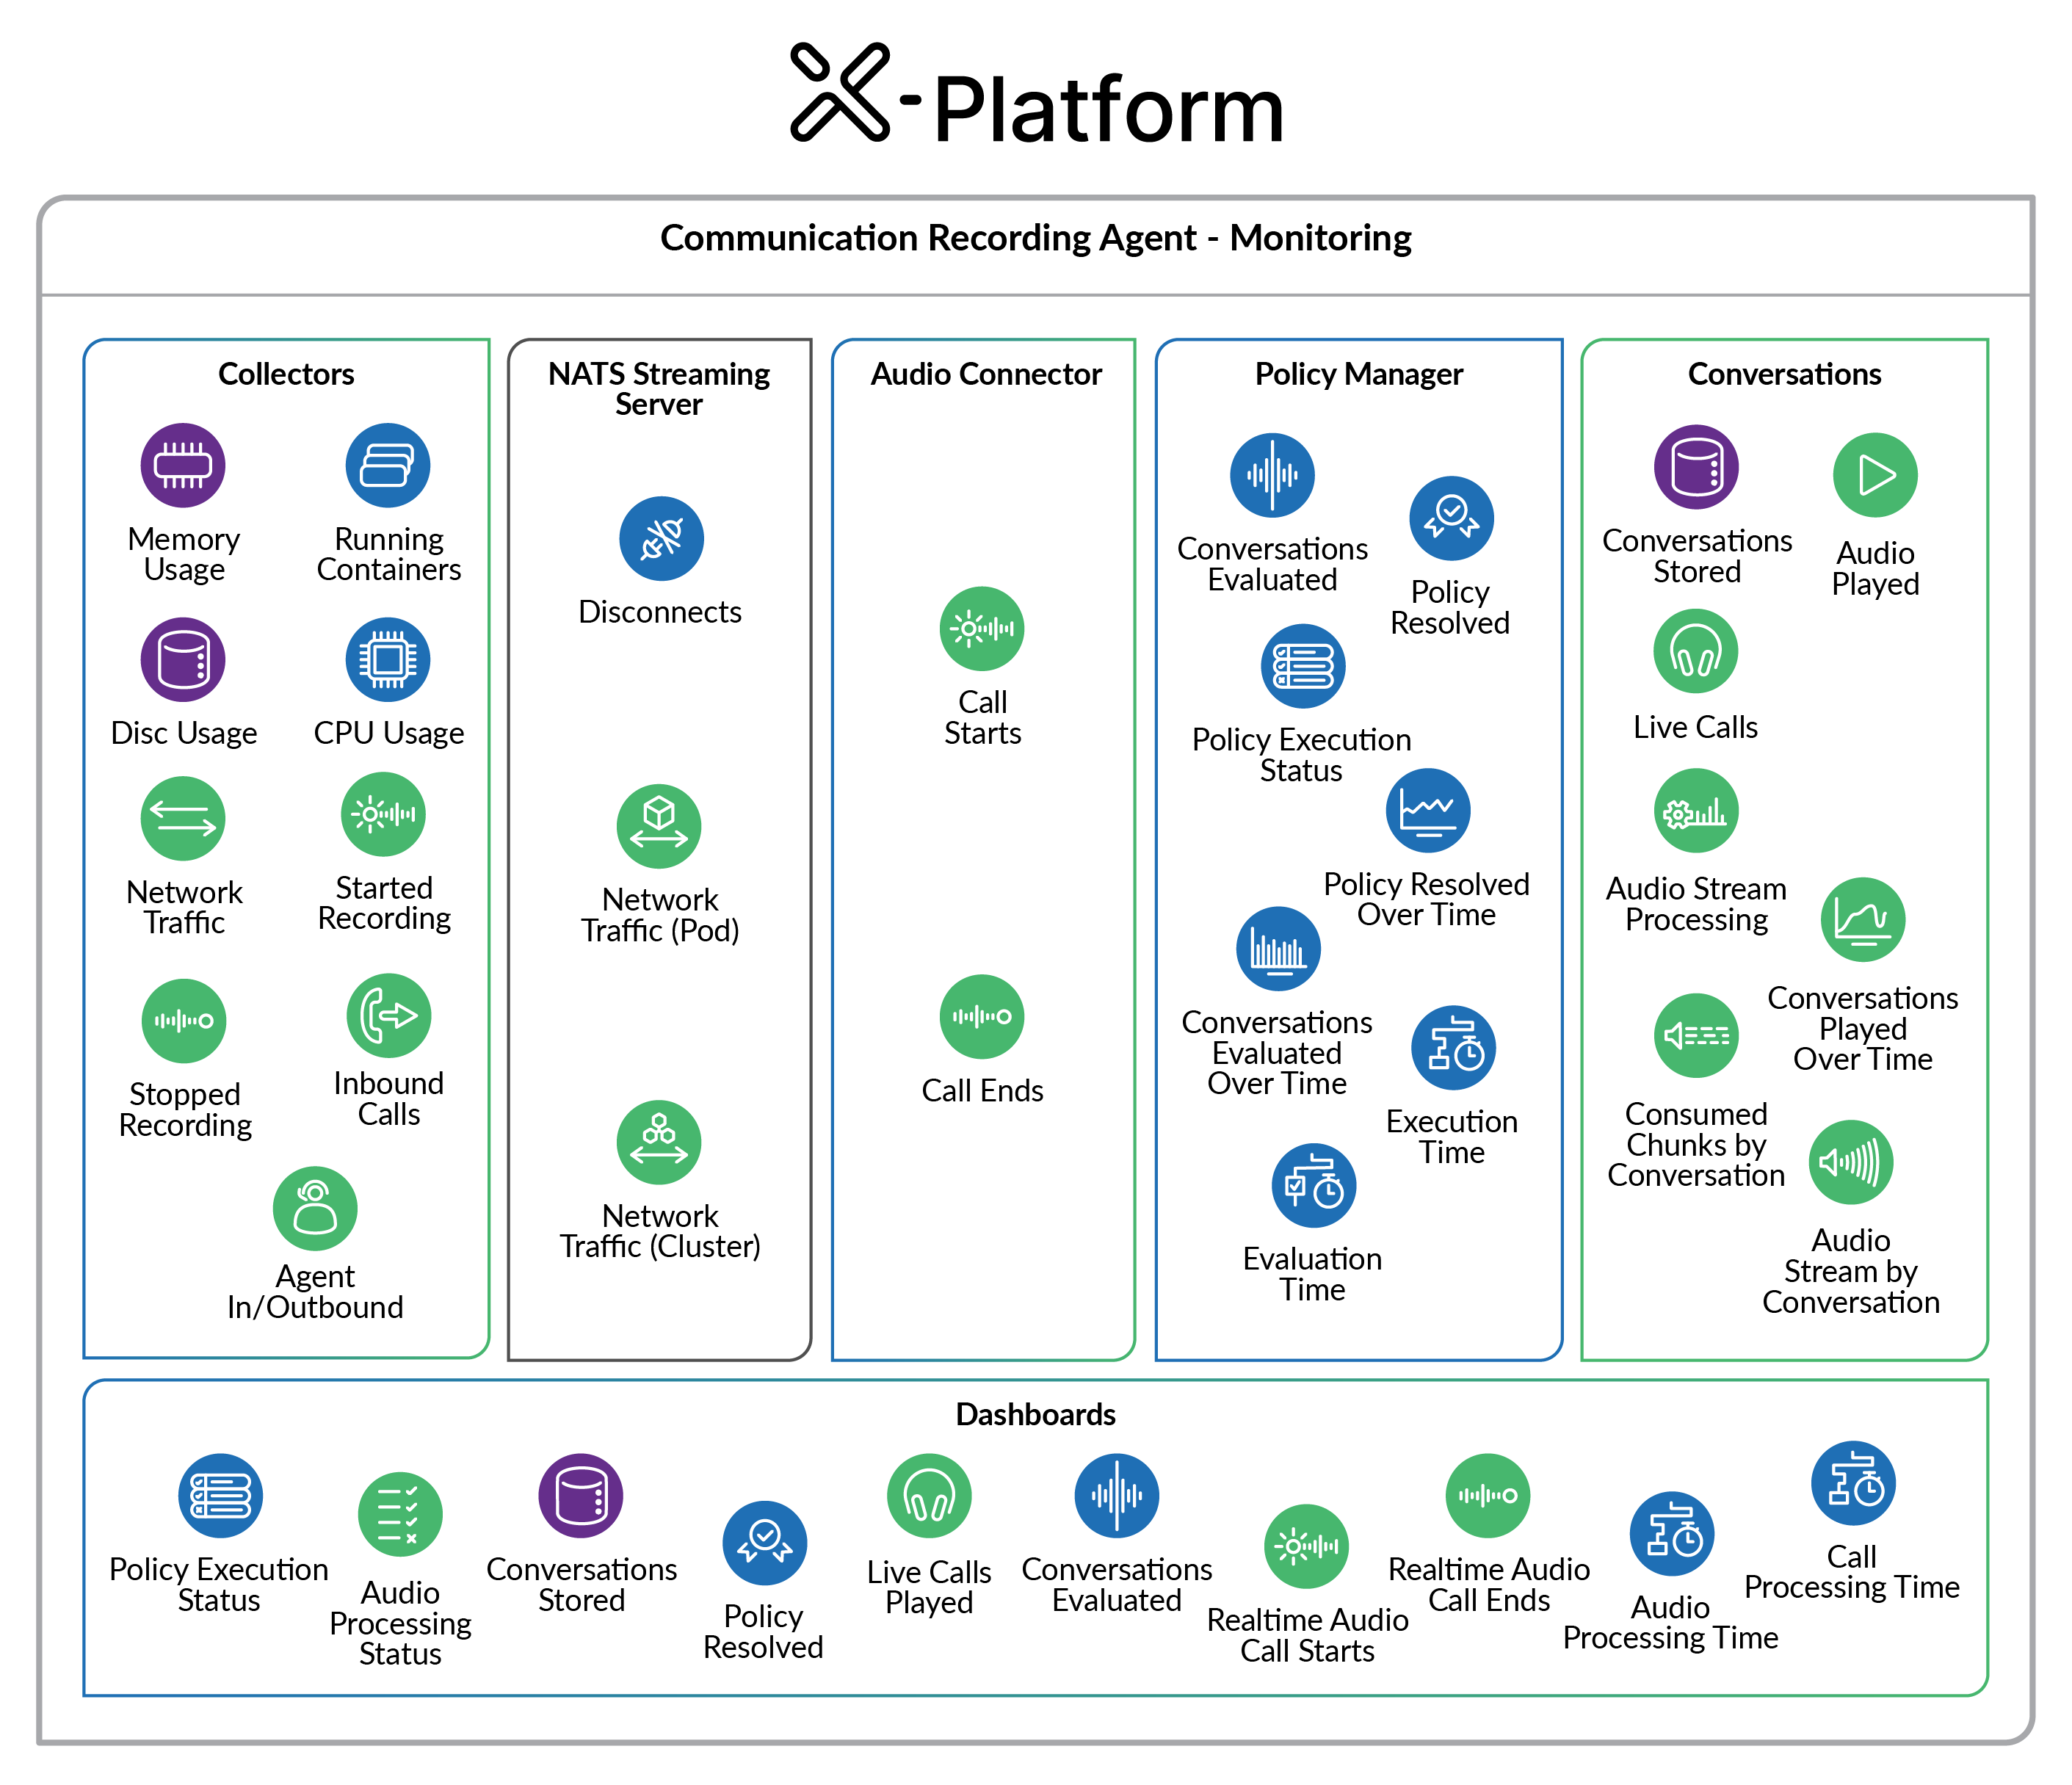
Uniphore Support teams monitor internal dashboards for the following data:
Policy Execution Status - The number of successful and/or failed policies, along with the total number of policies that have run. This is used to detect issues processing policies. More than 5 failed executions in a 15 minute window suggests Policy Engine or configuration issues, which may impact compliance and SLA reporting.
Tip
Policy execution status data is also available on the Policies dashboard in the UI.
Audio Processing Status - The number of successful and/or failed audio processing jobs, along with the total number of processing jobs that the system has completed. This is used to detect issues in audio processing. If more than 10% of processing jobs fail within a 5–10 minute window, it indicates a potential system-wide failure and will trigger an investigation.
Conversations Stored - The number of conversations stored is used to verify that calls are indeed being successfully captured and stored. This differs from all captured calls due to Block and Purge policies.
Policy Resolved - The total combined number of all policies that have been resolved. This should be the same number as successfully executed policies. A difference suggests a failed policy and would trigger an investigation.
Live Calls Played - The number of calls played in Live Monitor.
Conversations Evaluated - The number of Conversations evaluated against each policy. All conversations are evaluated to determine if they meet the criteria of each policy. Inconsistencies indicate the need for an investigation.
Real-time Audio Call Starts - When real-time audio streaming starts.
Real-time Audio Call Ends - When real-time audio streaming ends.
Audio Processing Time - The time taken to process audio. This is used to detect issues processing audio and may highlight issues in the system.
Call Processing Time - The time to process a conversation (audio and metadata). Unexpected processing time indicates issues while processing the conversation and may indicate underlying problems within the system.
Collectors
Collectors are a primary component for many call recording integrations. The following Collector data is monitored:
Memory Usage - A live graph of the memory usage of each Collector. Used to detect if there are memory issues.
Running Containers - Collectors are run in containers. The system stats of these containers are monitored. Used to detect wider issues not localized to a single container.
Disc Usage - The amount of disk space used by the Collector is monitored, and if it exceeds a defined usage threshold, the system triggers an alert.
CPU Usage - The amount of CPU used by the Collector is monitored, and if it exceeds a defined usage threshold, the system triggers an alert.
Network Traffic - Network traffic is monitored in graphical mode. Spikes or dips can suggest network issues and will trigger an investigation.
Started Recording - How many conversations have been started. No recordings starting during expected hours suggests system wide recording failure and will trigger an investigation.
Stopped Recording - How many conversations have been ended.
All Collector Inbound Calls - Number of conversations identified as inbound.
Agent Inbound/Outbound - Tracks call direction totals (inbound/outbound). Used to detect any anomalies in call traffic.
NATS
Data captured using Collectors is streamed to the Administration Platform via Neural Autonomic Transport System (NATS) in real-time. NATS is monitored to ensure there are no issues with this process. The following data is monitored for NATS:
Cloud NATS Disconnected - The data provided by NATS on any disconnects.
Kubernetes network traffic RX / TX (Cluster) - Received and transmitted data for the NATS Cluster.
Kubernetes network traffic RX / TX (Pod) - Received and transmitted data for each NATS POD.
Audio Connector
The Audio Connector (ACC) captures calls from NATS and cloud-based Contact Center as a Service (CCaaS) telephony systems. The following data is monitored for the Audio Connector:
Collector ACC Call Starts - The number of conversations started on the ACC. Used to monitor capture rate against expected capture rate to detect if there is an issue with recording. This can be compared to the capture rate of the collectors to determine if there's an issue between the ACC and a Collector.
Collector ACC Call Ends - The number of conversations ended on the ACC. Used against call starts to detect if there are long calls being captured that should have ended.
Policy
Captured conversations are processed according to policies and data surrounding this processing is monitored by Uniphore Support t. The following data is monitored for policies:
Conversation Evaluated - The total number of conversations evaluated for each policy. All conversations are evaluated to determine if they meet the criteria of each policy. Inconsistencies indicate the need for investigation.
Policy Resolved - The total combined number of all policies that have been resolved. This should be the same number as successfully executed policies, a difference suggests a failed policy and would trigger an investigation.
Policy Execution Status - The number of successful and/or failed policies, along with the total number of policies that have run. This is used to detect issues processing policies. More than 5 failed executions in a 15 minute window suggests Policy Engine or configuration issues, which may impact compliance and SLA reporting.
Policy Resolved Over Time - The amount of policies resolved over a given time frame.
Conversation Evaluated Over Time - The amount of conversations evaluated by policies over a given time frame.
Execution Time - The time required to process a conversation based on the defined policy is monitored for each policy and every conversation. Unexpected delays in execution time suggests system issues and triggers an investigation.
Evaluation Time - The time it takes to evaluate and then resolve a policy against a conversation. An increase in Evaluation Time can indicate an issue with the system or conversation.
Conversations
Conversation statistics are monitored to detect anomalies and find potential system issues. The following statistics for the conversations in your system are monitored:
Conversations Stored - The number of conversations stored, used to confirm that conversations are in fact being captured and stored. This differs from all captured calls due to Block and Purge policies.
Audio Played - The total number of conversations that have had audio played back.
Live Calls - The total number of conversations listened to in real time using Live Monitor.
Call Processing Status - The status of each conversation being processed.
Audio Stream Processing - The status of the real-time audio streaming.
Conversations played Over Time - The total number of conversations played back over a given time frame.
Consume Chunks by Conversation - For each conversation, the system checks for missing audio chunks to identify any issues in the conversation capture process.
Audio Stream by Conversation - The real-time audio stream for each conversation.
Incident Handling
The incident handling workflow outlines the process for detecting, triaging, responding to, and resolving production incidents, and includes post-incident reviews.
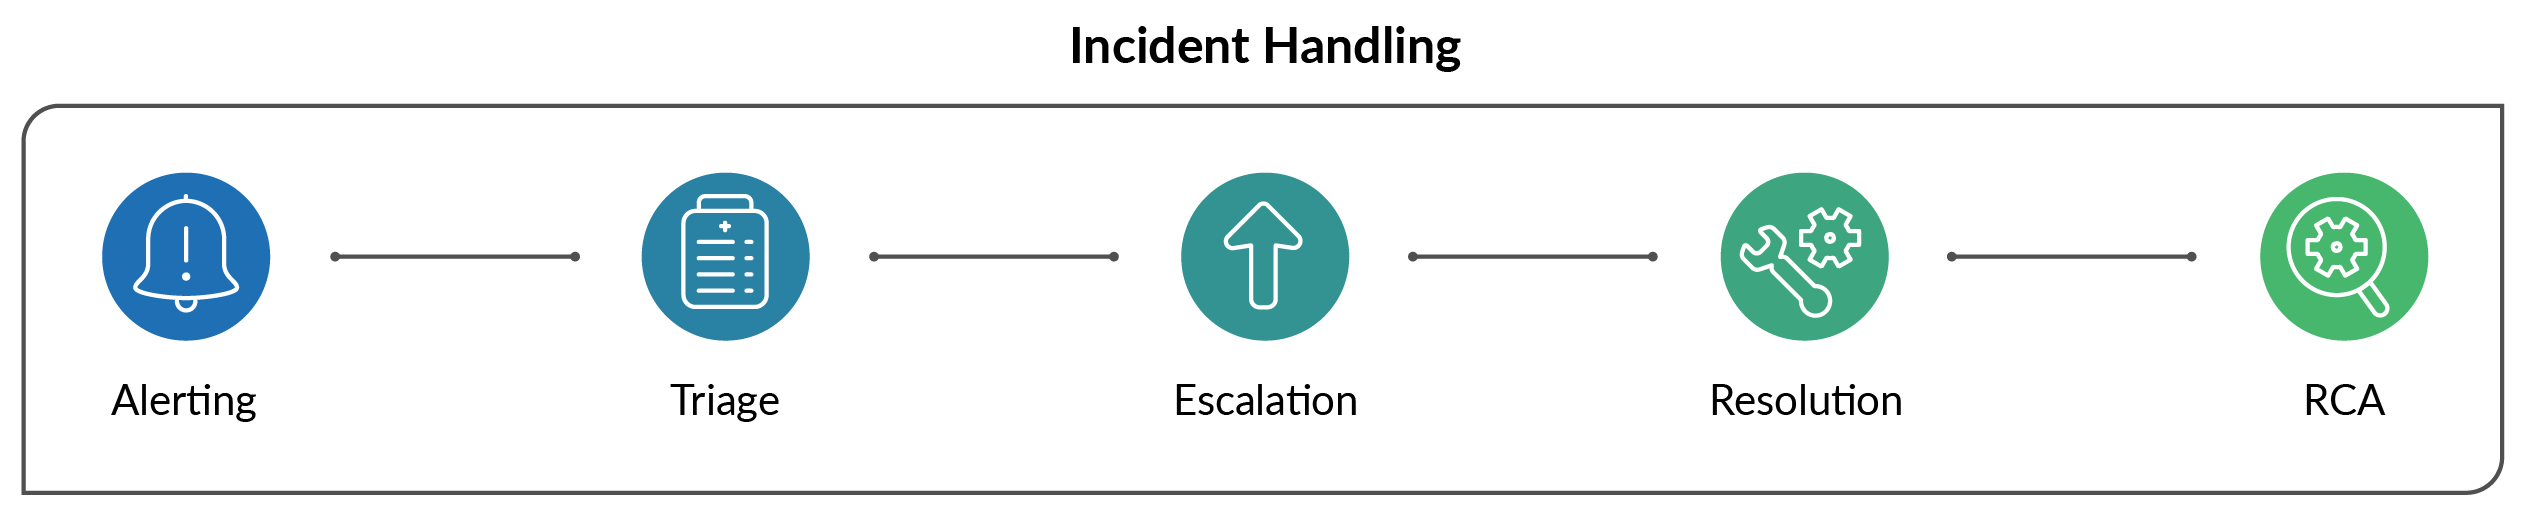
Alerting: Incidents are initially detected using an automated monitoring system. As a critical alert is detected (such as service degradation, call processing failures, etc) an on-call engineer is alerted.
Triage: The engineer performs a First-Level Check to validate the alert and determine the impact of the issue.
Escalation: The engineer escalates the issue to the appropriate team. If the issue impacts a customer, the Customer Support team or Customer Success Manager (CSM) is notified and prepares customer communications.
Resolution Tracking: All incidents are logged. The engineer updates the ticket status regularly, documenting the troubleshooting steps and actions taken, and provides clear and timely updates to stakeholders.
Post-Incident Review: For high impact or reoccurring incidents, a Root Cause Analysis (RCA) is conducted and an internal debrief meeting is held to review what went well and what went wrong, identify corrective or preventative actions, and assign owners and deadlines for follow-up tasks.
Customer Communication
The customer communication workflow outlines the processes for communicating with customers during service disruptions or incidents. Additionally, after Major incidents, feedback is collected from customers, the communication processes are reviewed to remove any gaps that might have occurred and updated if potential improvements are identified.
Important
SLAs, response times, and communication schedules depend on each customer contract with Uniphore. For the most up to date and complete information on Uniphore Support Service Level Agreements (SLAs) including commitments and definitions, click here.
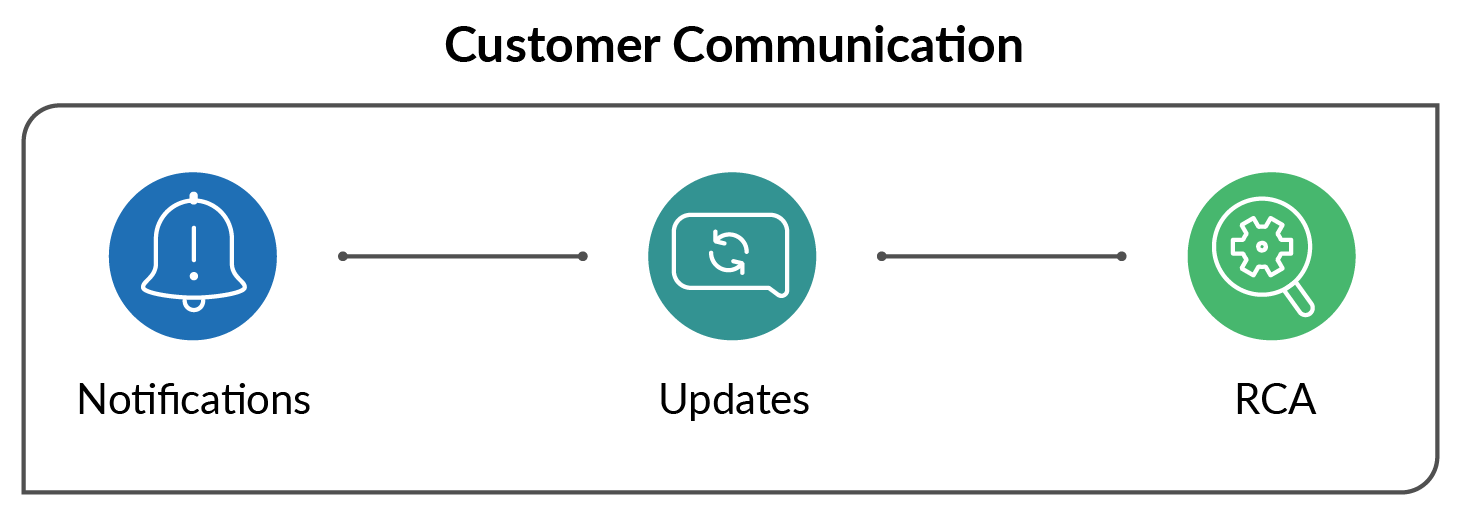 |
Initial Notifications: Customers are notified if an incident has a material impact on their service. This confirmation is made once internal triage validates the incident and not at the point of automated alert detection.
Updates: Update cadence is based on the incident priority level. All updates to the incident include the current status, outline known impacts, and provide an expected timeline for the resolution or next update. Updates regarding critical issues or regulated environments are always reviewed by a team lead or incident manager.
Post-Incident Reporting: For high impact or reoccurring incidents an RCA document is delivered to impacted customers. RCA documents contain a summary of the incident, its impact, and root cause, as well as the immediate remediation steps taken, and any long term corrective and preventative actions.