Contacts (Account View)
“Sales Interaction Agent” allows sales reps to conduct their sales communications through a human-centric approach. The centerpiece of this approach is the deep understanding of individual customer contacts' roles and their emotional status. Under the “Contacts” tab of a sales accounts deal, you can study key contacts' emotional status (by sentiment and engagement) and their influence on the deal closure as a customer pulse distribution graph. As a result, you can identify critical contacts with a negative sentiment or low engagement status that require immediate attention.
Contacts are shown in a 2x2 matrix format where the vertical dimension shows the engagement level, and the horizontal dimension shows the sentiment level. In the following screen, high engagement participants are in the top section, while low engagement participants are in the lower section. Likewise, for sentiment, detractors are in the left section, and promoters are in the right section.
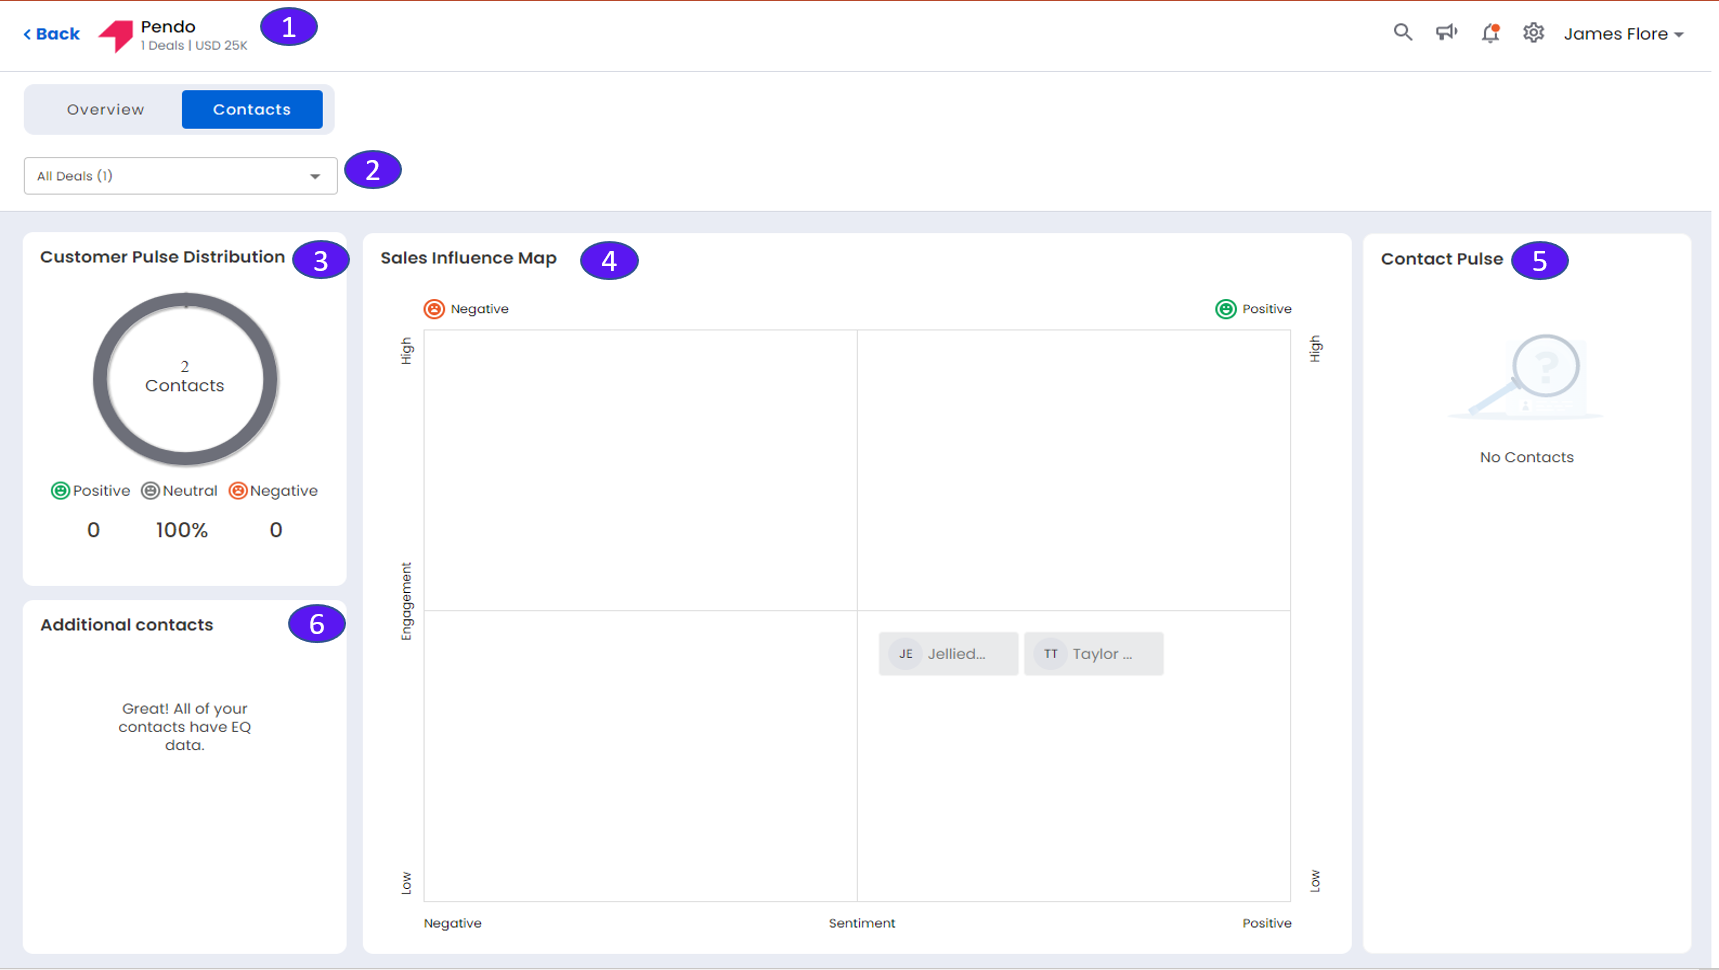
1. Top Ribbon
Shows the account name along with the number of deals associated with this account and the total deal value of this account.
2. Deal Filter
Filter by all deals or individual deals.
3. Customer Pulse Distribution
Shows the percentage of customer contacts for whom the insight levels are high, neutral, and low.
4. Sales Influence Map
It consists of four quadrants as follows:
High Engagement section: Shows customer contacts who are highly engaged
Low Engagement section: Shows customer contacts who are poorly engaged
High Sentiment section: Shows customer contacts who have high sentiment
Low Sentiment section: Shows customer contacts who have low sentiment.
5. Contact Pulse
Summary information for contact selected in the right panel: Name, Job Title, Sentiment, Engagement, Last Contacted date, Emails count, and Meetings count.
6. Additional Contacts
Displays the contacts for which there are no insights yet.