Analysis
The Analysis page helps to understand and gain insights into the various existing deals.
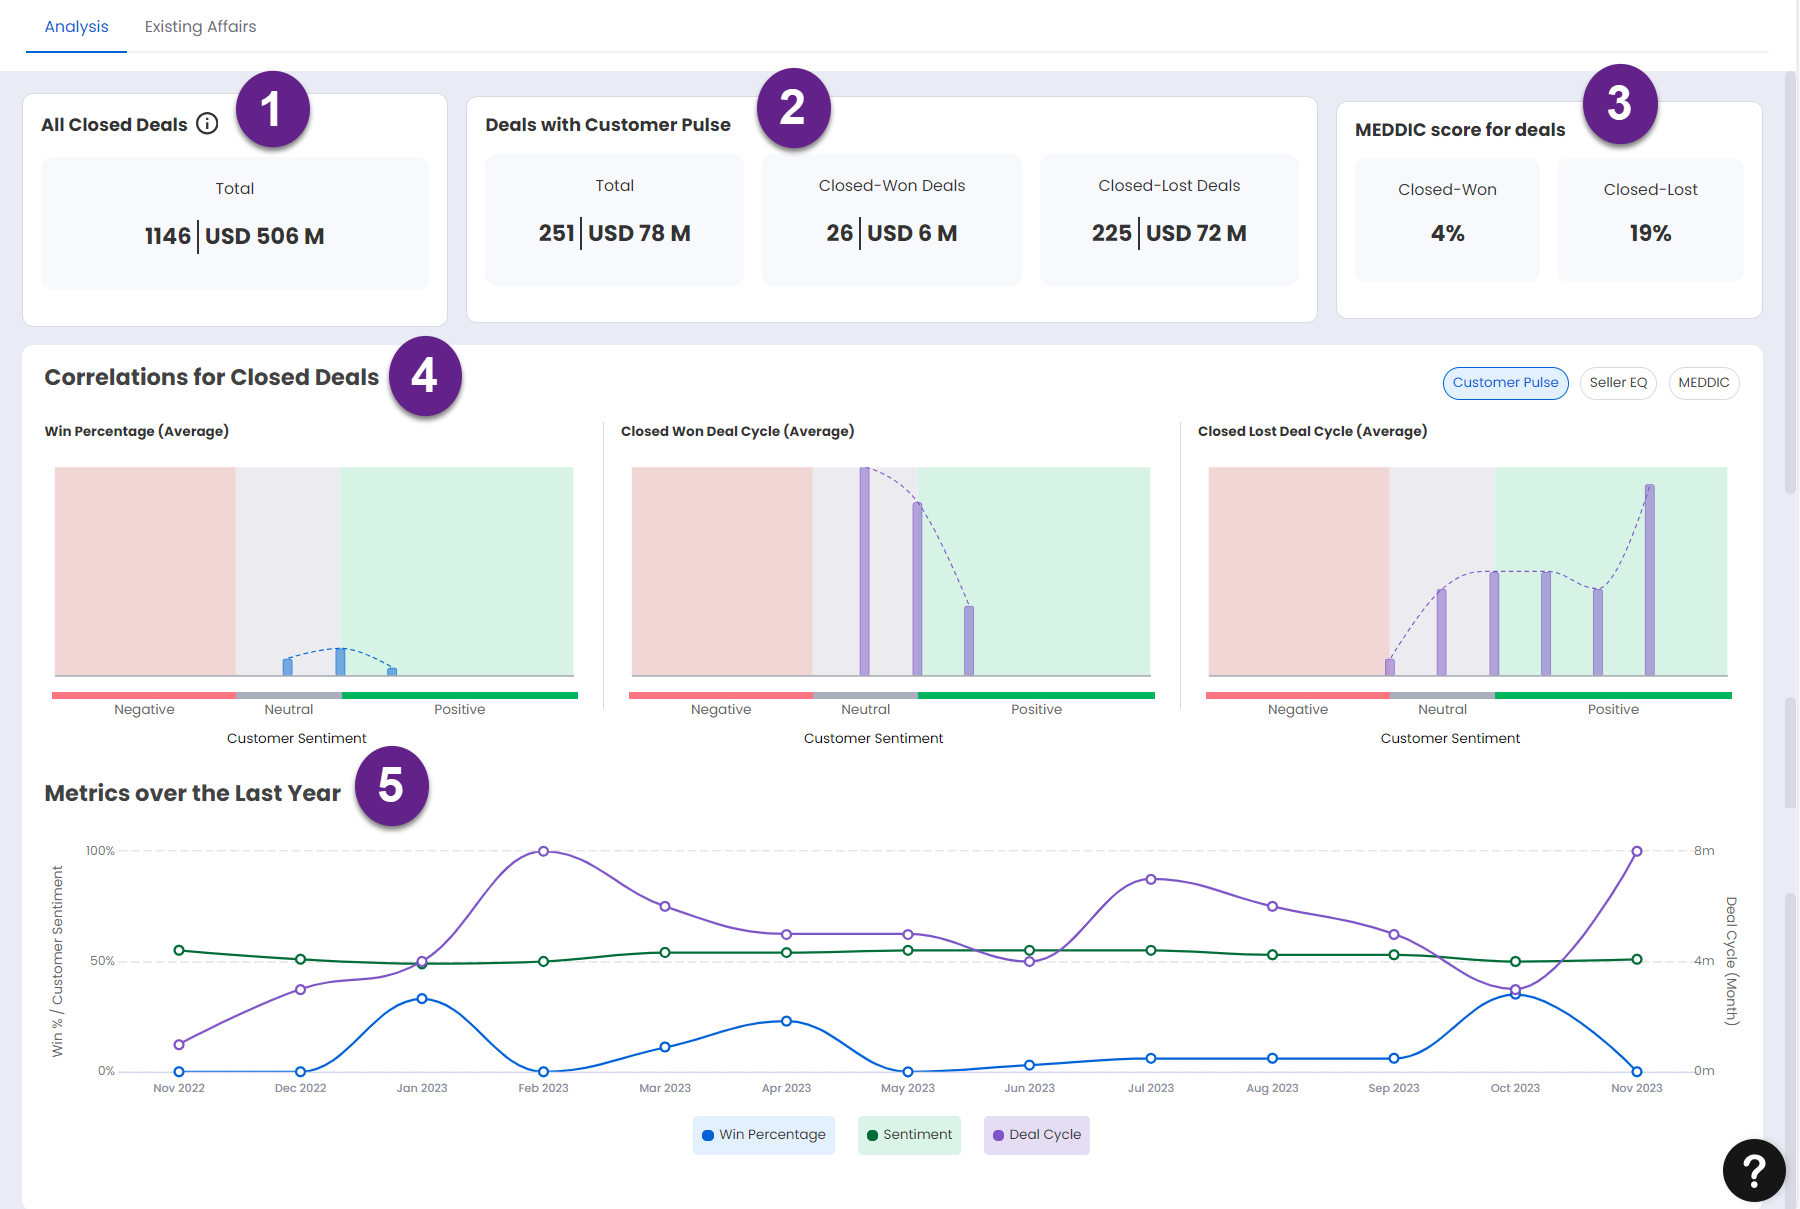
The analysis of the deals is categorized as follows:
All Closed Deals: Shows the total number of closed deals along with their combined value in USD and includes the delas with and without customer pulse.
Deals with Customer Pulse: Shows the total number of deals with customer pulse along with their combined value in USD. It also shows the Closed-Won deals and Closed-Lost deals in terms of both their numbers and value in USD.
MEDDIC Score for Deals: Shows the MEDDIC Score for Closed-Won and Closed-Lost deals in percentage.
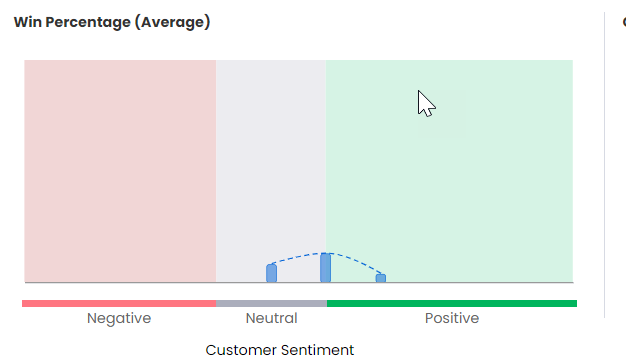
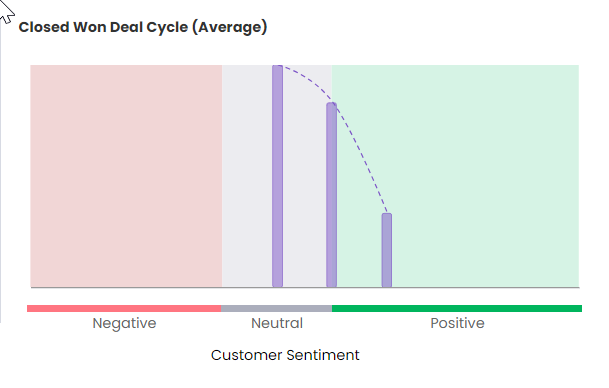
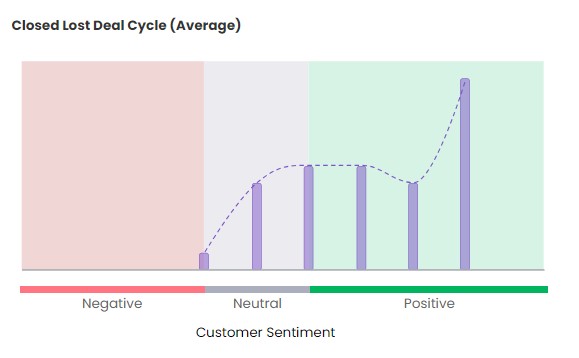
Correlations for Closed Deals: Shows the correlations of customer sentiment between the closed deals in terms of average of Win Percentage, Closed Won Deal Cycle, Closed Lost Deal Cycle and is categorized into three tabs; Customer Pulse, Seller EQ, and MEDDIC.
Win Percentage (Average)
Closed Won Deal Cycle (Average)
Closed Lost Deal Cycle (Average)
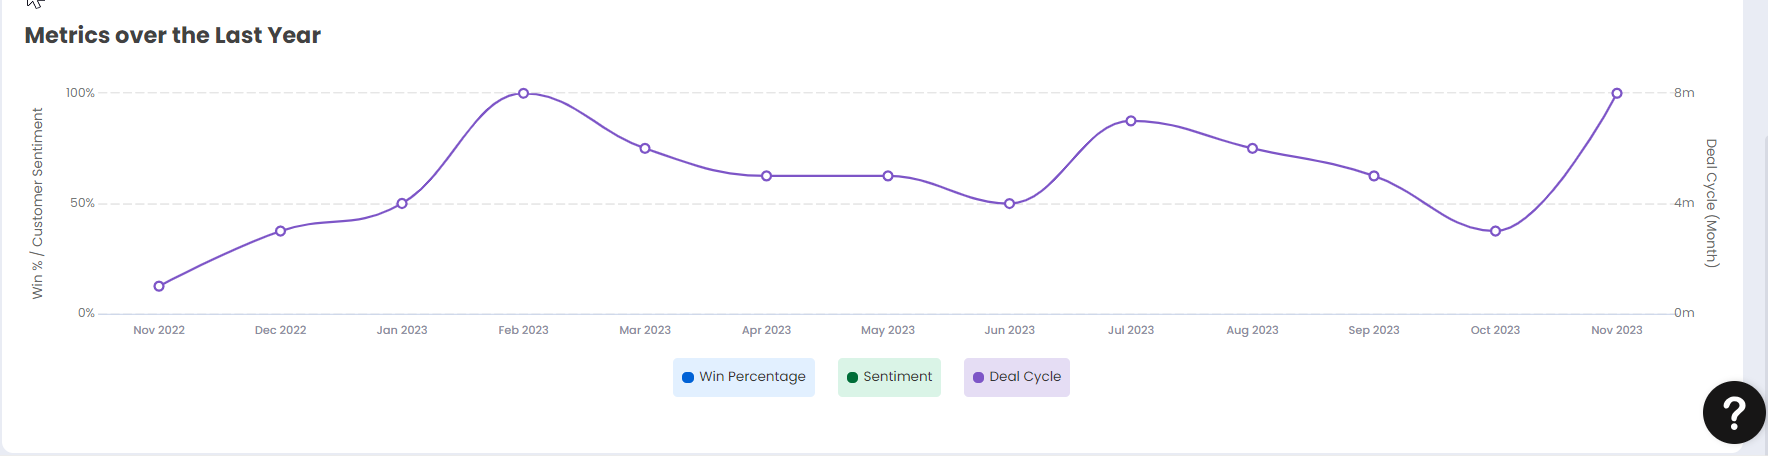
Metrics Over the Last Year:
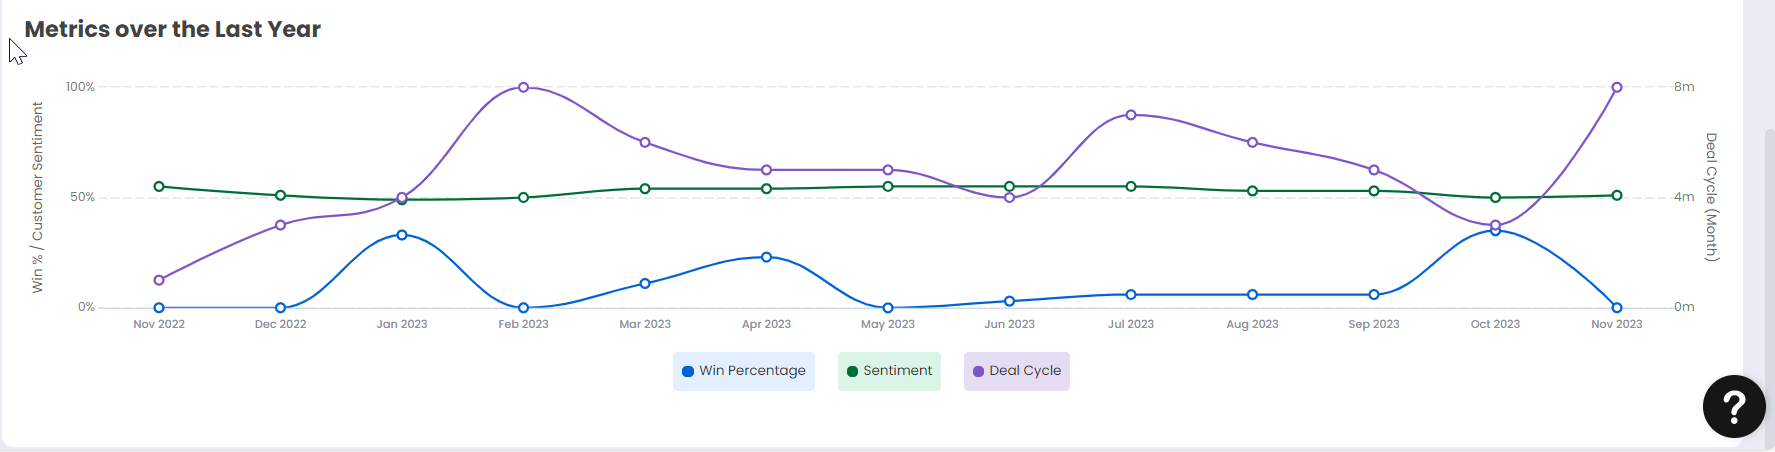
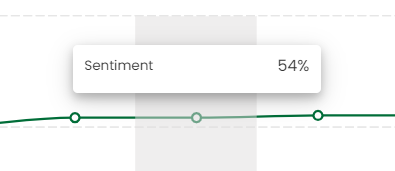
Shows the metrics of the deals of last year in terms of Win Percentage, Sentiment, and Deal Cycle. When you hover above the dots of the plotted graph the respective dot's values are displayed in percentage.
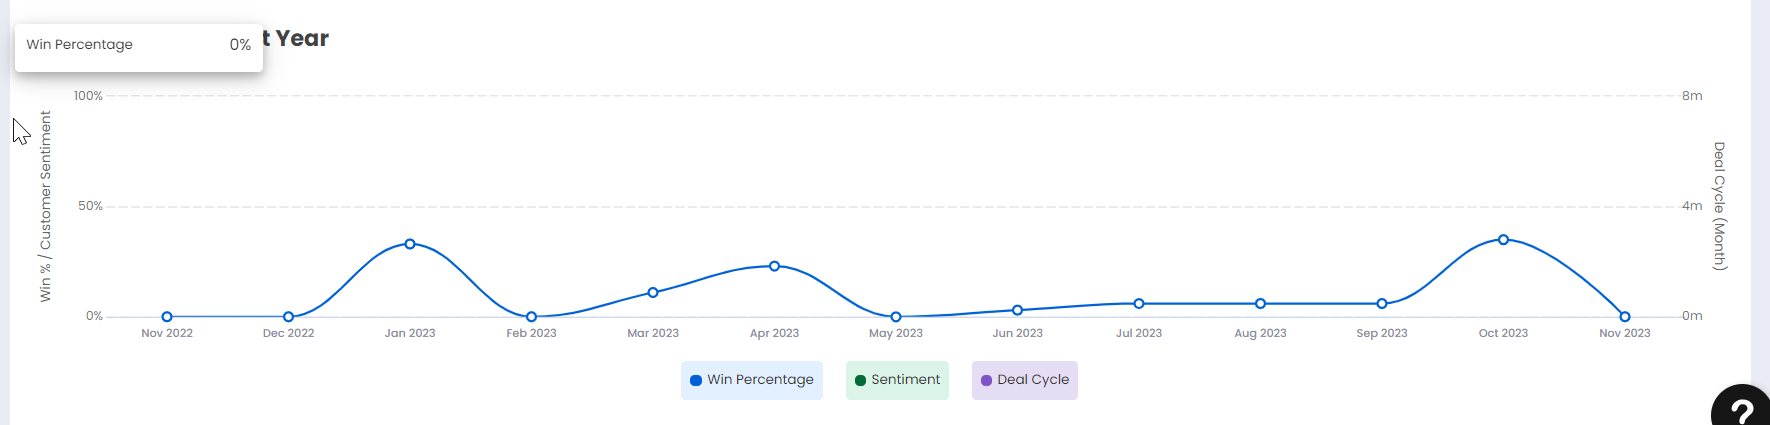
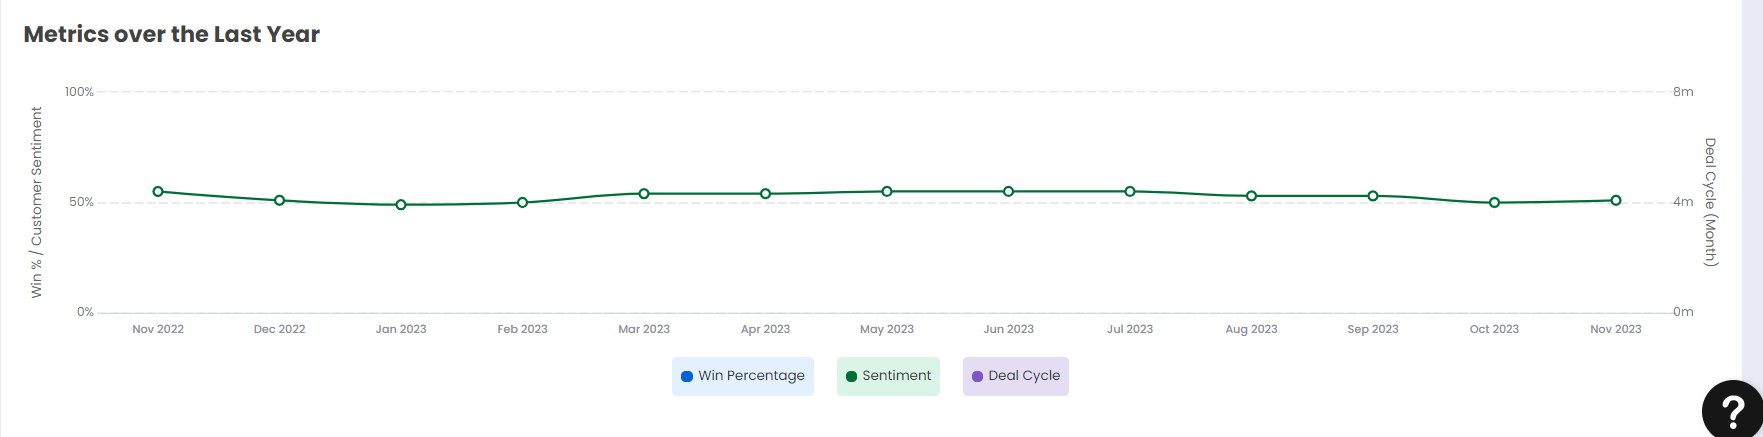
Click each of the metrics color legends to view or hide the respective metric as shown below.
Win Percentage
Sentiment
Deal Cycle
Seller EQ
