Default Dashboards
Real-Time Guidance Agent provides a default set of BI Dashboards for each account, enabling a quick way to answer many basic questions about your call center operations right 'out-of-the-box'. The Dashboards provide key metrics and graphical chart displays that reflect runtime data, as well as historic data.
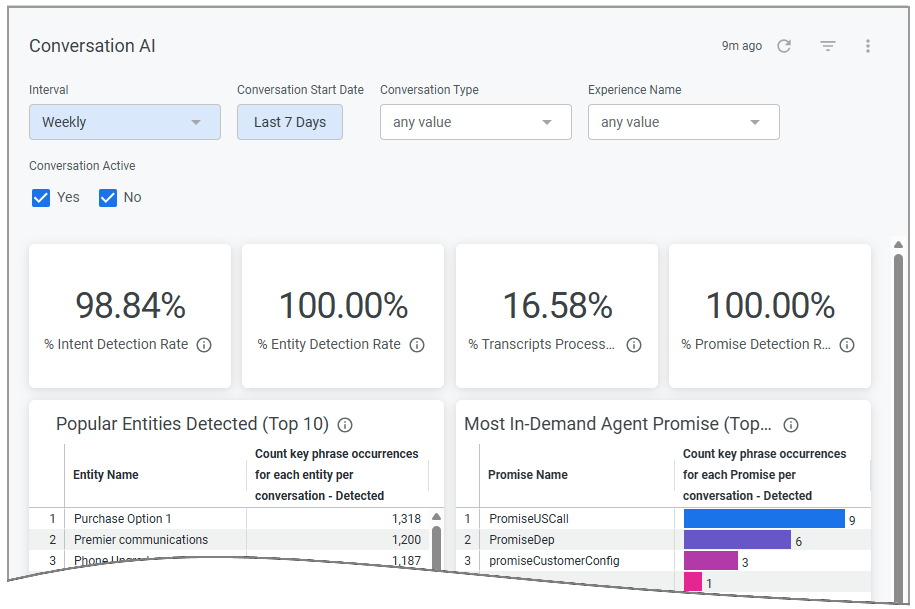
Conversation AI
| This dashboard summarizes the efficiency of AI models deployed in the current account. |
Component / Sample Questions | Details |
|---|---|
AI Metrics | Key metrics that provide at-a-glance statistics about Conversation AI activities that match the selected filter values.
|
Popular Entities Detected (Top 10) Which Entities are used most often? | A chart that shows the ten Entities that were detected the highest number of times and match the selected filter values. |
Most In-Demand Agent Promise (Top 10) What are the Promises most often made by Agents? | A chart that shows the ten Promises that were detected the highest number of times and match the selected filter values. |
Number of Flows Which Flows are executed most often? | A trend chart that shows the total count of each Flow detected with the selected filter values, displayed by Interval. |
Conversation Experience
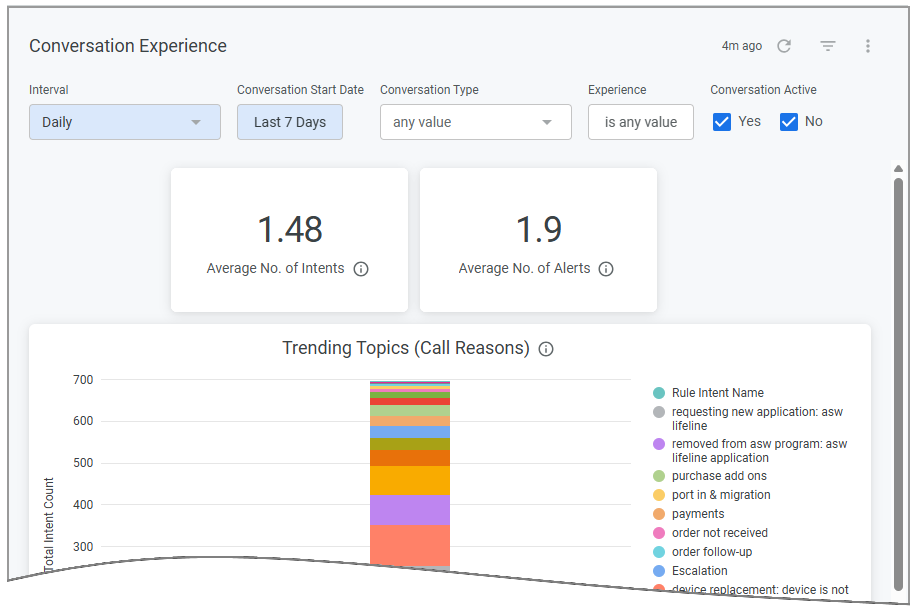 | This dashboard provides a summary of the overall experience for Agents and enterprise users. |
Component / Sample Questions | Details |
|---|---|
Experience Metrics | Key metrics that provide at-a-glance statistics about Conversation Experience activities that match the selected filter values.
|
Trending Topics (Call Reasons) What Call Reasons were most often given to Agents last month? This week? | A trend chart that shows the number of times each Call Reason (i.e., Intent) was detected with the selected filter values. |
Alert Type What types of Alerts are raised most often? What proportion of Alerts raised were Critical? | A chart that shows all Alerts raised that match the selected filter values, displayed proportionately by Alert Type. |
Alerts Distribution What Alerts were most often sent to Agents last week? To Supervisors? | A trend chart that shows the total number of Alerts detected that match the selected filter values, displaying the number received only by Agents and the number received by Supervisors. |
Promise Status Tracker How many Agent Promises are currently unfulfilled? How many are completed? | A chart that shows the number of Agent Promises detected that match the selected filter values, displayed by their current Promise Status. |
GenAI Call Summary Status
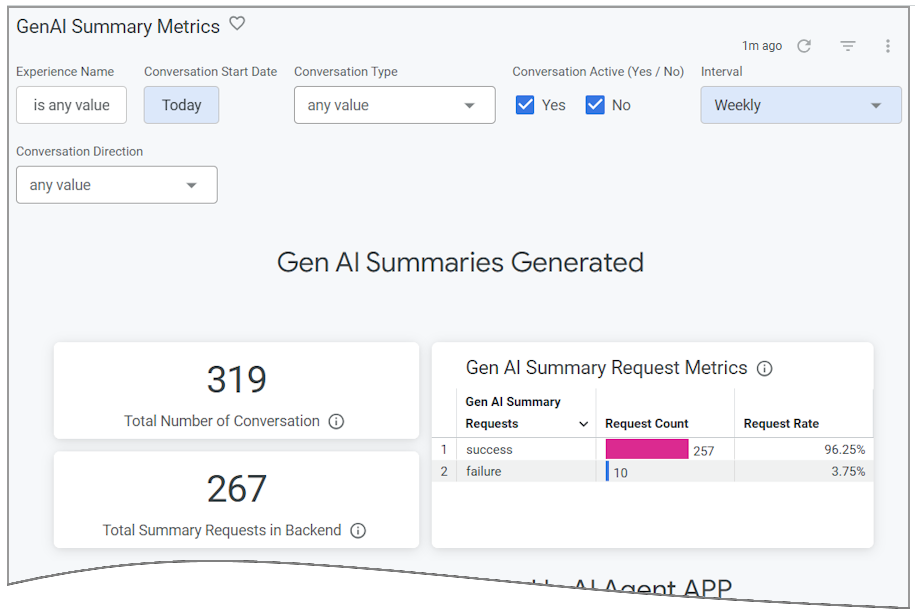 | This dashboard provides real-time visibility for generative AI-based Call Summaries created in the current account. |
Component / Sample Questions | Details |
|---|---|
GenAI Summaries Generated How many times was a GenAI Call Summary requested for processing in the back-end for my account? How many processing failures occurred in the back-end? | Shows the success or failure count of summary requests that are received from Agents for processing, based on the selected filter values. NoteThese elements show only requests arriving in the back-end, prior to results being sent to an Agent.
|
GenAI Summaries Received In the AI Agent Application How many times was a GenAI Call Summary displayed to an Agent? How many times did GenAI Call Summary data fail to be transmitted to the Agent? | Tracks the summaries as they are displayed to and handled by an Agent in the AI Agent Assist application, based on the selected filter values.
|
GenAI Summaries Submissions How many submissions were made manually? How many automatically? How many times did an Agent edit a GenAI Call Summary? | Tracks the status of submissions based on the selected filter values, including how many were submitted manually or automatically, and how many summaries were edited by the Agent prior to submission.
|
Operational: Agents
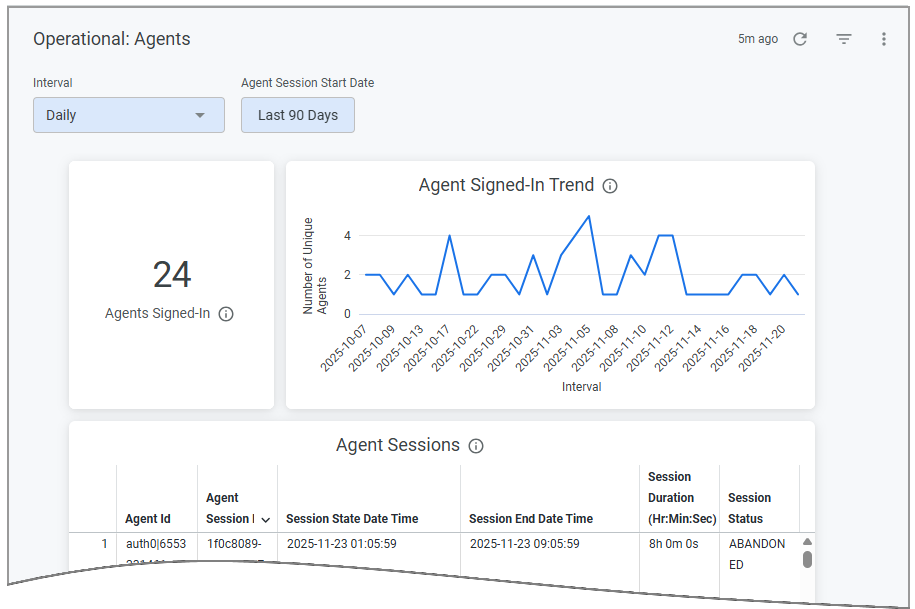 | This dashboard provides an operations-based summary of Agent presence and Session activities. |
Component / Sample Questions | Details |
|---|---|
Agent Metrics | Key metrics that provide at-a-glance statistics about Agent activities that match the selected filter values.
|
Agents Signed-In Trend How many Agents were signed in yesterday? How many last week? | A trend chart that shows the number of unique Agents who signed in during each bucket covered by the selected filter values. Each Agent is counted once per bucket (not per Agent Session). |
Agent Sessions Which Sessions were completed in under 5 minutes? Which Agents conducted the most Sessions? | A chart that shows details and completion status for each unique Agent Session that matches the selected filter values, displayed in order of Session occurrence. |
Operational: Conversations
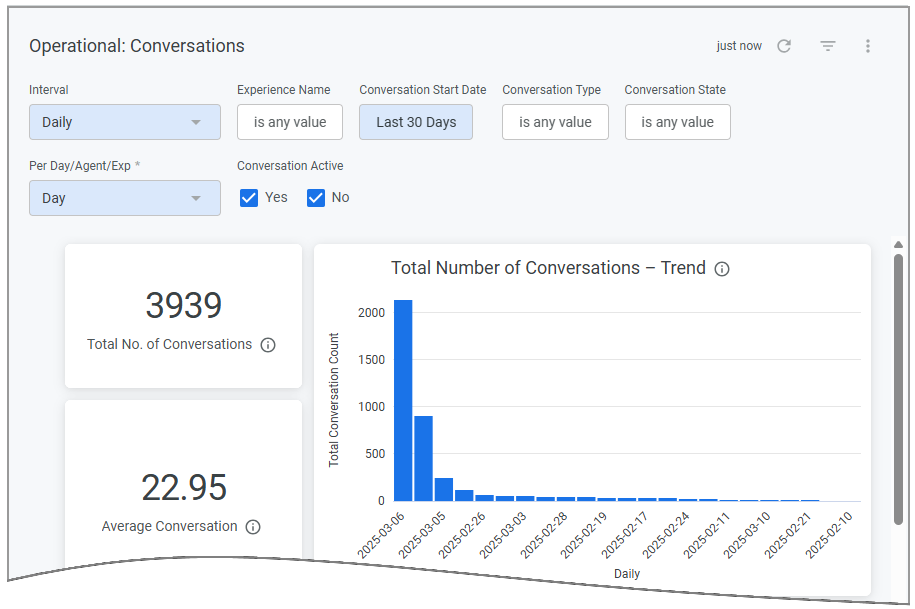 | This dashboard provides an operations-based overview, showing various aspects of Conversation performance. |
Component / Sample Questions | Details |
|---|---|
Conversation Metrics | Key metrics that provide at-a-glance statistics about Conversations that match the selected filter values.
|
Total Number of Conversations - Trend How many Conversations occurred in the last day? In the last week? | A trend chart that shows the number of Conversations that match the selected filter values, displayed by Interval. |
Number of Active Conversations (Call/Chat) – Trend How many active Conversations were there last Tuesday afternoon? | A trend chart that shows the number of active Conversations that match the selected filter values, displayed by Interval. |
Number of Active Conversations (Call/Chat) Of all active Conversations, how many were voice calls? | A chart that shows the number of active Conversations that match the selected filter values, displayed proportionately by Conversation Type. |
Average Handle Duration – Trend How long does an Agent handle a Conversation, on average? Does the average handling time change significantly from month to month? | A trend chart that shows the average duration of Conversations (i.e., from Conversation start until Summary submission) that match the selected filter values, displayed by Interval. |
ACW Timing – Trend How long does an Agent perform after call work on a Conversation? Does after call work time change significantly from month to month? | A trend chart that shows the average duration of After Call Work (ACW) by the Agent prior to submitting the Call Summary (i.e., the time between the end of the Conversation and Summary submission), displayed by Interval. |
Conversations – Trend What is the overall trend for Conversations, as they relate to our Experiences and Agents, per day? Per week? | A trend chart that shows total count for Conversations that match the selected filter values, displayed by Interval. In addition, for each Interval, an average count is displayed per Agent, per Day and per Experience. |
Number of Concurrent Agents - Trend How many Agents were active in a conversation simultaneously last week? How many three hours ago? | A trend chart that shows the number of Agents simultaneously active in conversations, according to the selected filter values, displayed by Interval. |
Average Number of Calls Handled Per Agent (Top 10) Who are the top performing Agents this month? | Names of the ten Agents who took the highest average number of Conversations matching the selected filter values, by the number of calls they handled, in descending order. |